Abstract
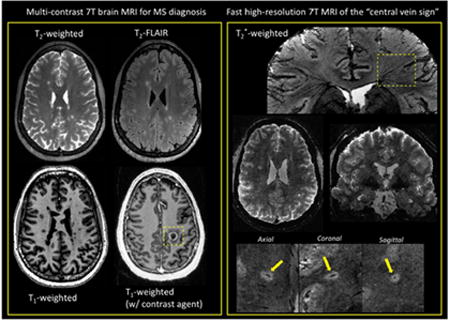
The long-standing relationship between ultra-high-field (7 tesla) MRI and multiple sclerosis (MS) has brought new insights to our understanding of lesion evolution and its associated pathology. With the recent FDA approval of a commercially available scanner, 7 T MRI is finally entering the clinic with great expectations about its potential added value. By looking through the prism of MS diagnosis, this perspective article discusses current limitations and prospects of 7 T MRI techniques relevant to helping clinicians diagnose patients encountered in daily practice.
Keywords: Multiple sclerosis, Diagnosis, Magnetic Resonance Imaging, Ultra-high-field, Brain
Graphical abstract
1. Introduction
Since the first investigative ultra-high-field (7 T) MRI studies in multiple sclerosis (MS) patients published a decade ago [1-3], 7 T MRI in MS has brought new insights into lesion evolution and its associated pathology [4]. These studies illustrate that 7 T MRI can improve visualization of small brain structures and subtle pathologies due to the increased signal-to-noise ratio (SNR), spatial resolution, and contrast-to-noise ratio (CNR).
However, these advantages are not without drawbacks. Indeed, image artifacts related to the inhomogeneities in the static (B0) magnetic field, radiofrequency (RF) transmit (B1+) and receive (B1-) fields, and subject motion, are exacerbated at ultra-high-field. Although well-tolerated by MS patients, 7 T scanning also raises serious safety concerns regarding RF energy deposition, which can quickly exceed the specific absorption rate (SAR) limitations. This issue is of particular importance in patient populations where different types of implants (usually not yet tested at this field strength) are frequently encountered.
With the first FDA approval of a commercially available 7 T scanner in October 2017 (https://www.fda.gov/NewsEvents/Newsroom/PressAnnouncements/ucm580154.htm), ultra-high-field MRI is finally entering the MS clinic and is generating mixed expectations among clinicians and clinical scientists. While proponents of 7 T MRI believe this advanced platform will reshape the current practice in MS imaging, skeptics still wonder about the added value of this high-cost device.
This perspective article is aimed at setting realistic, yet promising, expectations for this new clinical tool. More particularly, I will look through the prism of MS diagnosis by addressing two frequently asked questions: “Can 7 T MRI be used routinely for the diagnosis of MS?” and “Can 7 T MRI improve diagnostic accuracy?” Therefore, this article will focus on MRI techniques that are directly related to current, as well as emerging, MRI criteria for the diagnosis of MS.
Before answering these two questions, it is appropriate to first summarize the current role of MRI in MS diagnosis. Even before its incorporation into the international diagnostic criteria for MS in 2001, brain MRI became a crucial part of the diagnostic work-up for patients with suspected MS. Spinal cord MRI is also useful for diagnosis, especially in the case of patients with symptoms indicative of spinal cord disease or if the brain MRI is not conclusive. However, spinal cord MRI will not be discussed here as it not yet clinically feasible at 7 T [5]. The clinical value of brain MRI relies on its high sensitivity for noninvasively visualizing focal white matter (WM) MS lesions, which are characteristically located in the posterior fossa, juxtacortical, and periventricular regions. When combined with the injection of a gadolinium-based contrast agent (GBCA), brain MRI also enables clinicians to specifically detect recently developed WM lesions. Indeed, the T1 signal enhancement generated by GBCA indicates a compromised blood-brain-barrier associated with a newly forming lesion. These MRI features help clinicians demonstrate dissemination in space (DIS) (hyperintense lesions on T2 contrast in two or more characteristic WM locations) and dissemination in time (DIT) (new hyperintense T2 lesion and/or gadolinium-enhancing T1 lesion) in patients with a typical clinically isolated syndrome (CIS) suggestive of MS, as recommended by the current international diagnostic criteria [6]. For the past few years, the use of these MRI criteria has allowed clinicians to diagnose patients earlier (often with a single MRI scan), as well as to treat earlier with disease-modifying therapies known to provide substantial benefits for the disease outcome [7].
2. “Can 7 T brain MRI be used routinely for the diagnosis of MS?”
To address this first question, I will discuss the sequences included in the standard clinical brain MRI protocol required for MS diagnosis as well as their implementation, performance, and limitations at 7 T. A special emphasis will be placed on achieving whole brain coverage, submillimeter spatial resolution, and fast scan time by tapping into the potential of recent technical advancements.
Recommended brain MRI MS protocol
Per the recent MRI guidelines provided by the European consortium of MS experts, called MAGNIMS (Magnetic Resonance Imaging in MS) [8], the standard brain MRI protocol for diagnostic work-up should preferably be performed at 3 T in a reasonable scan time (~ 30 min). This standardized protocol should include axial T1-weighted (T1w) images before and after GBCA, axial T2-weighted (T2w) and proton-density (or T2-FLAIR) images, and sagittal two-dimensional (2D) or isotropic three-dimensional (3D) T2-FLAIR images. Therefore, 2D conventional spin echo (SE) and 2D/3D turbo spin echo (TSE) sequences are the workhorses of any MS brain protocol. The current level of performance of those acquisitions at 3 T, which combine excellent image quality with high acquisition speed, set the bar high for their 7 T counterparts.
2D/3D (turbo) spin-echo imaging
Unfortunately, spin-echo based sequences are known to be difficult to optimize at ultra-high-field. Although they are rather insensitive to static B0 field inhomogeneities, which is an advantage at 7 T, they suffer from high radiofrequency (RF) power deposition due to the multiple refocusing spin-echo pulses. Consequently, running a SE/TSE sequence within the safety limits of specific absorption deposition (SAR) is usually done by reducing the number of slices and/or increasing the repetition time (TR), ultimately leading to prohibitive scan times (>10 min) when whole brain coverage is needed. The recent development of SMS imaging, which significantly reduces scan times by simultaneously acquiring multiple slices, has the potential to solve these issues. However, SMS is prone to high RF energy deposition, which can quickly reach the SAR limit. To avoid this issue at 7 T, tailored RF pulses (called PINS) combined with SMS were implemented in a T2w 2D multi-slice TSE sequence covering the whole brain with a spatial resolution of 1 × 1 × 2 mm3 and a scan time of 2 min 30 sec [9]. This type of solution should be further explored for 2D multi-slice T1-weighted and proton-density weighted acquisitions.
Per the MAGNIMS guidelines, 3D TSE sequences can be integrated in the diagnostic protocol, since they provide thin contiguous slices and isotropic multiplanar reconstructions, resulting in easier detection of small lesions. Optimized single-slab 3D TSE pulse sequences have shown robust image quality at 1.5 T and 3 T while achieving clinically compatible acquisition times [10]. These sequences can be used at 7 T with very long RF pulse trains and variable flip angles, however, the images are affected by the spatial inhomogeneity of the transmit B1+ field, which creates signal voids and variable contrast throughout the brain (Figure 1, left). To mitigate the B1+ dependence, it was recently proposed to replace the standard RF pulses by specific kT-point pulses, which allows acquisition of T2w brain images at 0.7 mm isotropic in ~5 - 7 min with very mild residual B1+ effects [11]. One can also produce T2 -FLAIR images with a 3D TSE sequence by introducing an inversion pulse applied at a time TI before the excitation pulse. T2-FLAIR images are particularly useful to clinicians because the suppression of the cerebrospinal fluid (CSF) signal facilitates the detection of hyperintense lesions. However, the prolonged T1 times at 7 T prevent gray matter and white matter signals from being fully recovered at the inversion time that nulls CSF, thus resulting in unwanted T1 weighting on FLAIR images and suboptimal SNR (Figure 1, right). Moreover, the intense use of adiabatic inversion pulses (to create uniform suppression of CSF despite the heterogeneous amplitude of the B1+ field) and multiple refocusing pulses makes it difficult to remain below the maximum allowed SAR at 7 T. Nonetheless, it was demonstrated that 7T T2-FLAIR is feasible when combining magnetization-preparation pre-pulses (to reduce undesirable T1 weighting) with long echo-train lengths of variable flip angles (to restrict SAR to acceptable levels), with scan time varying between 5 min to 13 min and a spatial resolution of 0.8 mm isotropic [12, 13].
Figure 1.
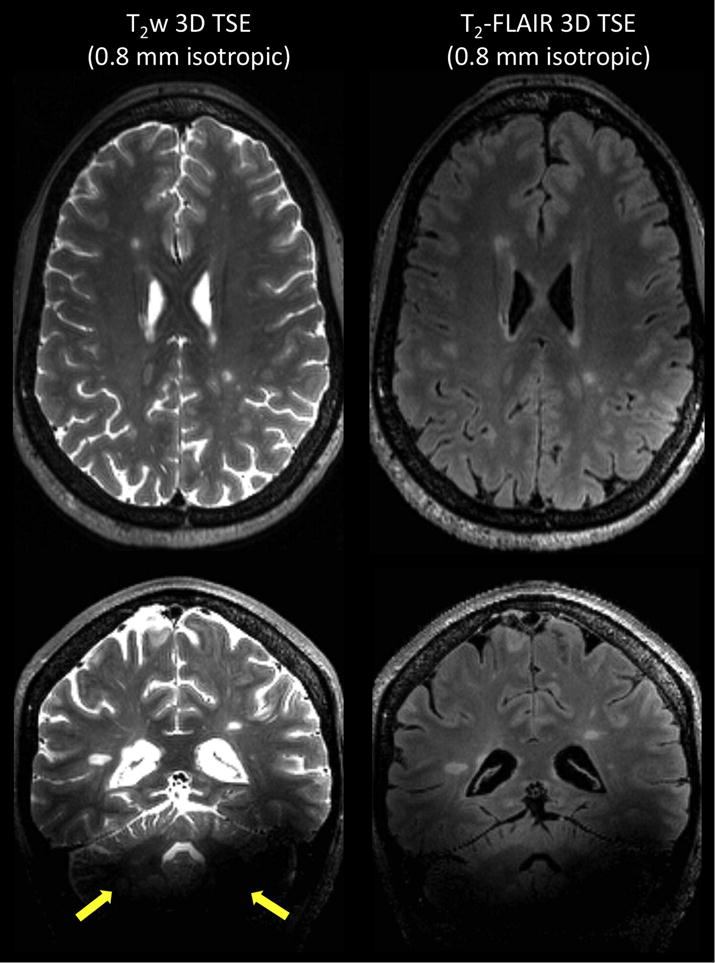
Left: T2-weighted images acquired with 3D SPACE (TSE with variable flip angles) at 0.8 mm isotropic. Main sequence parameters: TE = 399 ms, TR = 8000 ms, R = 4 (GRAPPA), scan time = 6 min 20 sec. In addition to the image bias field coming from the receive B1- field (32-channel head coil used here), there are signal voids in the cerebellum on both contrasts due to poor homogeneity of the transmit B1+ field (yellow arrows). Right: T2-FLAIR images acquired using 3D SPACE with inversion recovery at 0.8 mm isotropic. Main sequence parameters: TI =2150 ms, TE = 399 ms, TR = 8000 ms, R = 4 (GRAPPA), scan time = 6 min 26 sec. Although CSF suppression is fairly homogenous across the brain on T2-FLAIR, tissue and lesion contrasts are reduced due to some T1 weighting effects coming from the elongated T1 values at 7 T.
3D gradient-echo imaging (MPRAGE, MP2RAGE)
There is a growing trend across specialized MS imaging centers to integrate T1w 3D gradient-echo (GRE) sequences into diagnostic brain protocols [14]. One sequence frequently used is the 3D inversion recovery-prepared, T1-weighted, spoiled-gradient-echo sequence, also called 3D MPRAGE (magnetization prepared rapid gradient-echo) [15], which can provide whole-brain T1w images at 1 mm isotropic in about 5 min on a 3 T scanner. Interestingly, GRE sequences are particularly well suited for ultra-high-field imaging due to their low RF deposition and their ability to produce high-quality images at submillimeter resolution with high signal and contrast. For example, 3D MPRAGE can be easily set up at 7 T for generating 0.7 mm isotropic images in ~6 min. However, the T1w images will suffer from non-uniform image intensities across the brain generated by inhomogeneities in the transmit B1+ field, as well as in the receive B1- field due to the 32-channel head coil (Figure 2, left). Several solutions have been proposed to correct the nonuniformity issue, including tailored adiabatic inversion pulses insensitive to transmit RF variations [16] and acquisition of a separate proton-density-weighted 3D GRE [17]. The latter strategy was adapted in a modified version of the MPRAGE sequence introduced as the MP2RAGE (magnetization-prepared 2 rapid acquisition gradient echo) [18], which simultaneously acquires two volumes at different inversion times; the combination of these two images delivers a synthetic T1-weighted image with uniform image intensity. When used with optimized low-B1+ adiabatic pulses and/or thin high-permittivity dielectric pads placed behind the neck, inversion efficiency can be improved across the whole brain, further improving the MP2RAGE images [19] (Figure 2, right). One current hurdle impeding routine use of MP2RAGE in clinical protocols is its relatively long scan time (~ 10 min for MP2RAGE at ~ 0.7 mm). To reduce acquisition time, one strategy is to increase the acceleration provided by parallel imaging (PI) using the controlled aliasing 2D-CAIPIRINHA undersampling pattern [20], which reduces the g-factor penalty and was shown to cut the scan time in half on a 3 T MPRAGE, while preserving SNR and CNR. A similar approach was recently demonstrated to be feasible for 7 T MP2RAGE, reducing the scan time to ~ 4 min while preserving image contrast [21]. One further step in scan-time reduction is to use the recently introduced wave-CAIPI technique, which combines k-space undersampling of 2D-CAIPIRINHA and a modified version of bunched phase encoding/zigzag sampling to create a staggered corkscrew trajectory [22]. This novel wave-CAIPI technique was recently shown to achieve a 12-fold acceleration, allowing collection of 1 mm isotropic 7T MPRAGE images in 57 s [23].
Figure 2.
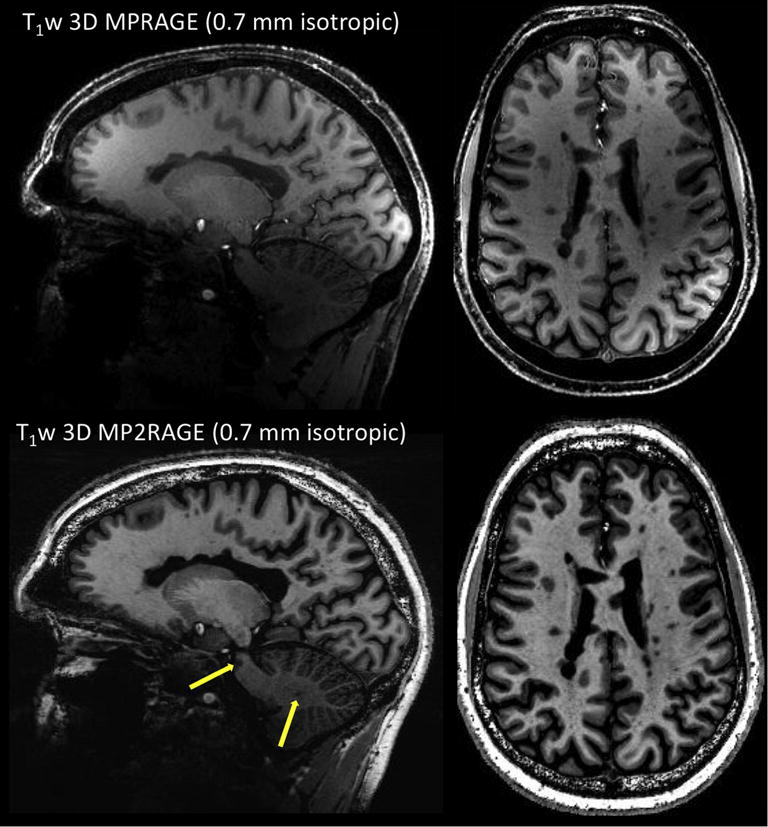
Top: T1-weighted 3D MPRAGE acquired at 0.7 mm isotropic. Main sequence parameters: TI = 1050 ms, FA = 7 degrees, TE = 2.96 ms, TR = 2200 ms, R = 2 (GRAPPA), scan time = 6 min 35 sec. Bottom: T1-weighted 3D MP2RAGE acquired at 0.7 mm isotropic. Main sequence parameters: TI1 = 800 ms, TI2 = 2700 ms, FA = 4, 5 degrees, TE = 3 ms, TR = 6000 ms, R = 3 (GRAPPA), scan time = 10 min 3 sec. Both acquisitions are from the same MS patient. Compared to MPRAGE, MP2RAGE image is almost entirely free of image bias and allows detection of MS-related pathology in the pons and cerebellum (yellow arrows).
Post-contrast imaging
The last mandatory item of any brain MRI protocol for MS diagnosis is T1-weighted imaging acquired after a minimum 5-minute delay post-injection of GBCA. At 3 T, 2D conventional spin-echo and 3D gradient-echo (without inversion recovery) are the recommended sequences for detecting enhancing lesions, although the superiority of 3D GRE was recently reported [24]. It is unclear which of these sequences is most sensitive at 7 T and whether the recommendation of not using an inversion recovery for the 3D GRE is valid in this context. Indeed, T1 and T2 relaxation times of tissues, as well as the r1 relaxivity of GBCA, change dramatically at 7 T [25], and these changes will affect contrast enhancement on all of these sequences. Therefore, future theoretical and experimental studies comparing the different T1-weighted techniques for maximum contrast enhancement at 7 T will be useful. Note that MP2RAGE could also be candidate for post-injection T1-weighted imaging due to its robust clinical-like image quality and its ability to depict enhancing lesions (Figure 3).
Figure 3.
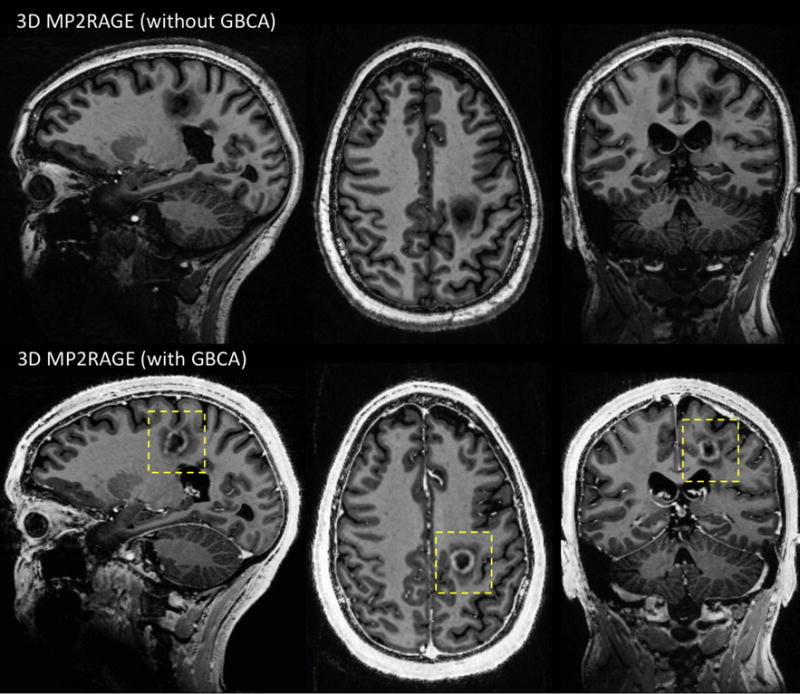
Top: T1-weighted 3D MP2RAGE before injection of GBCA. Bottom: T1-weighted 3D MP2RAGE acquired 5 minutes after injection of GBCA (single dose of gadobutrol). Both acquisitions are from the same MS patient and performed at 0.7 mm isotropic with the same sequence parameters: TI1 = 800 ms, TI2 = 2700 ms, FA = 4, 5 degrees, TE = 3 ms, TR = 6000 ms, R = 3 (GRAPPA), scan time = 10 min 3 sec.
From this discussion, it is fair to conclude that running a full diagnostic protocol under 30 minutes is currently not possible at 7 T. This is primarily due to the inability to acquire all the required contrasts with an image quality and a scan time that would meet the clinical standards. Nonetheless, innovative solutions for overcoming the current limitations specific to 7 T already exist, and future studies should also investigate whether a more limited set of sequences provides adequate diagnostic information. If integrated by manufacturers and proven to be robust in clinical population, these developments will enable clinicians to perform clinical brain examination in less than 30 minutes.
3. “Can 7 T brain MRI improve the accuracy of the diagnosis?”
This second question arises from the fact that current MRI criteria are still imperfect in accurately diagnosing MS. Many neurological conditions can cause nonspecific hyperintense T2 lesions, which are often clinically unimportant, and these MRI mimics of MS may result in misdiagnosis [26]. Consequently, there is a need for more accurate, and more pathologically specific, MRI criteria to better differentiate MS from its MRI mimics.
Central vein sign
A consensus statement from the North American Imaging in Multiple Sclerosis (NAIMS) Cooperative has recently proposed an investigation of the clinical value of the central vein sign (CVS) as a MRI marker for improving the differential diagnosis of MS, and possibly simplifying the MRI diagnostic criteria [27]. The CVS is readily detectable on T2*-weighted (T2*w) scans due to the paramagnetic nature of venous blood, and this is particularly relevant to MS since it is known from pathological studies that small veins are frequently observed to run centrally through MS lesions. Because the lumens of these veins can be on the order of 250 μm or less [28], high spatial resolution is a key feature when assessing central veins. Obviously, 7T MRI is extremely well positioned to address this need, since susceptibility-based contrast at 7 T depicts exquisite details of the microstructure of the brain [29]. As a matter of fact, 7 T imaging studies led the charge in investigating the CVS for the differential diagnosis [3, 30]. Subsequent imaging studies have been performed at 3 T, where high-isotropic-resolution and fast T2*w imaging can now be now achieved [31]. However, the increased CNR at 7 T results in better conspicuity of the veins, which is particularly useful when assessing difficult cases (e.g. patients with a few small lesions).
2D/3D gradient echo imaging (T2*-weighted, SWI)
T2* -weighted images are traditionally acquired at 7 T with a RF-spoiled GRE pulse sequence using 2D or 3D encoding. 2D multi-slice GRE can be easily performed with an in-plane resolution ranging from 500 μm down to 250 μm and a slice thickness of ~ 1 mm (Figure 4, left). Optimal T2* contrast can be achieved using flip angles smaller than the Ernst angle, with echo time (TE) on the order of the T2* of tissues of interest (20-35 ms for white matter at 7 T) and repetition (1000-1500 ms at 7 T). However, this type of acquisition results time (TR) on the order of the T1 in long scan times (8 to 10 min). Another limitation is the small number of acquired slices, resulting in reduced brain coverage; this is problematic for evaluating the CVS, since MS lesions can be found throughout the brain.
Figure 4.
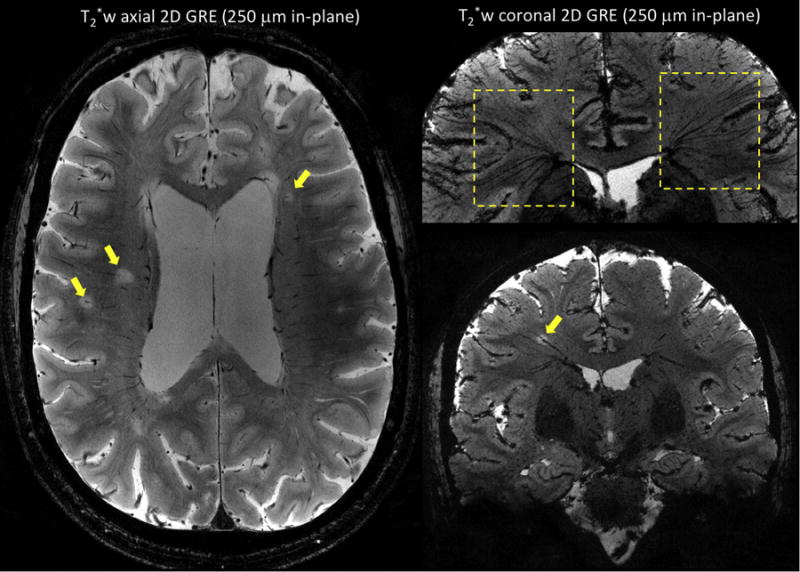
T2*-weighted 2D gradient-echo sequences performed on two MS patients at 7 T using an in-plane resolution of 250 μm × 250 μm, a slice thickness of 1 mm, and 25 contiguous slices. Image on left (first MS patient) was acquired in an axial orientation and shows multiple white matter MS lesions with a central vein (arrows). Images on the right (second MS patient) were acquired in a coronal orientation, and minimum intensity projection was performed for the image on top. The ‘fan-shaped’ distribution of the deep medullary veins (top image, dashed boxes) and the oblique course of a vein running centrally through a MS lesion (bottom image, yellow arrow) are illustrated. Main sequence parameters were: FA = 50 degrees, TE = 20 ms, TR = 1300 ms, R = 2 (GRAPPA), scan time = 8 min 40 sec.
For achieving whole-brain coverage, one can use 3D GRE with shorter TR and lower flip angle, the latter reducing sensitivity to B1+ inhomogeneity. When used with flow compensation, 3D GRE is the basis for Susceptibility Weighted Imaging (SWI), which combines magnitude and phase (after high pass filtering and masking) to enhance visualization of veins and microbleeds [32]. A 7T SWI protocol can be routinely performed with short scan times (~ 6-7 min) [33]. However, scan time increases significantly when whole-brain coverage, high in-plane resolution (0.5 × 0.5 mm), and thin slices (< 1 mm) are required. Anisotropic voxels dimensions can also be problematic for some veins and lesions, since deep medullary veins are known to have a “fan-shaped” distribution pattern, with oblique orientations in the periventricular and deep white matter where MS lesions are commonly found (Figure 4, right). Therefore, the use of isotropic voxel dimensions is key for evaluating the CVS, as it enables one to reformat images in any desired plane and thus to accurately identify veins irrespective of their orientation. This feature also becomes crucial when assessing the centrality of the vein relative to the lesion boundaries.
Novel sampling strategies (3D EPI, 2D CAIPI, Wave-CAIPI)
Despite the use of 32-channel head arrays, which are particularly favorable for undersampling along both phase encoding axes of a 3D GRE acquisition, traditional PI techniques (e.g. GRAPPA and SENSE) cannot be pushed beyond a total acceleration factor (R) of 3 to 4 without incurring too high of an SNR penalty. Therefore, more time-efficient k-space sampling strategies are needed to allow fast, high-isotropic-resolution, volumetric T2* imaging in the clinical setting. Fortunately, the past few years have witnessed intense development of novel and highly accelerated 3D techniques [34]
One of the recently proposed strategies to speed up acquisition time is to replace the 3D GRE by a 3D echo-planar-imaging (EPI) sequence. Initially tested at 7 T for fMRI applications [35], 3D EPI has been also applied to high-resolution anatomical brain imaging using a multi-shot (segmented) acquisition [36]. Compared to a conventional GRE sequence collecting one line of k-space per TR, this segmented technique collects n lines per TR (corresponding to an EPI factor of n) using a conventional Cartesian interleaved k-space trajectory and thus providing a n-fold acceleration at the same TR. This considerable gain in speed does not come at the cost of significant image artifacts if the EPI train length is kept short enough (on the order of the T2* of brain tissues) to limit image blurring and distortions. When combined with navigator echoes to reduce artifacts due to B0 variation and odd-even line discrepancy, this technique can acquire whole-brain 7 T images of a MS patient at 0.5 mm isotropic in less than 8 min (Figure 5). Using PI in the primary phase-encoding direction can further decrease the scan time to ~ 5 min at a similar resolution [36]. Higher total acceleration factors were shown to be achievable for resting-state fMRI applications using both encoding directions 2D-CAIPIRINHA for a six-fold acceleration [37].
Figure 5.
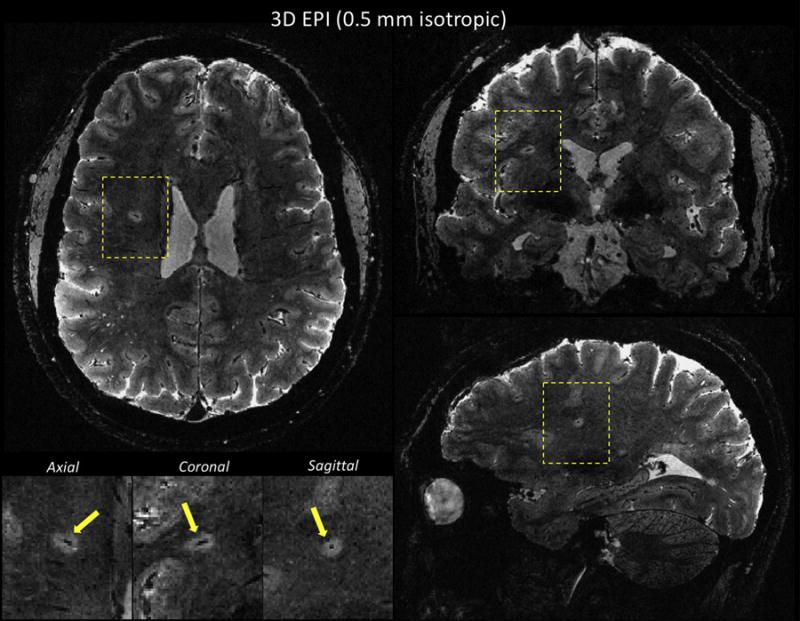
T2*w multi-shot EPI sequence performed on a MS patient at 7T using 0.5 mm isotropic voxels. Whole-brain coverage was achieved in less than 8 min. Multi-planar reconstruction allows visualization of a central vein within a deep white matter lesion (yellow arrows in magnified views). Main sequence parameters were: FA = 10, TE = 23 ms, TR = 52 ms, EPI factor = 15 (echo train length of ~ 26 ms). This multi-shot EPI acquisition provides a 15-fold acceleration compared to a GRE acquisition at similar resolution and TR.
Another promising strategy is the previously mentioned wave-CAIPI method, which was shown to acquire 1-mm isotropic whole-brain 3D-GRE images in 2.3 min with 6-fold acceleration [22]. Wave-CAIPI GRE is particularly interesting for T2* imaging because of its lower sensitivity to the undesirable image distortion and blurring related to B0 inhomogeneity compared to the 3D EPI technique. It is also an attractive solution because it can be integrated across multiple sequences (including 3D EPI).
All of these accelerated volumetric acquisitions are very sensitive to subject motion, which happens frequently in the clinical population. Motion occurring during image acquisition will significantly affect the quality of these heavily T2*-weighted and high-resolution sequences, and would probably require the systematic use of imaging navigators. Note that motion occurring during the reference scan will also lead to poorly unaliased images. The utilization of robust strategies for the reference data acquisitions, such as FLEET [38], could help mitigate this problem.
Cortical Lesions
Another set of consensus guidelines from the MAGNIMS has recently proposed integrating the detection of cortical lesions in the MRI criteria to increase their specificity [39]. This proposal is primarily based on studies showing that cortical lesions are rarely seen in healthy subjects or patients with other neurological conditions (e.g., migraine and neuromyelitis optica, another demyelinating disorder of the central nervous system), and increase the accuracy of MS diagnosis in patients with CIS. Cortical lesions were incorporated in the demonstration of DIS by the newly introduced 2017 revisions of the McDonald diagnostic criteria [40] .
Cortical lesions in MS can occur in three different patterns: leukocortical (type I), affecting both GM and subcortical WM; intracortical (type II), with a perivascular location inside the cortex; subpial (type III), abutting the CSF and extending to a variable degree though the cortical ribbon [41]. Although various MRI techniques have been shown to detect these lesions, studies comparing them with the gold-standard pathological techniques have also revealed their low sensitivity [42]. The low degree of myelination of the cerebral cortex, the small dimensions of the cortical ribbon and cortical lesions (particularly type II intracortical lesions), and partial volume averaging with nearby CSF, which can hide subpial lesions are probably the main causes for poor detection by MRI [43].
One way to overcome these issues is to improve imaging resolution and use MR contrasts highly sensitive to the myeloarchitecture of the cortex at 7 T, such as T2* [44] and T1 [45]. Studies conducted in vivo at 7 T using high-resolution (but very slow) 2D GRE acquisitions demonstrated that T2*-based imaging was able to detect the whole spectrum of cortical lesions [46, 47]. Therefore, there is a strong need for obtaining high-quality and high-isotropic-resolution (≤ 500 μm) T2* images with whole-brain coverage in a clinically compatible scan time. All the accelerated volumetric techniques previously described for the CVS application could be used for the cortical lesion detection.
Since T1 imaging is part of the mandatory brain MRI protocol for MS, this approach could also be used for detecting cortical lesions. When performed at high-isotropic-resolution (500 μm), MP2RAGE images were recently demonstrated to be extremely sensitive to small cortical lesions, and thus could be complementary to T2* images [48] (Figure 6). Applying the strategies previously mentioned for accelerating MP2RAGE while preserving SNR and CNR will be crucial in this application. Making MP2RAGE acquisition more robust to subject motion will be also important. Two solutions have already been proposed for this: the integration of fat-based motion-navigators for retrospective motion-correction [49] and the use of free-induction-decay navigators, which triggers the acquisition of image navigators for real-time motion correction [50].
Figure 6.
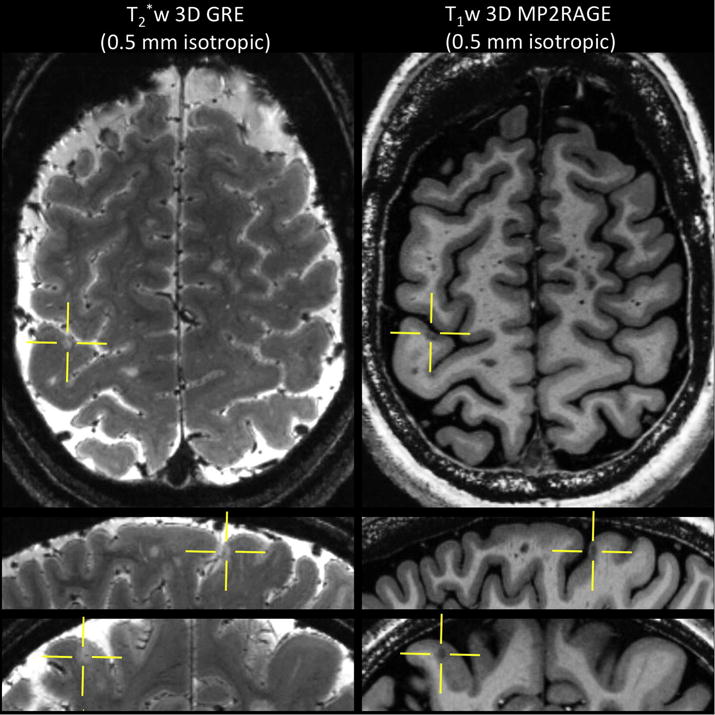
Left: T2*-weighted 3D gradient-echo acquired at 0.5 mm isotropic. Main sequence parameters: FA = 70 degrees, TE = 33 ms, TR = 4095 ms, R = 2 (SENSE), 60 axial slices, scan time = 13 min 28 sec. Right: T1-weighted 3D MP2RAGE acquired at 0.5 mm isotropic. Main sequence parameters: TI1 = 1000 ms, TI2 = 2700 ms, FA = 4, 5 degrees, TE = 3 ms, TR = 6000 ms, R = 3 (GRAPPA), scan time = 10 min 32 sec. A small (intra) cortical lesion is depicted on both contrasts (yellows crossbars) in this MS patient.
Primarily based on these two MRI findings (cortical lesions and central veins), 7 T MRI can play a key role in improving the accuracy diagnostic of MS. With the incorporation of cortical lesions into the recently presented new diagnostic criteria for MS, 7 T MRI will be immediately useful in cases where such lesions are not identified on clinical field-strength studies. On the other hand, the central vein sign remains under investigation for the moment and should not yet be used diagnostically.
Conclusions
By discussing the limitations and prospects of 7 T MRI techniques that are highly relevant to helping clinicians diagnose patients with MS, the goal of this article is to set realistic expectations for a clinical tool still in its infancy. Although 7 T scanners cannot yet replace the 3 T scanners in the hospital because of operation costs and throughput, it is my personal opinion that 7 T MRI will play an ever greater role in the diagnosis of patients with MS. 7 T MRI also has a strong potential for improving MS patient monitoring and providing more accurate or novel outcome measures for clinical trials (such as single-center Phase 2 trials). Some of the novel techniques mentioned in this article have the additional benefits of enabling novel contrasts (e.g. phase, QSM) and quantitative measures (T1 and T2* relaxation, regional and global brain volumetrics) at no extra cost in terms of acquisition time while potentially providing novel biomarkers for inflammation (phase rims in acute and chronic active lesions [51, 52] ) and neurodegeneration (T2* and magnetic susceptibility lesion signatures for iron accumulation and myelin loss [33] ). To meet these goals, the need for high image resolution and high scanning speed imposed by the diagnostic process and clinical population must be addressed with the support of manufacturers through a full integration of the innovative pulse sequences and image reconstruction strategies recently developed. Although not yet available clinically, the recent advances in parallel transmission technology (i.e. the use of multiple independent transmission channels) are also enabling promising solutions for spatially and temporally controlling the RF fields, and limiting SAR while improving B1+ field homogeneity [53]. Finally, as more academic medical centers and private hospitals are making the jump to ultra-high-field imaging, multi-center 7 T imaging studies will soon become feasible and open the door to a possible revolution in clinical decision making and clinical trial design.
Highlights.
With the recent FDA approval, 7 T MRI is finally entering the MS clinic
Full diagnostic brain protocol under 30 min is currently not possible at 7 T
The need for high image resolution and high scanning speed must be addressed
Innovative solutions for overcoming the current limitations exist
7 T will play a key role in improving the accuracy of MRI in diagnosis of MS
Acknowledgments
I am very grateful to Dr. Daniel S. Reich and Nicholas J. Luciano (Translational Neuroradiology Section, NINDS) for their thorough review and thoughtful comments on the manuscript. I also thank Dr. Jeff H. Duyn and his laboratory (Advanced MRI Section, NINDS), Drs Tobias Kober and Sunil Patil (Siemens Healthineers), as well as Dr. Peter Bandettini and all the staff of the Functional Magnetic Resonance Imaging Core Facility (FMRIF, NIMH), for their continued technical support. The Intramural Research Program of the National Institute of Neurological Disorders and Stroke is also acknowledged for financial support.
Footnotes
Publisher's Disclaimer: This is a PDF file of an unedited manuscript that has been accepted for publication. As a service to our customers we are providing this early version of the manuscript. The manuscript will undergo copyediting, typesetting, and review of the resulting proof before it is published in its final citable form. Please note that during the production process errors may be discovered which could affect the content, and all legal disclaimers that apply to the journal pertain.
References
- 1.Ge Y, Zohrabian VM, Grossman RI. Seven-Tesla magnetic resonance imaging: new vision of microvascular abnormalities in multiple sclerosis. Arch Neurol. 2008;65(6):812–6. doi: 10.1001/archneur.65.6.812. [DOI] [PMC free article] [PubMed] [Google Scholar]
- 2.Hammond KE, et al. Quantitative in vivo magnetic resonance imaging of multiple sclerosis at 7 Tesla with sensitivity to iron. Ann Neurol. 2008;64(6):707–13. doi: 10.1002/ana.21582. [DOI] [PubMed] [Google Scholar]
- 3.Tallantyre EC, et al. Demonstrating the perivascular distribution of MS lesions in vivo with 7-Tesla MRI. Neurology. 2008;70(22):2076–8. doi: 10.1212/01.wnl.0000313377.49555.2e. [DOI] [PubMed] [Google Scholar]
- 4.Absinta M, Sati P, Reich DS. Advanced MRI and staging of multiple sclerosis lesions. Nat Rev Neurol. 2016;12(6):358–68. doi: 10.1038/nrneurol.2016.59. [DOI] [PMC free article] [PubMed] [Google Scholar]
- 5.Barry RL, et al. Spinal cord MRI at 7T. Neuroimage. 2017 doi: 10.1016/j.neuroimage.2017.07.003. [DOI] [PMC free article] [PubMed] [Google Scholar]
- 6.Polman CH, et al. Diagnostic criteria for multiple sclerosis: 2010 revisions to the McDonald criteria. Ann Neurol. 2011;69(2):292–302. doi: 10.1002/ana.22366. [DOI] [PMC free article] [PubMed] [Google Scholar]
- 7.Freedman MS, et al. Moving toward earlier treatment of multiple sclerosis: Findings from a decade of clinical trials and implications for clinical practice. Mult Scler Relat Disord. 2014;3(2):147–55. doi: 10.1016/j.msard.2013.07.001. [DOI] [PubMed] [Google Scholar]
- 8.Rovira A, et al. Evidence-based guidelines: MAGNIMS consensus guidelines on the use of MRI in multiple sclerosis-clinical implementation in the diagnostic process. Nat Rev Neurol. 2015;11(8):471–82. doi: 10.1038/nrneurol.2015.106. [DOI] [PubMed] [Google Scholar]
- 9.Norris DG, et al. Application of PINS radiofrequency pulses to reduce power deposition in RARE/turbo spin echo imaging of the human head. Magn Reson Med. 2014;71(1):44–9. doi: 10.1002/mrm.24991. [DOI] [PubMed] [Google Scholar]
- 10.Mugler JP., 3rd Optimized three-dimensional fast-spin-echo MRI. J Magn Reson Imaging. 2014;39(4):745–67. doi: 10.1002/jmri.24542. [DOI] [PubMed] [Google Scholar]
- 11.Eggenschwiler F, et al. 3D T 2-weighted imaging at 7T using dynamic kT-points on single-transmit MRI systems. MAGMA. 2016;29(3):347–58. doi: 10.1007/s10334-016-0545-4. [DOI] [PubMed] [Google Scholar]
- 12.Saranathan M, et al. Optimization of magnetization-prepared 3-dimensional fluid attenuated inversion recovery imaging for lesion detection at 7 T. Invest Radiol. 2014;49(5):290–8. doi: 10.1097/RLI.0000000000000041. [DOI] [PMC free article] [PubMed] [Google Scholar]
- 13.Visser F, et al. High-resolution magnetization-prepared 3D-FLAIR imaging at 7.0 Tesla. Magn Reson Med. 2010;64(1):194–202. doi: 10.1002/mrm.22397. [DOI] [PubMed] [Google Scholar]
- 14.Traboulsee A, et al. Revised Recommendations of the Consortium of MS Centers Task Force for a Standardized MRI Protocol and Clinical Guidelines for the Diagnosis and Follow-Up of Multiple Sclerosis. AJNR Am J Neuroradiol. 2016;37(3):394–401. doi: 10.3174/ajnr.A4539. [DOI] [PMC free article] [PubMed] [Google Scholar]
- 15.Mugler JP, 3rd, Brookeman JR. Three-dimensional magnetization-prepared rapid gradient-echo imaging (3D MP RAGE) Magn Reson Med. 1990;15(1):152–7. doi: 10.1002/mrm.1910150117. [DOI] [PubMed] [Google Scholar]
- 16.Hurley AC, et al. Tailored RF pulse for magnetization inversion at ultrahigh field. Magn Reson Med. 2010;63(1):51–8. doi: 10.1002/mrm.22167. [DOI] [PubMed] [Google Scholar]
- 17.Van de Moortele PF, et al. T1 weighted brain images at 7 Tesla unbiased for Proton Density, T2* contrast and RF coil receive B1 sensitivity with simultaneous vessel visualization. Neuroimage. 2009;46(2):432–46. doi: 10.1016/j.neuroimage.2009.02.009. [DOI] [PMC free article] [PubMed] [Google Scholar]
- 18.Marques JP, et al. MP2RAGE, a self bias-field corrected sequence for improved segmentation and T1-mapping at high field. Neuroimage. 2010;49(2):1271–81. doi: 10.1016/j.neuroimage.2009.10.002. [DOI] [PubMed] [Google Scholar]
- 19.O’Brien KR, et al. Dielectric pads and low- B1+ adiabatic pulses: complementary techniques to optimize structural T1 w whole-brain MP2RAGE scans at 7 tesla. J Magn Reson Imaging. 2014;40(4):804–12. doi: 10.1002/jmri.24435. [DOI] [PubMed] [Google Scholar]
- 20.Brenner D, et al. Two-dimensional accelerated MP-RAGE imaging with flexible linear reordering. MAGMA. 2014;27(5):455–62. doi: 10.1007/s10334-014-0430-y. [DOI] [PubMed] [Google Scholar]
- 21.Shin W, et al. CNR improvement of MP2RAGE from slice encoding directional acceleration. Magn Reson Imaging. 2016;34(6):779–784. doi: 10.1016/j.mri.2016.03.014. [DOI] [PMC free article] [PubMed] [Google Scholar]
- 22.Bilgic B, et al. Wave-CAIPI for highly accelerated 3D imaging. Magn Reson Med. 2015;73(6):2152–62. doi: 10.1002/mrm.25347. [DOI] [PMC free article] [PubMed] [Google Scholar]
- 23.Polak D, et al. Wave-CAIPI for highly accelerated MP-RAGE imaging. Magn Reson Med. 2018;79(1):401–406. doi: 10.1002/mrm.26649. [DOI] [PMC free article] [PubMed] [Google Scholar]
- 24.Crombe A, et al. MS lesions are better detected with 3D T1 gradient-echo than with 2D T1 spin-echo gadolinium-enhanced imaging at 3T. AJNR Am J Neuroradiol. 2015;36(3):501–7. doi: 10.3174/ajnr.A4152. [DOI] [PMC free article] [PubMed] [Google Scholar]
- 25.Shen Y, et al. T1 relaxivities of gadolinium-based magnetic resonance contrast agents in human whole blood at 1.5, 3, and 7 T. Invest Radiol. 2015;50(5):330–8. doi: 10.1097/RLI.0000000000000132. [DOI] [PubMed] [Google Scholar]
- 26.Solomon AJ, et al. The contemporary spectrum of multiple sclerosis misdiagnosis: A multicenter study. Neurology. 2016;87(13):1393–9. doi: 10.1212/WNL.0000000000003152. [DOI] [PMC free article] [PubMed] [Google Scholar]
- 27.Sati P, et al. The central vein sign and its clinical evaluation for the diagnosis of multiple sclerosis: a consensus statement from the North American Imaging in Multiple Sclerosis Cooperative. Nat Rev Neurol. 2016;12(12):714–722. doi: 10.1038/nrneurol.2016.166. [DOI] [PubMed] [Google Scholar]
- 28.Hooshmand I, Rosenbaum AE, Stein RL. Radiographic anatomy of normal cerebral deep medullary veins: criteria for distinguishing them from their abnormal counterparts. Neuroradiology. 1974;7(2):75–84. doi: 10.1007/BF00341874. [DOI] [PubMed] [Google Scholar]
- 29.Duyn JH. Studying brain microstructure with magnetic susceptibility contrast at high-field. Neuroimage. 2017 doi: 10.1016/j.neuroimage.2017.02.046. [DOI] [PMC free article] [PubMed] [Google Scholar]
- 30.Tallantyre EC, et al. Ultra-high-field imaging distinguishes MS lesions from asymptomatic white matter lesions. Neurology. 2011;76(6):534–9. doi: 10.1212/WNL.0b013e31820b7630. [DOI] [PMC free article] [PubMed] [Google Scholar]
- 31.Sati P, et al. Rapid, high-resolution, whole-brain, susceptibility-based MRI of multiple sclerosis. Mult Scler. 2014;20(11):1464–70. doi: 10.1177/1352458514525868. [DOI] [PMC free article] [PubMed] [Google Scholar]
- 32.Liu S, et al. Susceptibility-weighted imaging: current status and future directions. NMR Biomed. 2017;30(4) doi: 10.1002/nbm.3552. [DOI] [PMC free article] [PubMed] [Google Scholar]
- 33.Li X, et al. Magnetic susceptibility contrast variations in multiple sclerosis lesions. J Magn Reson Imaging. 2016;43(2):463–73. doi: 10.1002/jmri.24976. [DOI] [PMC free article] [PubMed] [Google Scholar]
- 34.Poser BA, Setsompop K. Pulse sequences and parallel imaging for high spatiotemporal resolution MRI at ultra-high field. Neuroimage. 2017 doi: 10.1016/j.neuroimage.2017.04.006. [DOI] [PMC free article] [PubMed] [Google Scholar]
- 35.Poser BA, et al. Three dimensional echo-planar imaging at 7 Tesla. Neuroimage. 2010;51(1):261–6. doi: 10.1016/j.neuroimage.2010.01.108. [DOI] [PMC free article] [PubMed] [Google Scholar]
- 36.Zwanenburg JJ, et al. Fast high resolution whole brain T2* weighted imaging using echo planar imaging at 7T. Neuroimage. 2011;56(4):1902–7. doi: 10.1016/j.neuroimage.2011.03.046. [DOI] [PubMed] [Google Scholar]
- 37.Stirnberg R, et al. Rapid whole-brain resting-state fMRI at 3 T: Efficiency-optimized three-dimensional EPI versus repetition time-matched simultaneous-multi-slice EPI. Neuroimage. 2017;163:81–92. doi: 10.1016/j.neuroimage.2017.08.031. [DOI] [PubMed] [Google Scholar]
- 38.Polimeni JR, et al. Reducing sensitivity losses due to respiration and motion in accelerated echo planar imaging by reordering the autocalibration data acquisition. Magn Reson Med. 2016;75(2):665–79. doi: 10.1002/mrm.25628. [DOI] [PMC free article] [PubMed] [Google Scholar]
- 39.Filippi M, et al. MRI criteria for the diagnosis of multiple sclerosis: MAGNIMS consensus guidelines. Lancet Neurol. 2016;15(3):292–303. doi: 10.1016/S1474-4422(15)00393-2. [DOI] [PMC free article] [PubMed] [Google Scholar]
- 40.Thompson AJ, et al. Diagnosis of multiple sclerosis: 2017 revisions of the McDonald criteria. Lancet Neurol. 2017 doi: 10.1016/S1474-4422(17)30470-2. [DOI] [PubMed] [Google Scholar]
- 41.Peterson JW, et al. Transected neurites, apoptotic neurons, and reduced inflammation in cortical multiple sclerosis lesions. Ann Neurol. 2001;50(3):389–400. doi: 10.1002/ana.1123. [DOI] [PubMed] [Google Scholar]
- 42.Kilsdonk ID, et al. Increased cortical grey matter lesion detection in multiple sclerosis with 7 T MRI: a post-mortem verification study. Brain. 2016;139(Pt 5):1472–81. doi: 10.1093/brain/aww037. [DOI] [PubMed] [Google Scholar]
- 43.Kidd D, et al. Cortical lesions in multiple sclerosis. Brain. 1999;122(Pt 1):17–26. doi: 10.1093/brain/122.1.17. [DOI] [PubMed] [Google Scholar]
- 44.Cohen-Adad J, et al. T(2)* mapping and B(0) orientation-dependence at 7 T reveal cyto- and myeloarchitecture organization of the human cortex. Neuroimage. 2012;60(2):1006–14. doi: 10.1016/j.neuroimage.2012.01.053. [DOI] [PMC free article] [PubMed] [Google Scholar]
- 45.Bock NA, et al. Visualizing the entire cortical myelination pattern in marmosets with magnetic resonance imaging. J Neurosci Methods. 2009;185(1):15–22. doi: 10.1016/j.jneumeth.2009.08.022. [DOI] [PMC free article] [PubMed] [Google Scholar]
- 46.Cohen-Adad J, et al. In vivo evidence of disseminated subpial T2* signal changes in multiple sclerosis at 7 T: a surface-based analysis. Neuroimage. 2011;57(1):55–62. doi: 10.1016/j.neuroimage.2011.04.009. [DOI] [PMC free article] [PubMed] [Google Scholar]
- 47.Mainero C, et al. In vivo imaging of cortical pathology in multiple sclerosis using ultra-high field MRI. Neurology. 2009;73(12):941–8. doi: 10.1212/WNL.0b013e3181b64bf7. [DOI] [PMC free article] [PubMed] [Google Scholar]
- 48.Beck ES, et al. Improved visualization of cortical lesions in multiple sclerosis using MP2RAGE at 7T. AJNR Am J Neuroradiol. doi: 10.3174/ajnr.A5534. in press. [DOI] [PMC free article] [PubMed] [Google Scholar]
- 49.Federau C, Gallichan D. Motion-Correction Enabled Ultra-High Resolution In-Vivo 7T-MRI of the Brain. PLoS One. 2016;11(5):e0154974. doi: 10.1371/journal.pone.0154974. [DOI] [PMC free article] [PubMed] [Google Scholar]
- 50.Waszak M, et al. Prospective head motion correction using FID-guided on-demand image navigators. Magn Reson Med. 2017;78(1):193–203. doi: 10.1002/mrm.26364. [DOI] [PubMed] [Google Scholar]
- 51.Absinta M, et al. Seven-tesla phase imaging of acute multiple sclerosis lesions: a new window into the inflammatory process. Ann Neurol. 2013;74(5):669–78. doi: 10.1002/ana.23959. [DOI] [PMC free article] [PubMed] [Google Scholar]
- 52.Calabresi PA, van Zijl PC. Ultra-high-field (7.0 Tesla and above) MRI is now necessary to make the next step forward in understanding MS pathophysiology - Commentary. Mult Scler. 2017;23(3):376–377. doi: 10.1177/1352458516684560. [DOI] [PMC free article] [PubMed] [Google Scholar]
- 53.Padormo F, et al. Parallel transmission for ultrahigh-field imaging. NMR Biomed. 2016;29(9):1145–61. doi: 10.1002/nbm.3313. [DOI] [PMC free article] [PubMed] [Google Scholar]


