Abstract
Several studies have established that facial expressions of children with autism are often perceived as atypical, awkward or less engaging by typical adult observers. Despite this clear deficit in the quality of facial expression production, very little is understood about its underlying mechanisms and characteristics. This paper takes a computational approach to studying details of facial expressions of children with high functioning autism (HFA). The objective is to uncover those characteristics of facial expressions, notably distinct from those in typically developing children, and which are otherwise difficult to detect by visual inspection. We use motion capture data obtained from subjects with HFA and typically developing subjects while they produced various facial expressions. This data is analyzed to investigate how the overall and local facial dynamics of children with HFA differ from their typically developing peers. Our major observations include reduced complexity in the dynamic facial behavior of the HFA group arising primarily from the eye region.
Keywords: Autism, perception, awkwardness, facial expressions, facial dynamics
1 Introduction
Children with Autism spectrum disorder (ASD) have significantly impaired social communication abilities, even those who have preserved language and cognitive skills and are commonly referred to as having high functioning autism (HFA). These social impairments are characterized by difficulties in using non-verbal cues [1], including difficulties in perceiving and producing facial expressions [2], [3]. It has been noted that individuals with HFA have difficulties processing dynamic facial information related to emotional state (a key component in social interaction) as compared to static stimuli [4]. They also display ambiguous expressions and more neutral/flat affect expressions compared to their TD counterparts [5]. Several studies have established that facial expressions of children with HFA are often perceived as atypical, awkward or less engaging by typical adult observers [5], [6], [7]. In fact, their expressions are perceived as awkward after just one second of interaction [7]. Even naïve observers, without any knowledge of the subjects' diagnosis, perceive children with HFA to be more awkward compared to their typically developing (TD) peers [7]. Despite this clear deficit in the quality of facial expression production, very little is understood about the underlying mechanisms and characteristics of facial expressions.
Atypicality in facial expressions of children with Autism has been studied through observations by humans [6], [7]. However, subtle movements causing differences in the facial dynamics between the HFA and the TD groups may not be easy to capture by visual inspection alone, which underscores the need for objective data analysis methods. The usefulness of computational behavior analysis has been noted in several recent studies, such as in analyzing atypicality in prosody [8], [9], [10], and in asynchronization of speech and gestures of children with autism [11]. Following this line of computational research to better understand behavioral phenotyping in autism, the work in this paper aims at quantifying atypicality of facial expressions in children with HFA, which is otherwise difficult to achieve by plain visual inspection. Our approach relies on direct measurement of facial movements during specific expressions, followed by analyses of those movement patterns.
To objectively understand facial expression-related atypicality in autism, we use direct motion capture (mocap) technique to record subtle facial movements in both children with HFA and TD subjects as they produced specific expressions. Mocap is a powerful technique to obtain detailed, precise description of gesture dynamics. It is widely used for supporting multimodal modeling in a variety of application domains including animation, human-machine interaction and sports [12], [13]. In this work on expressive facial movements, we use a mimicry paradigm to control task performance and variability, where subjects mimic a fixed set of facial expressions performed by actors in stimuli videos [14]. Movements of markers affixed to the face are recorded while the subjects mimicked facial expressions, and subsequently used for computationally examining the movement dynamics of the resulting facial expressions. The usefulness of computational approaches for analyzing such data was established in our previous work [15], [16], [17]. Our preliminary analysis indicated that facial dynamics of children with HFA differ from those of TD children in various objective ways, such as in exhibiting rougher head motion, higher variability within the HFA group, and lower bilateral symmetry [15], [16].
Our present study of facial expression production mechanisms in autism involves understanding the overall dynamics of the entire face, localized dynamics in specific facial regions, as well as the dynamical relationships between the movements across different facial regions.
The notion of complexity is fundamental to any dynamical system - mechanical or physiological, and can be understood as the rate at which new information is generated by the system. There is significant evidence of various physiological (dynamical) systems being associated with atypical and often reduced measures of complexity [18], [19], although the interpretation of complexity varies with the physiological parameters being studied and the developmental condition being investigated. Motivated by these past observations, we study the facial expression production system (a physiological dynamical system) in terms of its dynamic complexity. First, we consider the hypothesis whether expressive facial movement patterns in HFA represent a system of reduced complexity compared to the TD peers. Reduced complexity in the context of facial dynamics may be interpreted as partial loss of subtle movements, repetitive patterns in the dynamics, and highly correlated movements between facial regions. We investigate whether the TD group and the HFA group have similar or differing patterns of complexity in their overall facial dynamics using the multiple scale entropy (MSE) method, which provides a measure of system complexity [20]. Next, we hypothesize that subjects with HFA will exhibit lower complexity than the TD group for some, if not all, emotion conditions. To understand the dynamics of specific facial surface regions, we divide the face into smaller regions (eye, cheek, and mouth) following [21]. MSE-based complexity analysis is performed on each specified region separately. Through this analysis, we expect to identify those particular regions of the face that contribute to differences across HFA and control groups.
In case of reduced complexity in facial dynamics, one would expect higher predictability between facial regions i.e. the movement pattern of one region could be predicted well using the information from another. To understand such dynamical relationship between facial regions, i.e., covariation in their movement patterns, we adopt a predictive modeling approach. Using the Granger causality model [22], we attempt to predict the dynamics of one facial region using the information from the other. In cases where behavior of one region can be predicted significantly well by another region, a causal dependency is established. We study the pairwise causal dependency between facial regions for the various facial expression conditions. Our hypothesis is that in case of reduced complexity in overall dynamics, there will be a stronger presence of causal dependency between facial regions.
The rest of the article is organized as follows: Section 2 provides details on the data collection process, Section 3 describes the computational methodologies we have used to analyze facial dynamics along with observations, followed by a discussion in Section 4 and conclusion in Section 5.
2 Database
In this computational study, mocap technique is used to record facial movements of HFA and TD subjects as they produce various expressions related to emotion. To reduce task-specific variability, we adopt a mimicry paradigm, where subjects mimic a fixed set of facial expressions performed by actors in stimuli videos.
2.1 Participants
Twenty participants (2 females and 18 males) with HFA and nineteen (1 female and 18 males) TD subjects, all aged between nine and fourteen years, were recruited for this experiment at the FACE Lab at Emerson College. Diagnosis of ASD was confirmed via the Autism Diagnostic Observation Schedule, Module 3 [1] by trained administrators and confirmed by clinical impression. All participants in the ASD group demonstrated language and cognitive skills within normal limits, allowing us to describe them as having HFA. We administered the Childhood Autism Rating Scale [23] to all participants and excluded participants who scored above the threshold indicating concern for ASD from the TD cohort. Participants with learning differences (e.g. dyslexia), known genetic disorders, or other relevant diagnoses (e.g. attention deficit hyperactivity disorder) were excluded from both groups to reduce heterogeneity of the cohort. The mean ages of HFA participants (12.90 ± 3.19) and TD participants (12.67 ± 2.34) were not significantly different (t(37) = 0.25, p = 0.80). We assessed the subjects' IQ using the Leiter International Performance Scale [24] and receptive vocabulary with the Peabody Picture Vocabulary Test [25]. The mean IQ of HFA participants (106.35 ± 15.38) and control participants (108.74 ± 11.93) were also not significantly different (t(37) = 0.53, p = 0.59). Parents of all participants gave informed written consent and participants over the age of twelve provided written consent for participation in the experiment. This study was approved by the Institutional Review Board of University of Massachusetts Medical School.
2.2 Data Acquisition and Preparation
Thirty two reflective markers were affixed to the face of each participant (see Fig. 1 for marker positions). The movement of these markers was recorded by six infrared motion-capture cameras at 100 frames per second. The participants were instructed to mimic expressions in video stimuli selected from the Mind Reading corpus [14]. A study staff member was present in the room throughout the duration of the study to answer questions and repeat instructions if necessary.
Fig. 1.
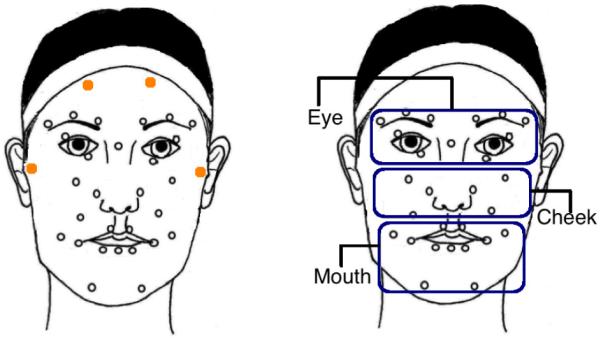
Positions of the 32 facial motion capture markers affixed to each participant's face (left), Division of the 28 markers (excluding the stability markers) into eye, cheek and mouth regions (right)
The stimuli included two predefined, very similar sets of expressions with 18 tasks (smiling, frowning, being tearful, etc.) in each set. Each participant mimicked only one set of expressions. For ease of interpretability, these expressions are grouped into the six basic emotion categories that they are associated with - anger, fear, disgust, joy, sadness and surprise. The emotion labels for the tasks are provided in the Mind Reading corpus, and have been validated in prior research [26], [27]. Since these are not spontaneous emotions, we will refer to these categories as facial expression condition in this paper.
The specific arrangement of markers was based on a ninety marker, high-resolution face template [28] developed through the analysis of basic facial movement patterns using concepts of the Facial Action Coding System (FACS) [29]. We reduced the set to the 32 most critical markers delineating all central facial features, as well as overall head movement, and maintained a minimum of 4mm separation between markers to maximize recording resolution. Out of the 32 facial markers, 4 stability markers (the solid orange markers on the forehead and near the ears as shown in Fig. 1) are used to measure and later correct head motion. The positions of the remaining 28 markers are recomputed with respect to these stability markers to remove head motion. The resulting motion data are aligned, centered, and inspected manually to remove and correct artifacts. Face normalization is performed to remove subject-specific structural variability that may exist due to different facial structures and shapes of the subjects. The processed mocap data thus accounts for pure expression-related motion, and is free from head motion and subject-specific structural variability. For more details on the preprocessing methods, refer to our previous work [16].
Each such preprocessed mocap time series, consisting of horizontal and vertical coordinates of a marker, is next converted to a distance time series , where di is the distance of the marker from its rest position at the ith time instant. We use this distance time series data for further computational analyses.
3 Data Analysis and Interpretation
Our study of facial expression patterns in autism involves understanding the overall dynamics of the markers of the entire face, localized dynamics in specific facial regions, as well as the covariation of dynamics between facial regions.
3.1 Overall Facial Dynamics
In this section, we investigate whether the TD group and the HFA group have similar or differing patterns of complexity in their overall facial dynamics using the multiple scale entropy (MSE) method [20], [30]. Although the interpretation of complexity varies with the physiological parameters being studied and the developmental condition being investigated, there is significant evidence for various pathological processes being associated with atypical and often reduced measures of physiological complexity [18], [19]. We hypothesize that subjects with HFA will exhibit lower complexity than the TD group for some, if not all, facial expression conditions.
The complexity of a dynamical system can be understood as the rate at which new information is produced. MSE is a measure of dynamic complexity which is often useful in the context of physiological time series. This method estimates the complexity of a time series by computing an information theoretic quantity, called the sample entropy, at multiple time scales. The sample entropy Se at a given scale is computed as the negative logarithm of the conditional probability of two sequences within the time series being similar (in the sense of a distance metric) in an (m + 1)-dimensional space, given that they are similar in the m-dimensional space.
Consider a time series X = {x1, x2, …, xN} from which we may form an m-dimensional vector . Let the distance between any such two vectors be denoted as , where i ≠ j enforces no self-matching. The function d(·) in our work is the Chebyshev distance, although any distance function is applicable. Let Cm(r) be the number of vector pairs for which where r is a predefined threshold. Similarly, Cm+1(r) denotes the number of cases where . The sample entropy is computed as:
| (1) |
For a time scale factor τ, the original time series X is first coarse-grained to obtain Yτ = {y1, y2, …, yN/τ} where . For multiscale analysis, Se is computed for multiple values of τ. In this study, we have used m = 2, and r = 0.2× standard deviation of the time series. These parameter values are chosen based on previous studies that show that sample entropy has good statistical validity for these values [31].
To perform MSE analysis on our database, we use the distance time series data containing the distances of each facial marker from its rest position (see section 2.2). For each subject performing a mimicry task, we thus have a multichannel time-series, , where q is the subject id, N is the length of the time series, and M = 28 facial markers. The sample entropy of is computed for each of the 28 channels at τ = 1, 2, .., 25. An overall measure of complexity is obtained by adding the Se values across all channels for each at each scale. If a subject performs multiple tasks under the same expression condition, the MSE values are averaged across tasks at each scale.
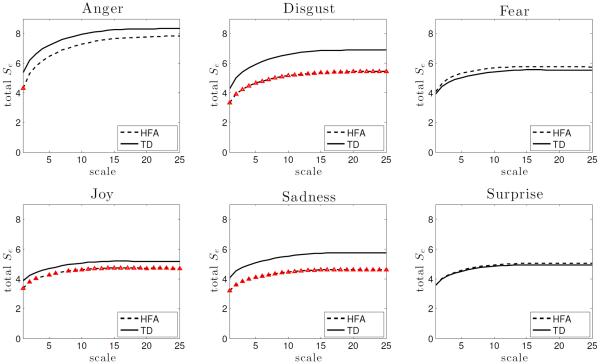
The overall complexity of each subject was computed in terms of the sample entropy values at 25 scale factors. To identify group difference, a two-sample t-test was performed at each scale for every expression condition at 5% significance level. In general, a system is considered more complex than the other if it produces higher values of sample entropy relative to the other consistently over increasing values of scale factor. As predicted, the results of MSE analysis shows that the HFA group has significantly reduced sample entropy patterns for three expression conditions: disgust (all 25 scales), joy (all except scales 4 and 7) and sadness (all 25 scales). Plots of group differences are presented in Fig. 2 where red markers indicate the scales at which the group difference is significant i.e. p ≤ 0.05. For anger, significant group difference was observed only at τ = 1 which is not sufficient to infer group difference in complexity pattern. No difference is observed for fear or surprise.
Fig. 2.
Group differences in overall complexity. The red markers on the HFA plot indicate the scale factors at which HFA group has significantly lower complexity compared to the control group (error bars are omitted for clarity).
3.2 Localized Facial Dynamics
It is possible that group differences in overall facial dynamics, when they exist, arise from only certain parts of the face while other facial regions exhibit normal behavior. A well established approach to studying local facial movements involves using the FACS [29], [32]. The FACS is designed to encode movement of individual facial muscles (called action units) from slight changes in facial appearance. Examples of action units are inner brow raise and lip corner pull. The facial action units thus can be considered as the low-level building block of facial expressions.
In this work, however, we do not follow the action units-based approach. Studies have reported important behavioral traits of children with autism related to facial regions - the eye avoidance hypothesis in autism [33], [34], [35] for example. Hence, we intend to analyze facial movements at the level of facial regions. We group the markers into three facial regions, eye, cheek and mouth, pertaining to the core feature areas [36] (see Fig. 1). This kind of partition has also been adopted in [21].
3.2.1 Complexity analysis
To compute the local complexity of a region, we average the MSE values across all the markers present in that region, separately at each scale factor. Two regions are considered different if their complexity is significantly different (p ≤ 0.05) for a majority of the scale factors.
To investigate the group differences in local regions of a face, a two sample t-test was performed on the MSE results for each of the three regions (see Fig. 3). For anger and fear, no facial region was found to be significantly different between the groups. For disgust (eye: p = 0.008, cheek: p = 1.77e − 5, mouth: p = 0.003) and sadness (eye: p = 7.34e − 4, cheek: p = 0.025, mouth: p = 6.61e − 4), reduced complexity is observed for the HFA group in all three regions. For joy, the group difference comes from eye (p = 0.014) and mouth (p = 0.022) regions. Although, the overall complexity pattern of the HFA group does not differ from that of the control group for surprise, the mouth region (p = 0.009) still shows significantly reduced complexity. Overall, the eye region shows the highest between-group difference in complexity, followed by mouth and cheek regions (see Fig. 4).
Fig. 3.
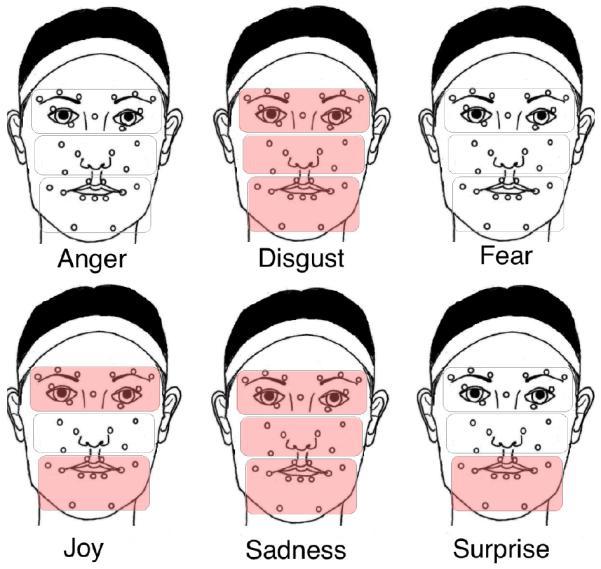
Group difference in complexity for facial regions. Shaded regions indicate where the HFA group exhibit significantly lower complexity (p ≤ 0.05) than the control group.
Fig. 4.
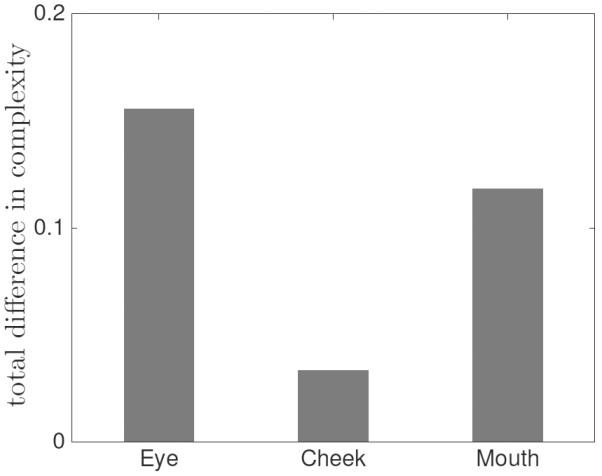
Group difference in complexity for facial regions for all expression conditions
In addition, we report the region of maximum complexity pertaining to each expression condition for the two groups (see Table 1). We observe that apart from fear, the regions of highest complexity between the two groups are always different. While the control group produces the most complex motion in the eye region in cases of anger, joy, sadness and surprise, the highest complexity in the HFA group is observed in the cheek region for these emotion-related expressions.
TABLE 1.
Region of highest complexity
| HFA | TD | |
|---|---|---|
|
| ||
| Anger | cheek | eye |
| Disgust | mouth | cheek |
| Fear | cheek | cheek |
| Joy | cheek | eye |
| Sadness | cheek | eye |
| Surprise | cheek | eye |
3.2.2 Similarity analysis
In this section, we investigate the (dis)similarity between the HFA and control groups in terms of their facial expression dynamics in the three facial region. To measure the group difference, we employ the dynamical time warping (DTW) method. DTW measures the similarity (or dissimilarity) between two temporal sequences by finding the best alignment between them in terms of a warping distance. It directly compares the dynamical patterns in the sequences without making any statistical assumptions. DTW has wide applications in diverse domains, such as speech recognition [37] and emotion classification [38].
Given two multidimensional time series X ∈ Rd×Nx, Y ∈ Rd×Ny, where d is the data dimensionality and Nx and Ny are the lengths of X and Y. DTW finds the best warping path by optimizing the distance between X and Y. We construct a distance matrix , where the element di,j measures the distance between the ith point xi in X and the j-th point yj in Y. In this work, we use ℓ2-norm to measure the pointwise distance: di,j = ∥xi − xj∥2. A warping path W = w1,w2, ⋯,wK defines a mapping between X and Y, where the k-th element of W is defined as wk = (i, j), where wk(1) = i and wk(2) = j. X can be warped to the same length of Y based on the warping path, i.e., the ith point of X corresponds to the jth point of Y. The optimal warping path is the one that minimizes the warping distance dw(W):
| (2) |
This path can be found using dynamic programming with space and time complexity of .
We apply DTW to measure the similarity between every pair of HFA and TD subjects using the corresponding facial region-based time series data, and compute the warping distance dw(W). Fig. 5 presents the average HFA-TD similarity of facial dynamics in each region, where brighter color indicates larger warping distance, i.e., lower similarity between the groups. Consistent with our previous observation, the eye region shows a significantly larger dissimilarity than the cheek region across expression conditions (p < 0.01), and than the mouth region in the expression of anger, fear, joy and surprise. In addition, the cheek region exhibits the smallest dynamic difference (p < 0.01). The eye region-based HFA-TD difference in the expressions of joy and fear is significantly larger compared to those in other expression conditions (p < 0.01).
Fig. 5.
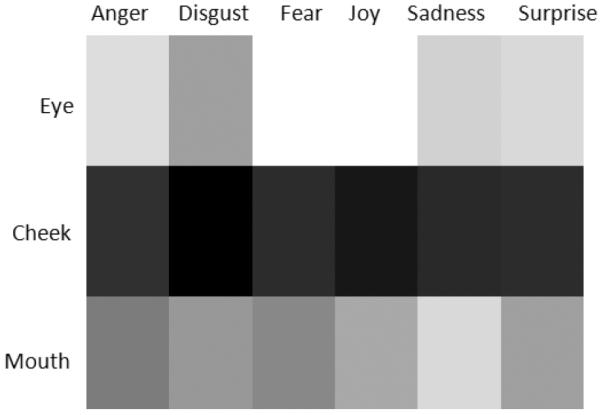
Average dissimilarity in facial region dynamics between HFA and TD. Brighter color indicates larger dissimilarity.
3.3 Relationship in Movement Patterns between Facial Regions
Facial expressions are produced as the results of a complex interplay and coordination between various facial regions. Such dynamic relationships may be highly non-linear, and difficult to discern with simple measures like correlation or coherence. In addition to studying the existence of the cross-region relationship, we are interested in the interaction (directional) effects between movement patterns in different regions. To study the complex dynamic relationship between facial regions, we use the Granger causality model [22].
Granger causality is a popular statistical measure for analyzing the directional influence of one time series on another [22]. It has been widely applied to analyze various physiological and biomedical signals [39] [40] [41]. Compared to other metrics, such as correlation which is linear and symmetric, Granger causality measures a non-linear and directional relationship between variables and is more suitable for the lag-lead system.
Given two time series X and Y, the Granger causality measure defines the influence of the past information of X on improving the prediction of the current value of Y. Let's consider the following two linear regression models:
| (3) |
where P is the maximum number of lags for X and Y in the models; , and are the regression coefficients, and ∊Y and ∊XY are the residuals of the regression models. The Granger causality measure is then defined by taking the natural logarithm of the ratio of the total variance of the two residuals ∊Y and ∊X:
| (4) |
If is significantly greater than zero, then X is Granger causing Y. This significance is examined using an F-test.
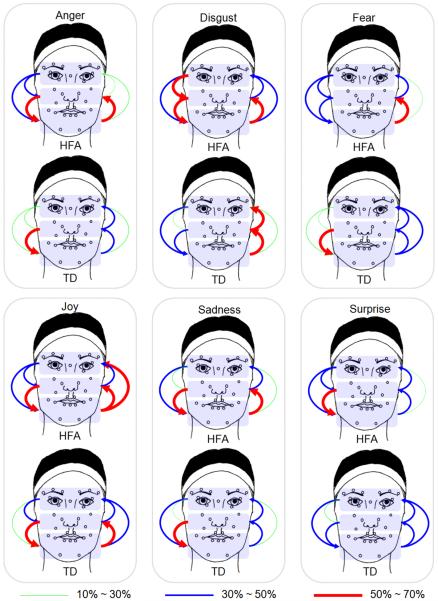
For Granger causality analysis, we first determine the model order P using the Akaike information criterion (AIC). Analysis shows that 35% of the subjects attain a model order of 3, and hence we use P = 3 throughout our analysis. Causal dependency is examined for all possible ordered pairs of facial regions. This requires testing 6 unique ordered pairs for causality. Fig. 6 presents the Granger causality patterns between facial regions for the HFA and TD groups. The arrows indicate the direction of causal dependency originating from the region that predicts pointing to the predicted region. The thickness and the color of the arrows correspond to the percentage of subjects showing statistically significant (p ≤ 0.05) causality between the relevant region pairs. Since the resulting percentage of subjects showing significant causality over all the pairs of facial regions ranges from 10% to 70%, we equally divide the interval [10%, 70%] into three groups to represent different strength levels between regions: low-level [10%, 30%], medium-level [30%, 50%] and high-level [50%, 70%]. As expected, we observe that subjects with HFA exhibit stronger causal dependency between regions compared to their TD peers. The dependency is particularly pronounced for the expression conditions of anger, disgust, joy and sadness.
Fig. 6.
Granger causality pattern between facial regions in the HFA and TD groups. The thickness and color of the arrows represent the percentage of subjects showing statistically significant causality (p ≤ 0.05) for the corresponding region pairs.
We also observe that the causal relationship between adjacent regions is stronger than that between non-adjacent ones for both groups. For example, the coupling between cheek and mouth regions is stronger than that between eye and mouth. A strong eye-to-mouth relationship for HFA subjects is also observed for the expressions of joy.
4 Discussion
The present study found reduced complexity in facial expression dynamics of subjects with HFA relative to their TD peers. Significant difference is observed for expressions related to disgust, joy and sadness. These movement differences may be the reason naïve observers perceive the facial expressions of individuals with ASD as awkward. In the context of facial expression, reduced complexity can be understood as a lack of variability, subtlety, or richness in overall facial dynamics. Our observation supports a previous study that noted more neutral/flat affect expressions in HFA group compared to their TD counterparts [5]. Our findings of reduced complexity are also consistent with past research showing atypical, often reduced, complexity measures of physiological dynamic systems in people with developmental or other conditions [18], [19].
We have also identified the facial regions with atypical complexity in HFA subjects for each expression condition. For expressions related to emotions like disgust and sadness the reduced complexity in HFA subjects is observed across all facial regions, while for other emotions (joy and surprise) only parts of the face exhibit atypical dynamics.
On the other hand, from both local complexity and DTW-based similarity analysis, we find that the major group difference in facial dynamics comes from the eye region. Recall that the eye region exhibits the highest complexity in the TD group (see Table 1), but the HFA group shows reduced complexity in this region. The observed dynamic dissimilarity may result from this difference in complexity.
As shown in Table 1, HFA subjects exhibit highest complexity in the cheek region, which also explains the smallest dynamic difference observed in Fig. 5. These observations indicate that the cheek movements of participants with HFA are more natural and also reinforce that the perceived atypicality and awkwardness likely result from reduced complexity of movements in the eye, rather than the cheek region. One possible explanation for this behavior may come from the eye avoidance hypothesis in autism where children with autism avoid looking at the eye region of the face [33], [34], and may not be able to produce the intricate movements in the eye region, because they lack experience perceiving and processing this complex dynamic information.
The Granger causality analysis shows that HFA subjects, in general, have stronger causal dependency between facial regions compared to TD subjects. Group difference is especially prominent in the emotions of anger, disgust, joy and sadness. Recall that the HFA subjects have reduced complexity for these emotions. The strong dependency between facial regions in the HFA group suggests that subjects with HFA have smaller degrees of freedom in the underlying production mechanism, which in turn, supports our observation of reduced complexity in overall facial movements.
5 Conclusion
Several autism research studies have emphasized the importance of understanding vocal [9], [11] and facial behavioral expressions [7], since they have such significant impact on how children with HFA are perceived by naïve observers. In this study, we analyzed mimicked facial expressions in children with HFA using computational techniques. We observe that facial expressions of children with HFA have reduced complexity when compared to those of TD subjects. This is further emphasized by the observation of higher causal dependency between various facial regions in HFA across various expression conditions, suggesting lower degrees of freedom in the underlying mechanism. The group differences in expression dynamics are more prominent for expressions of anger, disgust, joy and sadness, and mainly arise from the eye region.
Since our observations are made based on analyzing the mocap recordings of only 20 children with autism, we cannot generalize the findings to the entire autism spectrum population, particularly due to the inherent heterogeneity in the condition. Our current experimental setup also can not identify whether the observed differences between the HFA and TD subjects resulted from an underlying group difference in perceiving the visual stimuli vs. a pure production difference. Our findings also do not speak to the spontaneous production of expressions during naturalistic social interactions - since the expressions we analyzed are based on a mimicry paradigm. Nevertheless, within the scope of this study, our analyses suggest that children with HFA lack richness and variability in their facial expression patterns, indicating a production mechanism that allows less degrees of freedom of movement between regions.
Acknowledgments
This work is supported by National Science Foundation (NSF) and National Institutes of Health (NIH). The authors would also like to thank the anonymous reviewers whose insightful comments and suggestions have enriched this article.
Biographies

Tanaya Guha is an Assistant Professor in the department of Electrical Engineering at the Indian Institute of Technology (IIT) Kanpur. Prior to joining IIT, she was a postdoctoral fellow at the Signal Analysis and Interpretation Lab (SAIL), University of Southern California (USC) from 2013 to 2015. She has received her PhD in Electrical and Computer Engineering from the University of British Columbia (UBC), Vancouver in 2013. She was a recipient of Mensa Canada Woodhams memorial scholarship, Google Anita Borg memorial (finalist) scholarship and Amazon Grace Hopper celebration scholarship. Her current research interests include human-centered signal processing including human emotion and behavior analysis, and multimodal signal processing.

Zhaojun Yang is a PhD candidate in Electrical Engineering at the University of Southern California (USC). She received her B.E. Degree in Electrical Engineering from University of Science and Technology of China (USTC) 2009 and M.Phil. Degree in Systems Engineering and Engineering Management from Chinese University of Hong Kong (CUHK) 2011. Her research interests include multimodal emotion recognition and analysis, interaction modeling and spoken dialog system. She was awarded with the USC Annenberg Fellowship (2011–2015). Her work (with S. S. Narayanan) has won the Best Student Paper Award at ICASSP 2016.

Ruth B Grossman is an associate professor at Emerson College where she teaches graduate and undergraduate classes in the department of Communication Sciences and Disorders. Her research is focused on various aspects of face-to-face communication in children with Autism Spectrum Disorders (ASD). She is specifically interested in how children with ASD integrate and produce verbal and nonverbal information, such as facial expressions and prosody. Her work has been published in several refereed journals, including Journal of Child Psychology and Psychiatry, Journal of Speech, Language, and Hearing Research, Journal of Nonverbal Behavior, Autism, and Autism Research. More about her her can be found in facelab.emerson.edu.

Shrikanth (Shri) Narayanan (StM'88 - M'95 - SM'02 - F'09) is Andrew J. Viterbi Professor of Engineering at the University of Southern California (USC), and holds appointments as Professor of Electrical Engineering, Computer Science, Linguistics, Psychology, Neuroscience and Pediatrics and as the founding director of the Ming Hsieh Institute. Prior to USC he was with AT&T Bell Labs and AT&T Research from 1995–2000. At USC he directs the Signal Analysis and Interpretation Laboratory (SAIL). His research focuses on human-centered signal and information processing and systems modeling with an interdisciplinary emphasis on speech, audio, language, multimodal and biomedical problems and applications with direct societal relevance. [http://sail.usc.edu].
Prof. Narayanan is a Fellow of the Acoustical Society of America and the American Association for the Advancement of Science (AAAS) and a member of Tau Beta Pi, Phi Kappa Phi, and Eta Kappa Nu. He is the Editor in Chief for IEEE Journal of Selected Topics in Signal Processing, an Editor for the Computer Speech and Language Journal and an Associate Editor for the IEEE Transactions on Affective Computing, APSIPA Transactions on Signal and Information Processing and the Journal of the Acoustical Society of America. He was also previously an Associate Editor of the IEEE Transactions of Speech and Audio Processing (20002004), IEEE Signal Processing Magazine (20052008), IEEE Transactions on Multimedia (2008–2011) and the IEEE Transactions on Signal and Information Processing over Networks (2014–2015). He is a recipient of a number of honors including Best Transactions Paper awards from the IEEE Signal Processing Society in 2005 (with A. Potamianos) and in 2009 (with C. M. Lee) and selection as an IEEE Signal Processing Society Distinguished Lecturer for 20102011 and ISCA Distinguished Lecturer for 2015–2016. Papers co-authored with his students have won awards including the 2014 Ten-year Technical Impact Award from ACM ICMI and at Interspeech, 2016 ICASSP, 2015 Nativeness Detection Challenge, 2014 Cognitive Load Challenge, 2013 Social Signal Challenge, Interspeech 2012 Speaker Trait Challenge, Interspeech 2011 Speaker State Challenge, InterSpeech 2013 and 2010, InterSpeech 2009-Emotion Challenge, IEEE DCOSS 2009, IEEE MMSP 2007, IEEE MMSP 2006, ICASSP 2005 and ICSLP 2002. He has published over 700 papers and has been granted seventeen U.S. patents.
References
- [1].Lord C, Rutter M, DiLavore PC, Risi S, Gotham K, Bishop SL. Autism diagnostic observation schedule: ADOS-2. Western Psychological Services Los Angeles; CA: 2012. [Google Scholar]
- [2].Klin A, Jones W, Schultz R, Volkmar F, Cohen D. Visual fixation patterns during viewing of naturalistic social situations as predictors of social competence in individuals with autism. Archives of general psychiatry. 2002;59(9):809–816. doi: 10.1001/archpsyc.59.9.809. [DOI] [PubMed] [Google Scholar]
- [3].Grossman RB, Edelson LR, Tager-Flusberg H. Emotional facial and vocal expressions during story retelling by children and adolescents with high-functioning autism. Journal of Speech, Language, and Hearing Research. 2013;56(3):1035–1044. doi: 10.1044/1092-4388(2012/12-0067). [DOI] [PMC free article] [PubMed] [Google Scholar]
- [4].Pelphrey KA, Morris JP, McCarthy G, LaBar KS. Perception of dynamic changes in facial affect and identity in autism. Social cognitive and affective neuroscience. 2007 doi: 10.1093/scan/nsm010. [DOI] [PMC free article] [PubMed] [Google Scholar]
- [5].Yirmiya N, Kasari C, Sigman M, Mundy P. Facial expressions of affect in autistic, mentally retarded and normal children. Journal of Child Psychology and Psychiatry. 1989;30(5):725–735. doi: 10.1111/j.1469-7610.1989.tb00785.x. [DOI] [PubMed] [Google Scholar]
- [6].Stagg S, Slavny R, Hand C, Cardoso A, Smith P. Does facial expressivity count? how typically developing children respond initially to children with autism. Autism. 2013:704–711. doi: 10.1177/1362361313492392. [DOI] [PubMed] [Google Scholar]
- [7].Grossman RB. Judgments of social awkwardness from brief exposure to children with and without high-functioning autism. Autism. 2015;19(5):580–587. doi: 10.1177/1362361314536937. [DOI] [PMC free article] [PubMed] [Google Scholar]
- [8].Bone D, Black MP, Ramakrishna A, Grossman R, Narayanan SS. Acoustic-prosodic correlates of awkward' prosody in story retellings from adolescents with autism. Interspeech. 2015:1616–1620. [Google Scholar]
- [9].Bone D, Black MP, Lee C-C, Williams ME, Levitt P, Lee S, Narayanan S. Spontaneous-speech acoustic-prosodic features of children with autism and the interacting psychologist. Interspeech. 2012:1043–1046. [Google Scholar]
- [10].Diehl JJ, Paul R. Acoustic differences in the imitation of prosodic patterns in children with autism spectrum disorders. Research in autism spectrum disorders. 2012;6(1):123–134. doi: 10.1016/j.rasd.2011.03.012. [DOI] [PMC free article] [PubMed] [Google Scholar]
- [11].de Marchena A, Eigsti I-M. Conversational gestures in autism spectrum disorders: Asynchrony but not decreased frequency. Autism research. 2010;3(6):311–322. doi: 10.1002/aur.159. [DOI] [PubMed] [Google Scholar]
- [12].Kapur A, Kapur A, Virji-Babul N, Tzanetakis G, Driessen PF. Affective computing and intelligent interaction. Springer; 2005. Gesture-based affective computing on motion capture data; pp. 1–7. [Google Scholar]
- [13].Metallinou A, Lee C-C, Busso C, Carnicke S, Narayanan S. Multimodal Corpora: Advances in Capturing, Coding and Analyzing Multimodality 18 May 2010. 2010. The usc creativeit database: A multimodal database of theatrical improvisation; p. 55. [Google Scholar]
- [14].Baron-Cohen S. Mind reading [: the interactive guide to emotions. Jessica Kingsley Publishers; 2003. [Google Scholar]
- [15].Guha T, Yang Z, Ramakrishna A, Grossman RB, Hedley D, Lee S, Narayanan SS. On quantifying facial expression-related atypicality of children with autism spectrum disorder. Acoustics, Speech and Signal Processing (ICASSP), 2015 IEEE International Conference on; IEEE; 2015. pp. 803–807. [DOI] [PMC free article] [PubMed] [Google Scholar]
- [16].Metallinou A, Grossman RB, Narayanan S. Quantifying atypicality in affective facial expressions of children with autism spectrum disorders. Multimedia and Expo (ICME), 2013 IEEE International Conference on; IEEE; 2013. pp. 1–6. [DOI] [PMC free article] [PubMed] [Google Scholar]
- [17].Grossman R, Guha T, Yang Z, Hedley D, Narayanan SS. Missing the mark: Dynamic differences in facial expressions of children with hfa. Int. Meeting for Autism Research (IMFAR).2015. [Google Scholar]
- [18].Catarino A, Churches O, Baron-Cohen S, Andrade A, Ring H. Atypical eeg complexity in autism spectrum conditions: a multiscale entropy analysis. Clinical Neurophysiology. 2011;122(12):2375–2383. doi: 10.1016/j.clinph.2011.05.004. [DOI] [PubMed] [Google Scholar]
- [19].Goldberger AL, Peng C-K, Lipsitz LA, Vaillancourt DE, Newell KM. What is physiologic complexity and how does it change with aging and disease? authors' reply. Neurobiology of aging. 2002;23(1):27–29. doi: 10.1016/s0197-4580(01)00266-4. [DOI] [PubMed] [Google Scholar]
- [20].Costa M, Goldberger AL, Peng CK. Multiscale entropy analysis of complex physiologic time series. Physical review letters. 2002;89(6):068102. doi: 10.1103/PhysRevLett.89.068102. [DOI] [PubMed] [Google Scholar]
- [21].Busso C, Narayanan SS. Interrelation between speech and facial gestures in emotional utterances: a single subject study. Audio, Speech, and Language Processing, IEEE Transactions on. 2007;15(8):2331–2347. [Google Scholar]
- [22].Granger CW, Huangb B-N, Yang C-W. A bivariate causality between stock prices and exchange rates: evidence from recent asianflu. The Quarterly Review of Economics and Finance. 2000;40(3):337–354. [Google Scholar]
- [23].Schloper E, Reichler R, Renner B. The childhood autism rating scale western psychological services los angeles. 1988. [Google Scholar]
- [24].Roid GH, Miller LJ. Leiter-r performance scale, revised. Stoelting Co; Wood Dale, IL: 1997. [Google Scholar]
- [25].Dunn LM, Dunn LM. PPVT-III: Peabody picture vocabulary test. American Guidance Service Circle Pines; MN: 1997. [Google Scholar]
- [26].Golan O, Baron-Cohen S. Systemizing empathy: Teaching adults with asperger syndrome or high-functioning autism to recognize complex emotions using interactive multimedia. Development and psychopathology. 2006;18(2):591. doi: 10.1017/S0954579406060305. [DOI] [PubMed] [Google Scholar]
- [27].Baron-Cohen S, Hill J, Wheelwright S. Cambridge Medicine. 2002. Mind reading made easy. [Google Scholar]
- [28].Hauck J, J. D. Los Angeles, Digital Concepts Group, inc. House of Moves. 2007. House of moves high resolution facial marker-set (92 markers) [Google Scholar]
- [29].Ekman P, Friesen WV. Facial Action Coding System: Investigatoris Guide. Consulting Psychologists Press; 1978. [Google Scholar]
- [30].Costa M, Goldberger AL, Peng CK. Multiscale entropy analysis of biological signals. Physical review E. 2005;71(2):021906. doi: 10.1103/PhysRevE.71.021906. [DOI] [PubMed] [Google Scholar]
- [31].Lake DE, Richman JS, Griffin MP, Moorman JR. Sample entropy analysis of neonatal heart rate variability. American Journal of Physiology-Regulatory, Integrative and Comparative Physiology. 2002;283(3):R789–R797. doi: 10.1152/ajpregu.00069.2002. [DOI] [PubMed] [Google Scholar]
- [32].Tian Y.-l., Kanade T, Cohn JF. Recognizing action units for facial expression analysis. Pattern Analysis and Machine Intelligence, IEEE Transactions on. 2001;23(2):97–115. doi: 10.1109/34.908962. [DOI] [PMC free article] [PubMed] [Google Scholar]
- [33].Tanaka JW, Sung A. The eye avoidance hypothesis of autism face processing. Journal of autism and developmental disorders. 2013:1–15. doi: 10.1007/s10803-013-1976-7. [DOI] [PMC free article] [PubMed] [Google Scholar]
- [34].Kliemann D, Dziobek I, Hatri A, Baudewig J, Heekeren HR. The role of the amygdala in atypical gaze on emotional faces in autism spectrum disorders. The Journal of Neuroscience. 2012;32(28):9469–9476. doi: 10.1523/JNEUROSCI.5294-11.2012. [DOI] [PMC free article] [PubMed] [Google Scholar]
- [35].Hutchins TL, Brien A. Conversational topic moderates social attention in autism spectrum disorder: Talking about emotions is like driving in a snowstorm. Research in Autism Spectrum Disorders. 2016;26:99–110. [Google Scholar]
- [36].Pelphrey KA, Sasson NJ, Reznick JS, Paul G, Goldman BD, Piven J. Visual scanning of faces in autism. Journal of autism and developmental disorders. 2002;32(4):249–261. doi: 10.1023/a:1016374617369. [DOI] [PubMed] [Google Scholar]
- [37].Myers C, Rabiner LR, Rosenberg AE. Performance tradeoffs in dynamic time warping algorithms for isolated word recognition. Acoustics, Speech and Signal Processing, IEEE Transactions on. 1980;28(6):623–635. [Google Scholar]
- [38].Kim Y, Provost EM. Emotion classification via utterance-level dynamics: A pattern-based approach to characterizing affective expressions; Acoustics, Speech and Signal Processing, 2013 IEEE International Conference on; 2013. pp. 3677–3681. [Google Scholar]
- [39].Barrett AB, Murphy M, Bruno M-A, Noirhomme Q, Boly M, Laureys S, Seth AK. Granger causality analysis of steady-state electroencephalographic signals during propofol-induced anaesthesia. PloS one. 2012;7(1):e29072. doi: 10.1371/journal.pone.0029072. [DOI] [PMC free article] [PubMed] [Google Scholar]
- [40].Miao X, Wu X, Li R, Chen K, Yao L. Altered connectivity pattern of hubs in default-mode network with alzheimers disease: an granger causality modeling approach. PloS one. 2011;6(10):e25546. doi: 10.1371/journal.pone.0025546. [DOI] [PMC free article] [PubMed] [Google Scholar]
- [41].Brovelli A, Ding M, Ledberg A, Chen Y, Nakamura R, Bressler SL. Beta oscillations in a large-scale sensorimotor cortical network: directional influences revealed by granger causality. Proceedings of the National Academy of Sciences of the United States of America. 2004;101(26):9849–9854. doi: 10.1073/pnas.0308538101. [DOI] [PMC free article] [PubMed] [Google Scholar]


