Supplemental Digital Content is available in the text.
Keywords: Fabry disease; hypertrophy, left ventricular; magnetic resonance imaging; phenotype
Abstract
Background:
Fabry disease (FD) is a rare and treatable X-linked lysosomal storage disorder. Cardiac involvement determines outcomes; therefore, detecting early changes is important. Native T1 by cardiovascular magnetic resonance is low, reflecting sphingolipid storage. Early phenotype development is familiar in hypertrophic cardiomyopathy but unexplored in FD. We explored the prehypertrophic cardiac phenotype of FD and the role of storage.
Methods and Results:
A prospective, international multicenter observational study of 100 left ventricular hypertrophy–negative FD patients (mean age: 39±15 years; 19% male) and 35 age- and sex-matched healthy volunteers (mean age: 40±14 years; 25% male) who underwent cardiovascular magnetic resonance, including native T1 and late gadolinium enhancement, and 12-lead ECG. In FD, 41% had a low native T1 using a single septal region of interest, but this increased to 59% using a second slice because early native T1 lowering was patchy. ECG abnormalities were present in 41% and twice as common with low native T1 (53% versus 24%; P=0.005). When native T1 was low, left ventricular maximum wall thickness, indexed mass, and ejection fraction were higher (maximum wall thickness 9±1.5 versus 8±1.4 mm, P<0.005; indexed left ventricular mass 63±10 versus 58±9 g/m2, P<0.05; and left ventricular ejection fraction 73±8% versus 69±7%, P<0.01). Late gadolinium enhancement was more likely when native T1 was low (27% versus 6%; P=0.01). FD had higher maximal apical fractal dimensions compared with healthy volunteers (1.27±0.06 versus 1.24±0.04; P<0.005) and longer anterior mitral valve leaflets (23±2 mm versus 21±3 mm; P<0.005).
Conclusions:
There is a detectable prehypertrophic phenotype in FD consisting of storage (low native T1), structural, functional, and ECG changes.
See Editorial by Schelbert
CLINICAL PERSPECTIVE
Cardiovascular death is the leading cause of the death in Fabry disease in both males and females. As it is a treatable disease, detection of early cardiac involvement is important. Treatment seems less effective once fibrosis and overt left ventricular hypertrophy occur; however, treatment is onerous and expensive thus phenotypic justification is required to commence patients on treatment. Low native myocardial T1 reflects sphingolipid accumulation and has promising potential in early detection in the prehypertrophic Fabry disease population. We have concluded that low native T1 is patchy in the LVH-negative population and is more common than previously reported (prevalence increased to 59%) by measuring regions of interests in at least 2 short-axis slices and inspection of color maps with appropriate lookup tables. Multiple abnormalities cosegregated with low native T1. ECG abnormalities were present in 41% and were twice as common when native T1 was low. LV maximum wall thickness, indexed mass, and ejection fraction were higher with low native T1. LGE was 5 times more likely when native T1 was low. Thirty-one percent of patients were found to have both low native T1 and ECG abnormalities; therefore, we hypothesized that this subgroup is most likely to progress, and early treatment in this subgroup may have the most clinical impact.
Fabry disease (FD) is a rare X-linked lysosomal storage disorder caused by mutations in the gene (GLA) encoding for α-galactosidase A. Slowly progressive sphingolipid accumulation affects multiple organs, including the heart.1 Cardiac and renal involvement drives outcome in FD with cardiovascular death being the leading cause of death in FD.2–4 Cardiac manifestations include left ventricular hypertrophy (LVH), arrhythmias, chronic inflammation,5 myocardial fibrosis, and functional impairment.6 Among the suggested risk factors for ventricular arrhythmias and sudden cardiac death were LVH and myocardial fibrosis.3 Although oral chaperone has now become available for amenable mutations,7 the mainstay of therapy has been enzyme replacement therapy (ERT), which is expensive, less effective after the onset of fibrosis, and does not entirely reverse established LVH suggesting that best outcomes may occur with early initiation of ERT.8 Early phenotypic markers of FD cardiac involvement are, therefore, needed.
The link of sphingolipids to cardiac disease is not well understood. Although storage is thought to be a primary factor, toxic circulating metabolites may play a role.9 An advance was the identification by cardiovascular magnetic resonance (CMR) of late gadolinium enhancement (LGE), which characteristically occurs initially in the basal inferolateral wall.10 Histological correlation in advanced disease confirmed it represented focal fibrosis.11 However, LGE is generally considered a late feature in FD,12,13 although it may occur before LVH in females.14 CMR allows quantitative characterization of the myocardium using 3 fundamental magnetic tissue relaxation constants, T1, T2, and T2*, and displays them as parametric color maps. Native T1 is low, representing sphingolipid accumulation,15,16 in 85% of FD with LVH and 40% to 50% of LVH-negative patients, suggesting storage occurs early.15,17 ECG changes are known to sometimes precede echocardiographic LVH,18,19 and elevated levels of serum cardiac biomarkers (troponin and NT-proBNP [N-terminal pro-B-type natriuretic peptide]) have also been described.5,20,21 In sarcomeric hypertrophic cardiomyopathy (HCM), a preclinical phenotype is present with, among other features, multiple myocardial crypts, anterior mitral valve leaflet (AMVL) elongation, abnormal trabeculae, and a higher ejection fraction.22
We sought a prehypertrophic cardiac phenotype in FD—looking for whether storage, ECG changes, subtle structural and functional abnormalities, and blood biomarkers cosegregate.
Methods
The imaging data and study materials are all anonymized and centralized on a REDCap server and are available to other researchers for purposes of reproducing the results or replicating the procedure if requested.
Study Population
This is a prospective, multicenter international observational study in 100 LVH-negative FD patients as a part of the Fabry400 study (NCT03199001). Participants were recruited from 4 Fabry clinics (United Kingdom: Royal Free Hospital London, National Hospital for Neurology and Neurosurgery London, and Queen Elizabeth Hospital Birmingham; Australia: Westmead Hospital Sydney). This study was approved by the National Research Ethics Service ethical committee and conformed to the principles of the Helsinki Declaration. Written informed consent was obtained from all participants. Inclusion criteria were as follows:
FD (n=100): all gene-positive LVH-negative males and females with left ventricular (LV) maximum wall thickness (MWT) <13 mm and LV mass (LVM) within the normal reference ranges by CMR according to body surface area, age, and sex.23
Healthy volunteers (HV, n=35): all prospectively recruited with no history of cardiovascular disease (normal health questionnaire and on no cardioactive medication unless for primary prevention).
Exclusion criteria were as follows: We excluded patients with standard contraindications to CMR and pregnancy. All participants underwent CMR and ECG. All participants had estimated glomerular filtration rate blood samples collected. The blood for serological biomarkers was systematically obtained by the time of the intravenous access and analyzed for high-sensitivity troponin T (United Kingdom) and high-sensitivity troponin I (Australia) (Roche Diagnostic; normal range 0–14 ng/L for troponin T and 0–15 ng/L for troponin I), and NT-proBNP (N-terminal pro-B-type natriuretic peptide) analysis (Roche Diagnostics; normal range according to age and sex).20 As a result, NT-proBNP and troponin results were available in majority of patients (76% and 73%). The missing blood values were because of patient refusal of gadolinium contrast agent (n=12), absence of research clinical fellow support at the scanner (n=10), and hemolyzed (n=2 for NT-proBNP; n=5 for troponin).
CMR Imaging
All participants underwent CMR at 1.5 Tesla (Avanto (United Kingdom) and Aera (Australia); Siemens Healthcare, Erlangen, Germany) using a standard clinical protocol with LGE imaging using phase sensitive inversion recovery. T1 mapping was performed precontrast bolus administration (0.1 mmol/kg body weight, gadoterate meglumine; Dotarem, Guerbet S.A., France) on basal and mid left ventricular short-axis slices using a shortened modified Look-Locker inversion recovery (ShMOLLI) sequence. The resulting pixel-by-pixel T1 color maps were displayed using a customized 12-bit lookup table, where normal myocardium was green, increasing native T1 was red, and decreasing native T1 was blue. Post-T1 mapping was performed 15 minutes after contrast administration for extracellular volume (ECV) fraction quantification.
CMR Analysis
All images were centralized and analyzed using CVI42 software (Circle Cardiovascular Imaging, Inc, Calgary, Canada). The analysis plan was for a region of interest (ROI) avoiding the blood–myocardial boundary (20% offset) manually drawn in the basal septum,24 but visual inspection of the color maps showed that native T1 lowering (blue areas) could be patchy so 6 segments in basal and mid short-axis slices were used in further analyses (Figures 1 and 2). Normal native T1 reference ranges (mean±2 SD) were defined using age- and sex-matched HV from each individual center, taking into account the native T1 regional variations in HV from each center.
Figure 1.
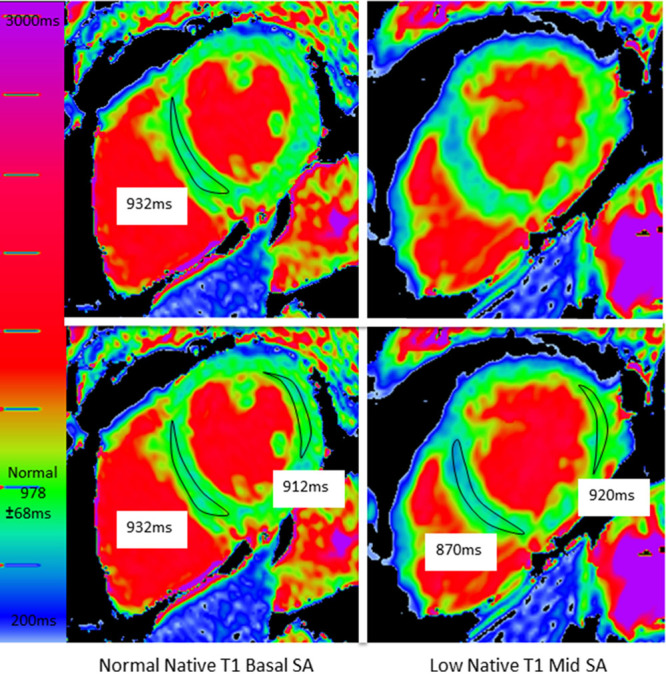
A patient with obvious but missed low native T1. Top: The usual approach is to draw one region of interest (ROI) in a single short-axis (SA) slice. This generated a normal native T1 (932 ms). Note, however, there is blue myocardium in the second, unmeasured slice. By drawing other ROIs on both slices (bottom), the low native T1 is captured.
Figure 2.
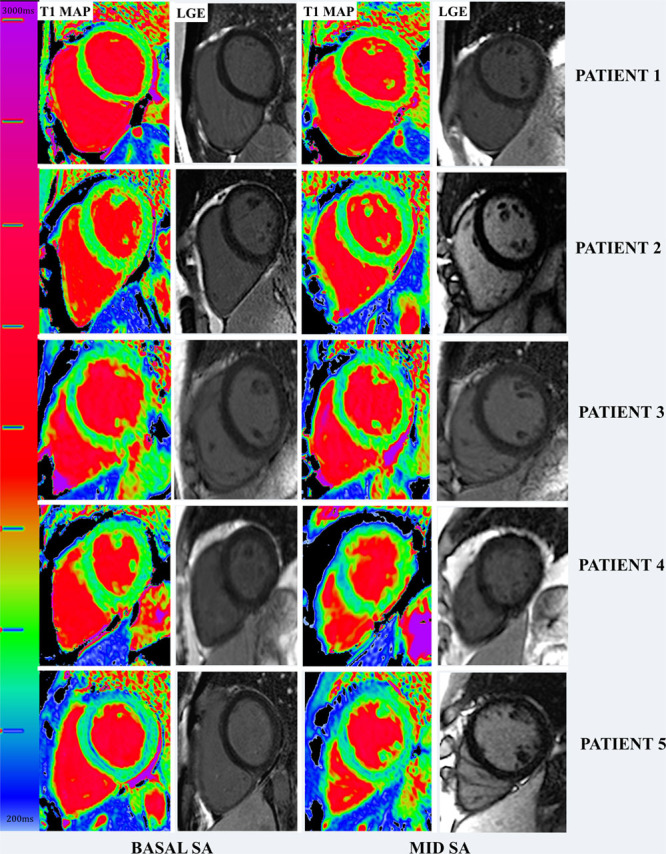
Spectrum of native T1 in left ventricular hypertrophy–negative Fabry disease with corresponding late gadolinium enhancement (LGE) images. Patient 1: Normal native T1 in both basal and mid short axis (SA). Patient 2: Patchy low native T1 in the lateral walls. Patient 3: Patchy low native T1 mainly in both SA slices. Patient 4: Patchy low native T1 in the mid SA septum but normal native T1 in basal SA. Patient 5: low native T1 all across both SA.
The normal native septal T1 ranges (mean, 1 SD, and lower limit of normal) for each center were London center: mean 968±32 ms and lower limit 904 ms in total population; mean 956±27 ms and lower limit 902 ms in male subgroup; and mean 978±34 ms and lower limit 910 ms in female subgroup. Birmingham center: mean 959±32 ms and lower limit 895 ms in total population; mean 947±28 ms and lower limit 890 ms in male subgroup; and mean 958±30 ms and lower limit 898 ms in female subgroup. Sydney center: mean 958±31 ms and lower limit 896 ms in total population; mean 947±24 ms and lower limit 893 ms in male subgroup; and mean 965 ±31 ms and lower limit 903 ms in female subgroup.
The The T1 Mapping and ECV Standardization Program phantom was scanned as part of the The T1 Mapping and ECV Standardization Program multicenter study according to the user manual instructions distributed to centers and as previously described.25 The London site coefficient of variation for reads varies from 0.017 to 2.267 at mean temperature of 20. Birmingham site coefficient of variation for reads varies from 0.512 to 1.460 at mean temperature of 21. Sydney site coefficient of variation for reads varies from 0.033 to 1.169 at mean temperature 21. Intersite reads across the 9 tubes were consistent (all P>0.05): the mean differences in measured T1 across all tubes were 10.30±5.71 (SD) ms between sites. Considering only the tubes emulating normal native myocardial T1 and low native myocardial T1 (that are relevant to FD in this article), the mean differences in measured T1 between sites was 9.52±3.64 (SD) ms.
We used the differential methods for quantification of LV volumes (excluding left ventricular papillary mass [LVPM]) and LVM (including LVPM) by manual contouring of LVPM (Figure I in the Data Supplement).23,26,27 Automated (threshold-dependent) methods have not been used. The LVPM were reported as absolute mass.
AMVL measurements and myocardial crypt counts (considering only ≥2) followed published methodologies.22,28
For trabeculae, LV fractal analysis was performed on the LV short-axis cine stack using the cvi42 fractal plugin as previously described deriving the following fractal dimensions: mean whole heart (fractal dimensionmean) and maximal apical (fractal dimensionmaxapical).29
ECG Analysis
Twelve-lead ECG was prospectively performed on all participants. The ECGs were independently analyzed by 2 experienced observers (S.N. and S.B.). Recorded ECG variables included heart rate, rhythm, PR interval duration (normal 120–200 ms), QRS complex duration (normal <120 ms), and QTc interval duration (normal >440 ms for males and >460 ms for females). The presence of complete left or right bundle branch block, T-wave inversion in at least 2 contiguous leads, multifocal ventricular ectopics, and Sokolow–Lyon voltage criteria for LVH (SV1+RV5 or RV6 >35 mm) were also recorded.
Statistical Analysis
Statistical analyses were performed using SPSS 24 (IBM, Armonk, NY). Continuous variables were expressed as mean±SD or median (interquartile range [IQR]) according to normality (Shapiro–Wilk test); categorical variables were expressed as percentages. Group testing was independent-sample t test, Mann–Whitney U, χ2 test, or Fisher exact test as appropriate (normality, categorical, or continuous). Comparisons between 3 groups were performed by 1-way ANOVA with post hoc Bonferroni correction. The Bland–Altman test and intraclass correlation coefficient were used to assess intra- and interobserver variability of native T1. The coefficient of variation between repeated phantom scans was calculated as a measure of reproducibility. A P value of <0.05 was considered significant.
Results
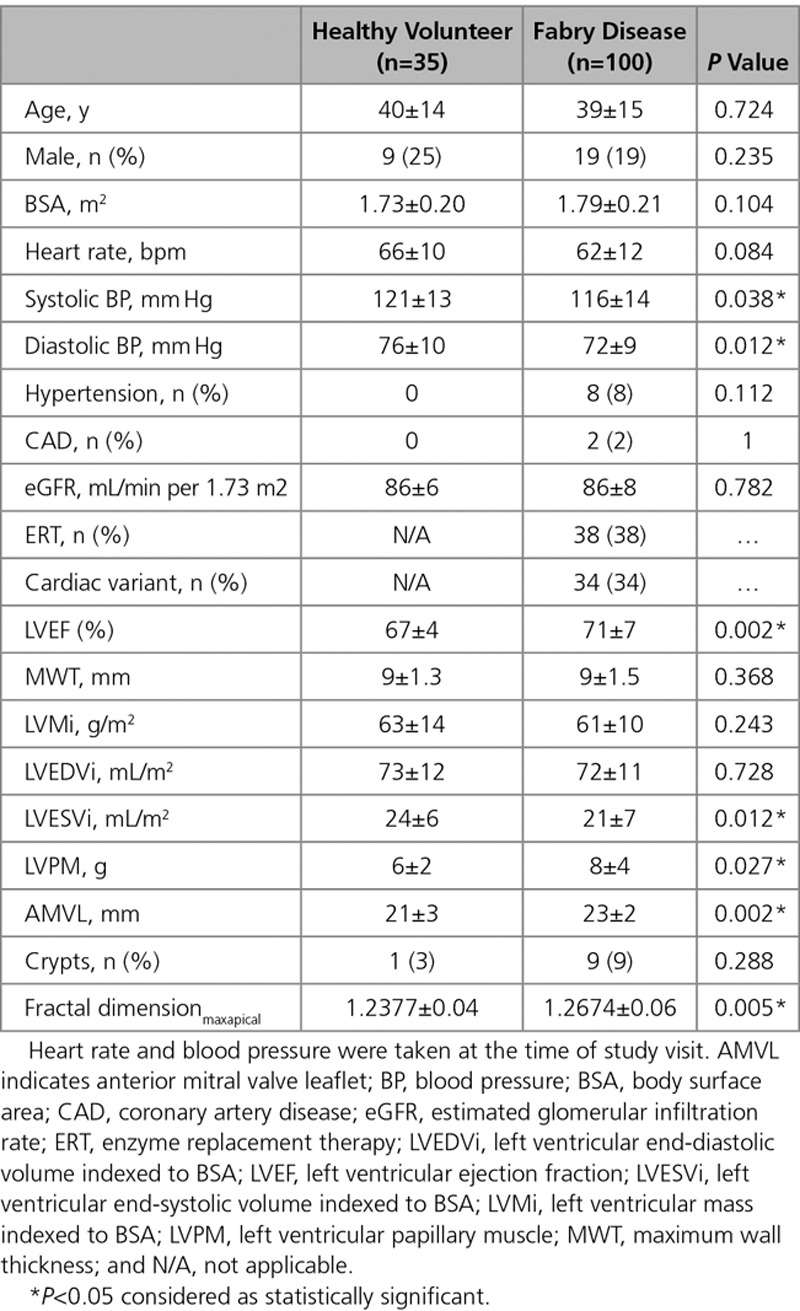
There were 135 participants: 100 FD and 35 HV. Recruitment was from London, Birmingham, and Sydney (n=80, 13, and 7, respectively). Baseline characteristics are shown in Table 1. Mean age of the FD cohort was 39±15 years with 81% female. Mean estimated glomerular filtration rate was 86±8 mL/min per 1.73 m2. Of the FD group, 34% were of cardiac (later onset) variant.30 Of the cardiac variant group, 85% (29/34) with N215S mutation, 9% (3/34) with I91T mutation, and 6% (2/34) with R301Q mutation. Thirty-eight percent of FD patients were on ERT. The median ERT duration was 7 years (IQR: 4.3–9 years). Indications for ERT were mainly attributable to extracardiac manifestations including uncontrolled acroparesthesia, neurological involvement such as stroke, and renal involvement such as proteinuria. One patient had started ERT primarily for ECG changes (conduction abnormalities). ERT was not correlated with native T1 or ECG changes: 41% (24/59) versus 34% (14/41), of low versus normal native T1 patients were on ERT (P=0.51), and 42% (17/41) versus 36% (21/59), of abnormal ECG versus normal ECG patients were on ERT (P=0.55). ERT duration did not correlate with native T1 (low native T1 subgroup median 7 years [IQR: 5.5–9.5 years] versus normal native T1 subgroup 9 years [IQR: 7–11 years]; P=0.12) or ECG abnormalities (abnormal ECG subgroup median 8 years [IQR: 5.5–10 years] versus normal ECG subgroup 9 years [IQR: 7–10 years]; P=0.17).
Table 1.
Demographic Characteristics of the Healthy Volunteers and Fabry Disease Cohort
Myocardial Abnormalities
Function and Mass
All FD patients had normal LV MWT, LV cavity size, and mass and mass-to-volume ratios <1. MWT in the FD and HV cohorts were similar (9±1.5 versus 9±1.3 mm; P=0.4). Indexed LVM (LVMi) and LV end-diastolic volume were similar to HV (LVMi 61±10 versus 63±14 g/m2; P=0.20 and LV end-diastolic volume 72±11 versus 73±12 mL/m2; P=0.7), but LV end-systolic volume was smaller in FD (21±7 versus 24±6 mL/m2; P=0.012). All patients had normal or supranormal LV systolic function, and overall, the LVEF in FD was higher than HV (71±7% versus 67±4%; P=0.002).
Myocardial Native T1
Using a basal septal ROI, 41 of 100 FD participants (41%) had a low native T1. However, native T1 lowering was observed visually on the color maps to be patchy in many. Therefore, we analyzed a second slice with further ROIs (Figure 1). This increased the low native T1 prevalence to 59% (an additional of 18 patients)—but preserved the 0% prevalence in HVs. It was these 59% FD patients who were considered as having low native T1 for subsequent analyses.
Native T1 Reproducibility
Native T1 intra- and interobserver variability (n=30) were good—the low native T1 areas are obvious when displayed with an appropriate lookup table (Figure 2). Intraclass correlation coefficients (intraobserver then interobserver) in the septum were 0.995 and 0.986, respectively, and ROIs elsewhere: 0.983 and 0.986. Bland–Altman graphs did not show systemic bias (Figure II in the Data Supplement).
Myocardial LGE
Sixteen FD had LGE (13 basal inferolateral wall and 3 right ventricular insertion points). No HV had LGE.
Myocardial ECV
The ECV measured from a septal ROI was normal in all participants (FD 0.27±0.03 versus HV 0.28±0.03; P=0.46).
ECG
In FD, 41% (41/100) had abnormal ECGs. There were 4 patients with other potential causes of ECG abnormalities (n=1 coronary artery disease; n=3 hypertension). All HV ECGs were normal.
Blood Biomarkers
Of the FD patients, 73% had high-sensitivity troponin and 76% had NT-proBNP measured. Ten percent (7/73) had raised high-sensitivity troponin levels and 16% (12/76) had raised NT-proBNP.
Papillary Muscles
Papillary muscle mass was higher in FD (8±4 versus 6±2 g; P<0.05).
Myocardial Architecture
In FD compared with HV, the anterior mitral valve leaflet was longer (23±2 versus 21±3 mm; P=0.002). Nine percent (9/100) of FD and 3% (1/35) of HV had crypts (P>0.05). Compared with HV, FD had abnormal trabeculae at the apex resulting in higher fractal dimensionmaxapical (1.27±0.06 versus 1.24±0.04; P<0.005). Fractal dimensionmean were similar to HV (1.22±0.03 versus 1.23±0.03; P=0.10).
Cosegregation of Early Changes
Native T1 and ECG
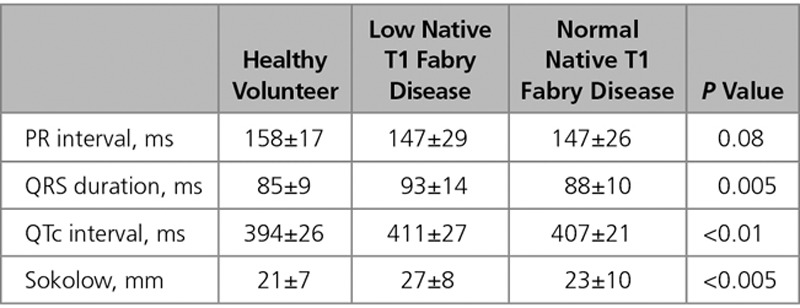
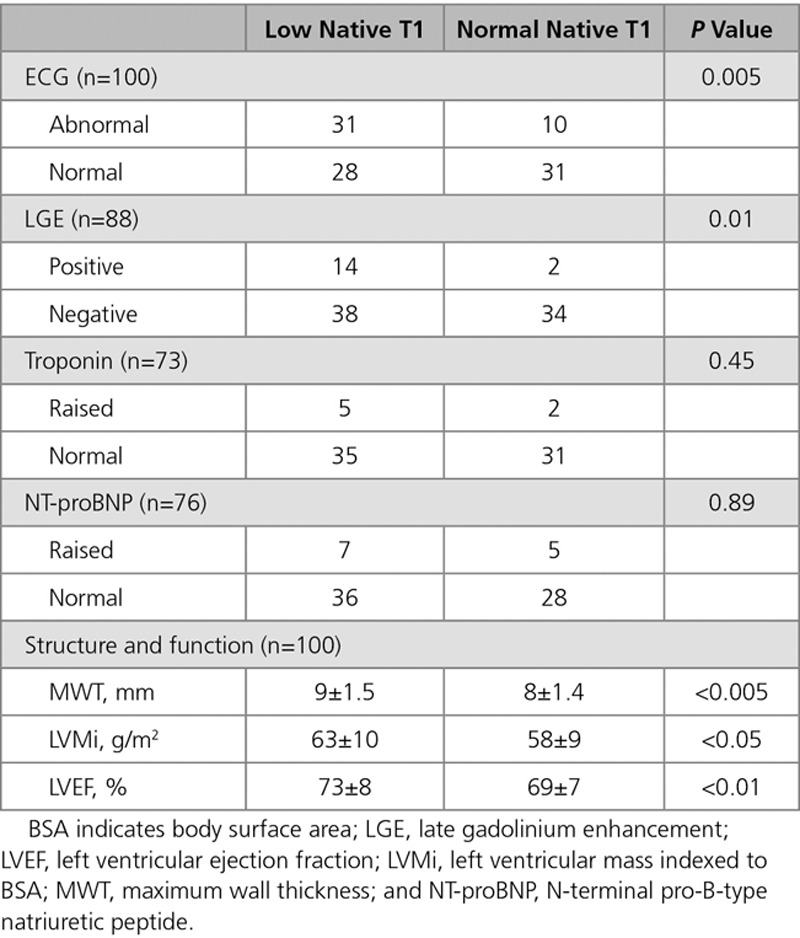
Of the patients with abnormal ECGs, 76% (31/41) had low native T1. ECG abnormalities were more than twice as common when the T1 was low (53%, 31/59 versus 24%, 10/41; P=0.005). The ECG abnormalities observed were (low native T1 versus normal native T1) Sokolow (19% versus 7%), T-wave inversion (13% versus 7%), short PR (12% versus 5%), and long PR intervals (9% versus 2%; Figure 3). QRS interval, QTc interval, and Sokolow–Lyon voltages were higher in the low native T1 subgroup than that in the normal native T1 FD subgroup and HV (Table 2).
Figure 3.
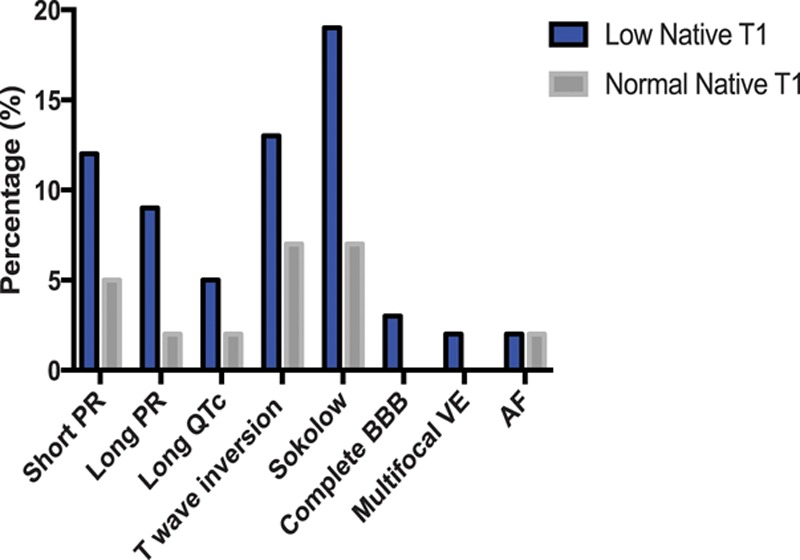
Comparison of ECG abnormalities between low native T1 and normal native T1 Fabry disease subgroups. AF indicates atrial fibrillation; BBB, bundle branch block; and VE, ventricular ectopics.
Table 2.
ECG Parameters of Healthy Volunteers, Low Native T1 Fabry Disease, and Normal Native T1 Fabry Disease
Native T1 and LV Function/Mass
MWT, LVMi, and EF were higher in low native T1 than that in normal native T1 FD (MWT 9±1.5 versus 8±1.4 mm, P<0.005; LVMi 63±10 versus 58±9 g/m2, P<0.05; EF 73±8% versus 69±7%, P<0.01). LV end-diastolic volume index, LV end-systolic volume index, and mass-to-volume ratio were the same. Normal native T1 patients were the same as HV for all parameters.
Native T1 and LGE
LGE was ≈5 times as common in the low native T1 FD subgroup compared with the normal native T1 FD subgroup (27%, 14/52 versus 6%, 2/34; P=0.01). Eighty-seven percent (13/15) with LGE had low native T1 (Figure 4). One patient with normal native T1 and LGE had both a history of hypertension and coronary artery disease; however, the LGE pattern in this patient was typical of Fabry (midwall basal inferolateral).
Figure 4.
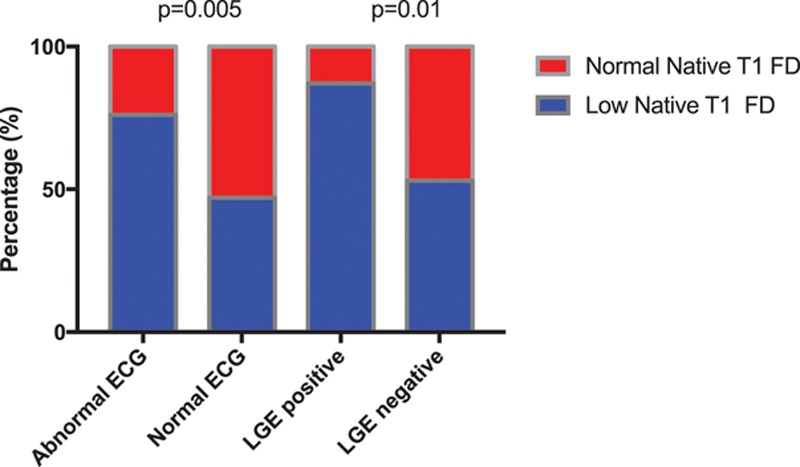
Normal versus abnormal ECG and late gadolinium enhancement (LGE)–positive vs LGE-negative in the low native T1 and normal native T1 Fabry disease (FD) subgroups showing ECG abnormalities are found in 76% vs 24% (P=0.005) and LGE in 87% versus 13% (P=0.01).
Native T1 and ECV
ECV was the same in low native T1, normal native T1, and HV (0.27±0.03 versus 0.28±0.03 versus 0.28±0.03; all P=0.56).
Native T1 and Blood Biomarkers
Although most patient with elevated biomarkers had low T1 (71%, 5/7 for high-sensitivity troponin; 58%, 7/12 for NT-proBNP), differences were not significant.
Native T1 and Papillary Muscles
With low native T1, papillary muscle mass was higher (P=0.003). Normal native T1 patients had similar papillary muscle mass as HV (low native T1 FD 8±4 g versus normal native T1 FD 6±3 g versus HV 6±2 g). Papillary muscle mass increase was not out of proportion to compacted myocardial hypertrophy, however.
Native T1 and AMVL/Fractal Dimension
AMVL elongation and the increased apical fractal dimension were storage independent and not confined to the low native T1 group—AMVL elongation and increased apical fractal dimension were the only variables different between normal native T1 FD and HV (AMVL normal native T1 versus HV: 24±3 versus 21±3 mm; P=0.004 and fractal dimensionmaxapical normal native T1 versus HV: 1.27±0.05 versus 1.24±0.04; P=0.01).
Other Comparisons
LGE and Blood Biomarkers
Half of the patients with LGE had raised troponin. No other patients had raised troponin (45%, 5/11 versus 0%, 0/57; P<0.001). There was no significant difference in the prevalence of raised NT-proBNP in the LGE-positive and LGE-negative subgroups (17%, 2/10 versus 14%, 8/59; P=0.29).
ERT and ERT-Naive
There was no significant difference between proportion of low T1, abnormal ECG, LGE, raised troponin, and NT-proBNP between the ERT and ERT-naive subgroups. There was also no significant difference between the MWT, LVMi, LVPM, and LVEF between these subgroups.
Males and Females
There are higher proportions of males with low T1 and abnormal ECG compared with females (low T1 male 79%, 15/19 versus female 54%, 44/81; P<0.05 and abnormal ECG male 63%, 12/19 versus female 36%, 29/81; P<0.05). Males have higher MWT (10±1.3 versus 9±1.5 mm; P<0.001) and LVMi (71±10 versus 59±9 g/m2; P<0.001), and females have higher LVEF (73±7% versus 66±8%; P=0.001). Ninety-four percent (15/16) with LGE were female; the 1 male had LGE at right ventricular insertion point.
Discussion
These data show that there is a prehypertrophic FD phenotype. In LVH-negative FD, storage (low native T1) is patchy and more common (prevalence 59%) than previously reported.15,17 Multiple other abnormalities are found. Most of these cluster with low native T1–ECG changes, higher EF, higher mass (within the normal range), larger papillary muscles, and LGE (Table 3). There are, however, 2 exceptions: first, troponin is associated with LGE rather than directly with storage (as in overt disease5) and second, anterior mitral valve leaflet and abnormal apical trabeculae (known markers of preclinical sarcomeric HCM22) are also present in prehypertrophic FD and seem to be storage independent. Diffuse fibrosis (ECV) and NT-proBNP were not useful. Overall, these data suggest first that storage is a key part of FD phenotype development and second that there is a storage-independent FD phenotype with some of its features, recapitulating those seen in preclinical sarcomeric HCM.22
Table 3.
Comparison Between Low Native T1 and Normal Native T1 Fabry Disease With ECG, LGE, Troponin, NT-proBNP, MWT, LVMi, and LVEF
Earlier phenotypic markers of FD cardiomyopathy are needed as cardiac involvement drives prognosis, and ERT may be more successful if initiated before the cardiomyopathic cascade of secondary changes (LVH, inflammation, and fibrosis) is established.8,31 Treatment is expensive so is unfeasible without phenotypic justification, although new oral chaperone treatment may aid therapy in patients with amenable mutations.
Based on this single time-point assessment, some similarities and differences to preclinical sarcomeric HCM may be described: in both, ECG abnormalities occur early along with hyperdynamic function and mass increases within the normal range. AMVL elongation and increased endocardial complexity at the apex suggesting abnormal trabeculae are features common to both (Figure 5). The spectrum of ECG abnormalities is similar, although a short PR is occasionally observed here in FD. Differences include the native T1 lowering (unique to FD), the absence of crypts (crypts occur in preclinical HCM, particularly MYBPC3, and are detectable in all mice in utero as part of normal development),32 early papillary muscle mass increase, and LGE as a pre-LVH FD feature in females, linking to troponin elevation.
Figure 5.
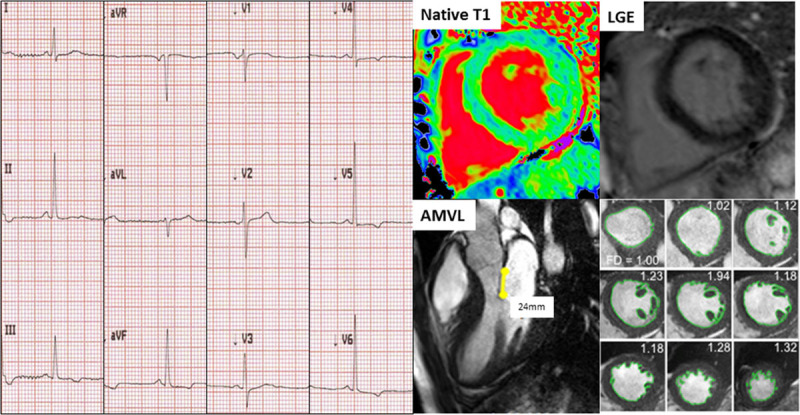
Example of a Fabry disease (FD) patient with low native T1 and no late gadolinium enhancement (LGE) with abnormal ECG (T-wave inversion in leads III, aVF, V4 through V6). Anterior mitral valve leaflet (AMVL) elongation (24 mm) and hypertrabeculation (fractal dimensionsmaxapical 1.32) were also present; these latter 2 features, however, are native T1-independent.
To date, T1 mapping has added diagnostic value in overt LVH where elevation (mainly amyloid) and lowering (only FD or dual pathology: iron overload and a separate LVH cause) are highly sensitive and specific.17 In the absence of histological confirmation, a low native T1 caused by cardiac iron overload is usually obvious from history and examination of the patient and extracardiac findings in CMR such as dark appearance of the liver and extra medullary hematopoiesis.
These data add support to the use of a low native T1 to identify prehypertrophic or early cardiac involvement in FD and may be a candidate starting criteria for early treatment in either practice or in clinical trials. We highlight that more than one ROI and inspection of color maps with appropriate lookup tables are needed to maximize sensitivity for early storage. ECG changes have been known to precede echocardiographic features18,19 but may be nonspecific.33 A low native T1 if at the detection limit could also generate false positives. How could ECG and native T1 be used in combination clinically? Cardiac involvement by ECG abnormalities only was 41%; 59% by low native T1 only. However, cardiac involvement by an either ECG abnormalities or low native T1 approach is 69% by either or 31% by both (Table 3). In LVH-negative FD, it is the low native T1 and abnormal ECG cohort that we hypothesized is most likely to progress and may benefit most from early intervention. The other features identified here (subtle LVM elevation or increased EF) are more between-group differences.
We do not know the mechanism linking low native T1 with ECG abnormalities, but others have shown globotriaosylceramide (GB3) around the atrioventricular node might cause PR-interval shortening, therefore accelerating atrioventricular conduction rather than accessory pathways.19,34–37 Over time, there is evidence of PR prolongation and increasing QRS duration.36 This is likely because of progressive deposition of GB3 in cardiac conduction tissue causing cellular dysfunction.36,38–40 There have been no studies previously linking T-wave inversion and LVH ECG voltage criteria such as Sokolow criteria with T1 mapping in this population; however, these ECG changes have been observed in LVH-negative FD in a previous study.20 ECG abnormalities were at least twice as common when the native T1 was low in FD, supporting a role for storage in the pathogenesis. However, a small minority of patients (n=10) had ECG abnormalities before detectable storage (normal native T1). This could be because of other effects such as circulating metabolites,9 inflammation, or T1 mapping test insensitivity. We have recently highlighted that LGE in FD is chronic inflammation in established disease,5 and we and others5,21 highlight the role of troponin measurement in overt cardiac involvement.
Limitations of our study include the underlying histological substrate is only presumably sphingolipid. Other T1-lowering influences (iron, gadolinium, for example, from earlier scans, and other forms of fat) or confounding by T1 elevators (fibrosis, amyloid, vasodilatation, and edema) in native T1 are possible given the lack of a direct histological comparison in this article. To date, there is no comparative study with the automated threshold methods provided by various vendors; therefore, the results of this study cannot be transferred to these other approaches. Some heterogeneity in the study population is noted, particularly with respect to ERT that impact phenotype,8,41 and some variation across centers in T1 mapping technique could be expected.
In addition, we provide no outcome data, although we plan 5-year follow-up to determine disease progression. It is unclear how and if these patients would benefit from early institution of ERT. The significance of the type of ECG abnormality is also unknown because of lack of prospective studies in this population.
Conclusions
Storage in LVH-negative FD is more common than previously described because early native T1 lowering may be patchy. There is a measurable early phenotype in prehypertrophic FD, including low native T1, ECG abnormalities, LGE, LVM, wall thickness, and ejection fraction elevation. Increased trabeculation and elongation of the anterior leaflet of the mitral valve are also seen.
Sources of Funding
This study is part of the Fabry400 study, which is funded by an investigator-led research grant from Genzyme.
Disclosures
None.
Supplementary Material
Footnotes
The Data Supplement is available at http://circimaging.ahajournals.org/lookup/suppl/doi:10.1161/CIRCIMAGING.117.007168/-/DC1.
References
- 1.Zarate YA, Hopkin RJ. Fabry’s disease. Lancet. 2008;372:1427–1435. doi: 10.1016/S0140-6736(08)61589-5. doi: 10.1016/S0140-6736(08)61589-5. [DOI] [PubMed] [Google Scholar]
- 2.Waldek S, Patel MR, Banikazemi M, Lemay R, Lee P. Life expectancy and cause of death in males and females with Fabry disease: findings from the Fabry Registry. Genet Med. 2009;11:790–796. doi: 10.1097/GIM.0b013e3181bb05bb. doi: 10.1097/GIM.0b013e3181bb05bb. [DOI] [PubMed] [Google Scholar]
- 3.Baig S, Edwards N, Kotecha D, Liu B, Nordin S, Kozor R, Moon JC, Geberhiwot T, Steeds RP. Ventricular arrhythmia and sudden cardiac death in Fabry disease: a systematic review and identification of risk factors in clinical practice [published online ahead of print October 17, 2017]. Europace. doi: 10.1093/europace/eux261. doi: 10.1093/europace/eux261. https://academic.oup.com/europace/advance-article-abstract/doi/10.1093/europace/eux261/4555480?redirectedFrom=fulltext. Accessed April 24, 2018. [DOI] [PubMed] [Google Scholar]
- 4.Patel MR, Cecchi F, Cizmarik M, Kantola I, Linhart A, Nicholls K, Strotmann J, Tallaj J, Tran TC, West ML, Beitner-Johnson D, Abiose A. Cardiovascular events in patients with Fabry disease natural history data from the Fabry registry. J Am Coll Cardiol. 2011;57:1093–1099. doi: 10.1016/j.jacc.2010.11.018. doi: 10.1016/j.jacc.2010.11.018. [DOI] [PubMed] [Google Scholar]
- 5.Nordin S, Kozor R, Bulluck H, Castelletti S, Rosmini S, Abdel-Gadir A, Baig S, Mehta A, Hughes D, Moon JC. Cardiac Fabry disease with late gadolinium enhancement is a chronic inflammatory cardiomyopathy. J Am Coll Cardiol. 2016;68:1707–1708. doi: 10.1016/j.jacc.2016.07.741. doi: 10.1016/j.jacc.2016.07.741. [DOI] [PubMed] [Google Scholar]
- 6.Desnick RJ, Brady R, Barranger J, Collins AJ, Germain DP, Goldman M, Grabowski G, Packman S, Wilcox WR. Fabry disease, an under-recognized multisystemic disorder: expert recommendations for diagnosis, management, and enzyme replacement therapy. Ann Intern Med. 2003;138:338–346. doi: 10.7326/0003-4819-138-4-200302180-00014. [DOI] [PubMed] [Google Scholar]
- 7.Germain DP, Hughes DA, Nicholls K, Bichet DG, Giugliani R, Wilcox WR, Feliciani C, Shankar SP, Ezgu F, Amartino H, Bratkovic D, Feldt-Rasmussen U, Nedd K, Sharaf El Din U, Lourenco CM, Banikazemi M, Charrow J, Dasouki M, Finegold D, Giraldo P, Goker-Alpan O, Longo N, Scott CR, Torra R, Tuffaha A, Jovanovic A, Waldek S, Packman S, Ludington E, Viereck C, Kirk J, Yu J, Benjamin ER, Johnson F, Lockhart DJ, Skuban N, Castelli J, Barth J, Barlow C, Schiffmann R. Treatment of Fabry’s disease with the pharmacologic chaperone migalastat. N Engl J Med. 2016;375:545–555. doi: 10.1056/NEJMoa1510198. doi: 10.1056/NEJMoa1510198. [DOI] [PubMed] [Google Scholar]
- 8.Weidemann F, Niemann M, Breunig F, Herrmann S, Beer M, Störk S, Voelker W, Ertl G, Wanner C, Strotmann J. Long-term effects of enzyme replacement therapy on Fabry cardiomyopathy: evidence for a better outcome with early treatment. Circulation. 2009;119:524–529. doi: 10.1161/CIRCULATIONAHA.108.794529. doi: 10.1161/CIRCULATIONAHA.108.794529. [DOI] [PubMed] [Google Scholar]
- 9.Brakch N, Dormond O, Bekri S, Golshayan D, Correvon M, Mazzolai L, Steinmann B, Barbey F. Evidence for a role of sphingosine-1 phosphate in cardiovascular remodelling in Fabry disease. Eur Heart J. 2010;31:67–76. doi: 10.1093/eurheartj/ehp387. doi: 10.1093/eurheartj/ehp387. [DOI] [PubMed] [Google Scholar]
- 10.Moon JC, Sachdev B, Elkington AG, McKenna WJ, Mehta A, Pennell DJ, Leed PJ, Elliott PM. Gadolinium enhanced cardiovascular magnetic resonance in Anderson-Fabry disease. Evidence for a disease specific abnormality of the myocardial interstitium. Eur Heart J. 2003;24:2151–2155. doi: 10.1016/j.ehj.2003.09.017. [DOI] [PubMed] [Google Scholar]
- 11.Moon JC, Sheppard M, Reed E, Lee P, Elliott PM, Pennell DJ. The histological basis of late gadolinium enhancement cardiovascular magnetic resonance in a patient with Anderson-Fabry disease. J Cardiovasc Magn Reson. 2006;8:479–482. doi: 10.1080/10976640600605002. [DOI] [PubMed] [Google Scholar]
- 12.Krämer J, Niemann M, Störk S, Frantz S, Beer M, Ertl G, Wanner C, Weidemann F. Relation of burden of myocardial fibrosis to malignant ventricular arrhythmias and outcomes in Fabry disease. Am J Cardiol. 2014;114:895–900. doi: 10.1016/j.amjcard.2014.06.019. doi: 10.1016/j.amjcard.2014.06.019. [DOI] [PubMed] [Google Scholar]
- 13.Kozor R, Grieve SM, Tchan MC, Callaghan F, Hamilton-Craig C, Denaro C, Moon JC, Figtree GA. Cardiac involvement in genotype-positive Fabry disease patients assessed by cardiovascular MR. Heart. 2016;102:298–302. doi: 10.1136/heartjnl-2015-308494. doi: 10.1136/heartjnl-2015-308494. [DOI] [PubMed] [Google Scholar]
- 14.Niemann M, Herrmann S, Hu K, Breunig F, Strotmann J, Beer M, Machann W, Voelker W, Ertl G, Wanner C, Weidemann F. Differences in Fabry cardiomyopathy between female and male patients: consequences for diagnostic assessment. JACC Cardiovasc Imaging. 2011;4:592–601. doi: 10.1016/j.jcmg.2011.01.020. doi: 10.1016/j.jcmg.2011.01.020. [DOI] [PubMed] [Google Scholar]
- 15.Pica S, Sado DM, Maestrini V, Fontana M, White SK, Treibel T, Captur G, Anderson S, Piechnik SK, Robson MD, Lachmann RH, Murphy E, Mehta A, Hughes D, Kellman P, Elliott PM, Herrey AS, Moon JC. Reproducibility of native myocardial T1 mapping in the assessment of Fabry disease and its role in early detection of cardiac involvement by cardiovascular magnetic resonance. J Cardiovasc Magn Reson. 2014;16:99. doi: 10.1186/s12968-014-0099-4. doi: 10.1186/s12968-014-0099-4. [DOI] [PMC free article] [PubMed] [Google Scholar]
- 16.Thompson RB, Chow K, Khan A, Chan A, Shanks M, Paterson I, Oudit GY. T1 mapping with cardiovascular MRI is highly sensitive for Fabry disease independent of hypertrophy and sex. Circ Cardiovasc Imaging. 2013;6:637–645. doi: 10.1161/CIRCIMAGING.113.000482. doi: 10.1161/CIRCIMAGING.113.000482. [DOI] [PubMed] [Google Scholar]
- 17.Sado DM, White SK, Piechnik SK, Banypersad SM, Treibel T, Captur G, Fontana M, Maestrini V, Flett AS, Robson MD, Lachmann RH, Murphy E, Mehta A, Hughes D, Neubauer S, Elliott PM, Moon JC. Identification and assessment of Anderson-Fabry disease by cardiovascular magnetic resonance noncontrast myocardial T1 mapping. Circ Cardiovasc Imaging. 2013;6:392–398. doi: 10.1161/CIRCIMAGING.112.000070. doi: 10.1161/CIRCIMAGING.112.000070. [DOI] [PubMed] [Google Scholar]
- 18.Havranek S, Linhart A, Urbanova Z, Ramaswami U. Early cardiac changes in children with Anderson-Fabry disease. JIMD Rep. 2013;11:53–64. doi: 10.1007/8904_2013_222. doi: 10.1007/8904_2013_222. [DOI] [PMC free article] [PubMed] [Google Scholar]
- 19.Namdar M, Steffel J, Vidovic M, Brunckhorst CB, Holzmeister J, Lüscher TF, Jenni R, Duru F. Electrocardiographic changes in early recognition of Fabry disease. Heart. 2011;97:485–490. doi: 10.1136/hrt.2010.211789. doi: 10.1136/hrt.2010.211789. [DOI] [PubMed] [Google Scholar]
- 20.Coats CJ, Parisi V, Ramos M, Janagarajan K, O’Mahony C, Dawnay A, Lachmann RH, Murphy E, Mehta A, Hughes D, Elliott PM. Role of serum N-terminal pro-brain natriuretic peptide measurement in diagnosis of cardiac involvement in patients with Anderson-Fabry disease. Am J Cardiol. 2013;111:111–117. doi: 10.1016/j.amjcard.2012.08.055. doi: 10.1016/j.amjcard.2012.08.055. [DOI] [PubMed] [Google Scholar]
- 21.Tanislav C, Guenduez D, Liebetrau C, Giese AK, Eichler S, Sieweke N, Speth M, Bauer T, Hamm C, Rolfs A. Cardiac troponin I: a valuable biomarker indicating the cardiac involvement in Fabry disease. PLoS One. 2016;11:e0157640. doi: 10.1371/journal.pone.0157640. doi: 10.1371/journal.pone.0157640. [DOI] [PMC free article] [PubMed] [Google Scholar]
- 22.Captur G, Lopes LR, Mohun TJ, Patel V, Li C, Bassett P, Finocchiaro G, Ferreira VM, Esteban MT, Muthurangu V, Sherrid MV, Day SM, Canter CE, McKenna WJ, Seidman CE, Bluemke DA, Elliott PM, Ho CY, Moon JC. Prediction of sarcomere mutations in subclinical hypertrophic cardiomyopathy. Circ Cardiovasc Imaging. 2014;7:863–871. doi: 10.1161/CIRCIMAGING.114.002411. doi: 10.1161/CIRCIMAGING.114.002411. [DOI] [PMC free article] [PubMed] [Google Scholar]
- 23.Maceira AM, Prasad SK, Khan M, Pennell DJ. Normalized left ventricular systolic and diastolic function by steady state free precession cardiovascular magnetic resonance. J Cardiovasc Magn Reson. 2006;8:417–426. doi: 10.1080/10976640600572889. [DOI] [PubMed] [Google Scholar]
- 24.Moon JC, Messroghli DR, Kellman P, Piechnik SK, Robson MD, Ugander M, Gatehouse PD, Arai AE, Friedrich MG, Neubauer S, Schulz-Menger J, Schelbert EB Society for Cardiovascular Magnetic Resonance Imaging; Cardiovascular Magnetic Resonance Working Group of the European Society of Cardiology. Myocardial T1 mapping and extracellular volume quantification: a Society for Cardiovascular Magnetic Resonance (SCMR) and CMR Working Group of the European Society of Cardiology consensus statement. J Cardiovasc Magn Reson. 2013;15:92. doi: 10.1186/1532-429X-15-92. doi: 10.1186/1532-429X-15-92. [DOI] [PMC free article] [PubMed] [Google Scholar]
- 25.Captur G, Gatehouse P, Keenan KE, Heslinga FG, Bruehl R, Prothmann M, Graves MJ, Eames RJ, Torlasco C, Benedetti G, Donovan J, Ittermann B, Boubertakh R, Bathgate A, Royet C, Pang W, Nezafat R, Salerno M, Kellman P, Moon JC. A medical device-grade T1 and ECV phantom for global T1 mapping quality assurance-the T1 mapping and ECV standardization in cardiovascular magnetic resonance (T1MES) program. J Cardiovasc Magn Reson. 2016;18:58. doi: 10.1186/s12968-016-0280-z. doi: 10.1186/s12968-016-0280-z. [DOI] [PMC free article] [PubMed] [Google Scholar]
- 26.Kozor R, Nordin S, Treibel TA, Rosmini S, Castelletti S, Fontana M, Captur G, Baig S, Steeds RP, Hughes D, Manisty C, Grieve SM, Figtree GA, Moon JC. Insight into hypertrophied hearts: a cardiovascular magnetic resonance study of papillary muscle mass and T1 mapping. Eur Heart J Cardiovasc Imaging. 2017;18:1034–1040. doi: 10.1093/ehjci/jew187. doi: 10.1093/ehjci/jew187. [DOI] [PubMed] [Google Scholar]
- 27.Kozor R, Callaghan F, Tchan M, Hamilton-Craig C, Figtree GA, Grieve SM. A disproportionate contribution of papillary muscles and trabeculations to total left ventricular mass makes choice of cardiovascular magnetic resonance analysis technique critical in Fabry disease. J Cardiovasc Magn Reson. 2015;17:22. doi: 10.1186/s12968-015-0114-4. doi: 10.1186/s12968-015-0114-4. [DOI] [PMC free article] [PubMed] [Google Scholar]
- 28.Maron MS, Olivotto I, Harrigan C, Appelbaum E, Gibson CM, Lesser JR, Haas TS, Udelson JE, Manning WJ, Maron BJ. Mitral valve abnormalities identified by cardiovascular magnetic resonance represent a primary phenotypic expression of hypertrophic cardiomyopathy. Circulation. 2011;124:40–47. doi: 10.1161/CIRCULATIONAHA.110.985812. doi: 10.1161/CIRCULATIONAHA.110.985812. [DOI] [PubMed] [Google Scholar]
- 29.Captur G, Radenkovic D, Li C, Liu Y, Aung N, Zemrak F, Tobon-Gomez C, Gao X, Elliott PM, Petersen SE, Bluemke DA, Friedrich MG, Moon JC. Community delivery of semiautomated fractal analysis tool in cardiac MR for trabecular phenotyping. J Magn Reson Imaging. 2017;46:1082–1088. doi: 10.1002/jmri.25644. doi: 10.1002/jmri.25644. [DOI] [PubMed] [Google Scholar]
- 30.Patel V, O’Mahony C, Hughes D, Rahman MS, Coats C, Murphy E, Lachmann R, Mehta A, Elliott PM. Clinical and genetic predictors of major cardiac events in patients with Anderson-Fabry Disease. Heart. 2015;101:961–966. doi: 10.1136/heartjnl-2014-306782. doi: 10.1136/heartjnl-2014-306782. [DOI] [PubMed] [Google Scholar]
- 31.Weidemann F, Niemann M, Störk S, Breunig F, Beer M, Sommer C, Herrmann S, Ertl G, Wanner C. Long-term outcome of enzyme-replacement therapy in advanced Fabry disease: evidence for disease progression towards serious complications. J Intern Med. 2013;274:331–341. doi: 10.1111/joim.12077. doi: 10.1111/joim.12077. [DOI] [PMC free article] [PubMed] [Google Scholar]
- 32.Captur G, Ho CY, Schlossarek S, Kerwin J, Mirabel M, Wilson R, Rosmini S, Obianyo C, Reant P, Bassett P, Cook AC, Lindsay S, McKenna WJ, Mills K, Elliott PM, Mohun TJ, Carrier L, Moon JC. The embryological basis of subclinical hypertrophic cardiomyopathy. Sci Rep. 2016;6:27714. doi: 10.1038/srep27714. doi: 10.1038/srep27714. [DOI] [PMC free article] [PubMed] [Google Scholar]
- 33.Schmied C, Nowak A, Gruner C, Olinger E, Debaix H, Brauchlin A, Frank M, Reidt S, Monney P, Barbey F, Shah D, Namdar M. The value of ECG parameters as markers of treatment response in Fabry cardiomyopathy. Heart. 2016;102:1309–1314. doi: 10.1136/heartjnl-2015-308897. doi: 10.1136/heartjnl-2015-308897. [DOI] [PubMed] [Google Scholar]
- 34.Aryana A, Fifer MA, Ruskin JN, Mela T. Short PR interval in the absence of preexcitation: a characteristic finding in a patient with Fabry disease. Pacing Clin Electrophysiol. 2008;31:782–783. doi: 10.1111/j.1540-8159.2008.01088.x. doi: 10.1111/j.1540-8159.2008.01088.x. [DOI] [PubMed] [Google Scholar]
- 35.Jastrzebski M, Bacior B, Dimitrow PP, Kawecka-Jaszcz K. Electrophysiological study in a patient with Fabry disease and a short PQ interval. Europace. 2006;8:1045–1047. doi: 10.1093/europace/eul121. doi: 10.1093/europace/eul121. [DOI] [PubMed] [Google Scholar]
- 36.O’Mahony C, Coats C, Cardona M, Garcia A, Calcagnino M, Murphy E, Lachmann R, Mehta A, Hughes D, Elliott PM. Incidence and predictors of anti-bradycardia pacing in patients with Anderson-Fabry disease. Europace. 2011;13:1781–1788. doi: 10.1093/europace/eur267. doi: 10.1093/europace/eur267. [DOI] [PubMed] [Google Scholar]
- 37.Pochis WT, Litzow JT, King BG, Kenny D. Electrophysiologic findings in Fabry’s disease with a short PR interval. Am J Cardiol. 1994;74:203–204. doi: 10.1016/0002-9149(94)90106-6. [DOI] [PubMed] [Google Scholar]
- 38.Ikari Y, Kuwako K, Yamaguchi T. Fabry’s disease with complete atrioventricular block: histological evidence of involvement of the conduction system. Br Heart J. 1992;68:323–325. doi: 10.1136/hrt.68.9.323. [DOI] [PMC free article] [PubMed] [Google Scholar]
- 39.Sheppard MN, Cane P, Florio R, Kavantzas N, Close L, Shah J, Lee P, Elliott P. A detailed pathologic examination of heart tissue from three older patients with Anderson-Fabry disease on enzyme replacement therapy. Cardiovasc Pathol. 2010;19:293–301. doi: 10.1016/j.carpath.2009.05.003. doi: 10.1016/j.carpath.2009.05.003. [DOI] [PubMed] [Google Scholar]
- 40.Linhart A, Elliott PM. The heart in Anderson-Fabry disease and other lysosomal storage disorders. Heart. 2007;93:528–535. doi: 10.1136/hrt.2005.063818. doi: 10.1136/hrt.2005.063818. [DOI] [PMC free article] [PubMed] [Google Scholar]
- 41.Hughes DA, Elliott PM, Shah J, Zuckerman J, Coghlan G, Brookes J, Mehta AB. Effects of enzyme replacement therapy on the cardiomyopathy of Anderson-Fabry disease: a randomised, double-blind, placebo-controlled clinical trial of agalsidase alfa. Heart. 2008;94:153–158. doi: 10.1136/hrt.2006.104026. doi: 10.1136/hrt.2006.104026. [DOI] [PubMed] [Google Scholar]


