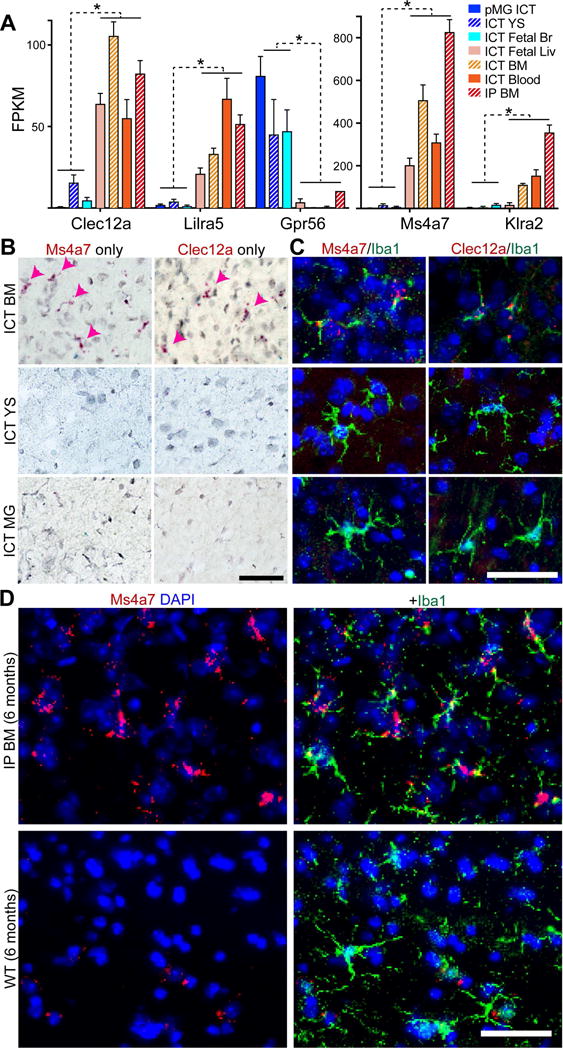
Figure 6. Ontogeny markers discriminate HSC- from YS-MLCs and microglia.

A) FPKM values for HSC- and YS-MLC/MG enriched genes (red-orange and blue bars, respectively). Error bars represent SEM, FDR < 0.005 for all genes between YS/MG and HSC groups. B) RNA in situ hybridization showing expression of Ms4a7 or Clec12a (red) in ICT BM- but not YS-MLCs nor ICT MGs. Arrowheads highlight BM-MLCs. Scale bar = 50μm. C) Fluorescent RNA in situ hybridization showing expression of Ms4a7 or Clec12a (red) in ICT BM- but not YS-MLCs nor ICT MGs, co-stained for IBA1 (green). Scale bar = 50μm. D) RNA in situs show persistent expression of Ms4a7 (red) in IBA1+ cells (green) six months after transplantation in HSC-MLCs, but no expression in WT microglia. Scale bar = 50μm. See also Figure S5, 6.
