

Summary
Protein/RNA clusters arise frequently in spatially-regulated biological processes, from the asymmetric distribution of P granules and PAR proteins in developing embryos to localized receptor oligomers in migratory cells. This co-occurrence suggests that protein clusters might possess intrinsic properties that make them a useful substrate for spatial regulation. Here, we demonstrate that protein droplets show a robust form of spatial memory, maintaining the spatial pattern of an inhibitor of droplet formation long after it has been removed. Despite this persistence, droplets can be highly dynamic, continuously exchanging monomers with the diffuse phase. We investigate the principles of biophysical spatial memory in three contexts: a computational model of phase separation; a novel optogenetic system where light can drive rapid, localized dissociation of liquid-like protein droplets; and membrane-localized signal transduction from clusters of receptor tyrosine kinases. Our results suggest that the persistent polarization underlying many cellular and developmental processes could arise through a simple biophysical process, without any additional biochemical feedback loops.
ETOC Blurb
Dine et al use mathematical modeling and cellular optogenetics to determine that phase-separated protein clusters act as a long-lived ‘memory foam’ that can retain spatial patterns in cells.
Introduction
Across many biological contexts, cells must be able to sense external spatial cues and generate asymmetric distributions of their internal components. Anisotropic patterns of protein/RNA localization play crucial roles during embryo development (Kloc and Etkin, 2005; Sailer et al., 2015), and motile cells can migrate by generating persistent internal asymmetries even in a uniform environment (Prentice-Mott et al., 2016). It is often assumed that both the establishment and maintenance of these persistent spatial patterns require complex genetic and/or biochemical networks, such as Turing-like mechanisms that combine short-range positive feedback with long-range negative feedback (Gierer and Meinhardt, 1972; Turing, 1953) or stochastic processes that rely on depleting a limiting pool of proteins that participate in an auto-regulatory positive feedback loop (Altschuler et al., 2008).
Many spatially-regulated biological processes also exhibit hallmarks of protein phase separation, a process where multivalent interactions between monomers drive large-scale assembly into liquid-like droplets or solid aggregates (Figure 1A). Developmental processes rely on localized RNA and/or protein aggregation, including the asymmetric partitioning of PAR proteins (Goldstein and Macara, 2007), RNA granules in Drosophila embryogenesis (Forrest and Gavis, 2003), and P granules that dissolve and condense along the anterior-posterior axis of C. elegans embryos to be inherited by cells that form the germline (Brangwynne et al., 2009). Similar principles may also underlie spatially-restricted signaling in differentiated cells. Localized clustering of membrane receptors is thought to promote actin nucleation during cell migration (Banjade and Rosen, 2014), local clustering of signaling proteins was recently shown to enhance signaling downstream of T cell receptor activation at the immunological synapse (Su et al., 2016), and receptor clustering in neurons is thought to play a role in regulating synaptic plasticity (O’Brien et al., 1998). In many of the above examples, clustering is primarily thought of as playing a biochemical role: segregating proteins away from undesired interaction partners or increasing reaction rates between components that are co-localized within the separated phase (Shin and Brangwynne, 2017).
Figure 1. A mathematical model predicts long-term spatial memory from phase separation.

(a) Asymmetric protein clustering occurs as part of polarized intracellular processes. (b) Schematic of simulated experiment where clusters are locally dissolved by a transient stimulus. (c) Still frames from simulation demonstrating the response to the stimulus in b. (d,e) Quantification of the total number of particles (d) and mean cluster size (e) in the stimulated and unstimulated regions during all three stimulation time periods. Mean ± SEM are shown from five independent runs. (f) A simulated photobleaching experiment demonstrates rapid exchange of monomers in and out of clusters. Mean ± SEM for 10 clusters is shown. (g) Modeling suggests that transient, local stimuli can drive persistent asymmetries of dynamic, liquid-like granules. See also Figure S1 and Movies S1–S3.
Here, we set out to investigate whether protein phase separation might directly contribute to the establishment or maintenance of spatial patterns within the cell. Using a combination of mathematical modeling and optogenetic stimulus experiments, we found that liquid-like protein droplets exhibit a form of long-term spatial memory. A cluster-dissociating stimulus that is delivered on one side of a cell can drive asymmetric patterns of protein localization in minutes, and these patterns persist for hours after the stimulus is removed. These results hold even in cases where droplets are highly dynamic and exchange substituents with the surrounding diffuse phase. We find that this spatial memory is robust, occurring in all three subcellular compartments tested (cytosol, nucleus, and plasma membrane) and with both optogenetic systems we employ. Finally, we show that this spatial memory can have functional implications using light-controllable FGF receptors whose phase separation drives a cytoskeletal response. Our results demonstrate that the biophysical phenomenon of protein clustering can function as a sensitive intracellular ‘memory foam’, amplifying transient, shallow gradients into sharp and persistent responses.
Results
A minimal model to dissect the role of clustering in spatial patterning
To gain some initial intuition about how phase separation might influence spatial patterning, we constructed a simple computational model of protein diffusion and clustering in two dimensions (Figure S1A; STAR Methods) (Freeman Rosenzweig et al., 2017; Landau and Binder, 2014). Our model consists of a 50 × 100 unit grid where each square can be occupied by a single ‘monomer’ that is free to diffuse to adjacent unoccupied positions or exchange positions with a monomer in a neighboring occupied square. To model protein phase separation and aggregation, monomers occupying adjacent squares exhibit affinity for one another, leading to a decreased probability of movement to squares that require bond breakage. We used a temperature-like stimulus parameter θ to control the strength of binding; θ can be raised or lowered at any spatial position on the grid and at any time. Simulating the model for different values of θ revealed that it could reproduce classic properties of phase separation, including a single diffuse phase at high θ, coexistence of dynamic, liquid-like droplets and a diffuse phase at intermediate values of θ, and arrested dynamics for low θ (Movie S1; Figure S1B–D). Local stimulation could also drive local phase separation: decreasing θ on one half of the grid induced the appearance of local clusters that were quickly reversed when θ was returned to its initial value (Figure S1E–H).
Even this simple model could generate complex behavior when subjected to certain classes of spatial stimuli. One illustrative example is the converse of the local stimulus experiment described above: starting from an initial state where droplets appear throughout the grid, we locally increased θ to induce droplet disassembly in a stimulated region (Figure 1B,C; Movie S2). This local stimulation led to the rapid dissolution of droplets in the stimulated area and nucleation/growth of droplets in the unstimulated region. However, after stimulus removal, the system did not return to its initial state but instead retained an asymmetric spatial distribution of clusters. This persistent asymmetry could also be quantitatively captured in both the distribution of the total number of particles and the mean cluster sizes in the stimulated and unstimulated regions (Figure 1D,E). Persistent asymmetry still arose even under liquid-like conditions where clusters are dynamic. Performing a computational FRAP experiment after a transient, local stimulus revealed that monomers were exchanged rapidly between the clusters and the diffuse phase, even as the overall asymmetric spatial distribution of clusters was unchanged (Figure 1F; STAR Methods).
Our simple model thus suggests that in the case of stimulus-induced dissociation of protein clusters, long-term spatial patterns can persist long after stimulus removal. This phenomenon arises from the well-characterized physics of droplet phase behavior (Doi, 2013; Lifshitz and Slyozov, 1961; Wagner, 1961). When droplets are dissolved by a local stimulus the concentration of monomers in that region rises, leading to a diffusive flux toward the unstimulated region, condensation into droplets there, and a return of the free monomer concentration to near its pre-stimulus level. Upon stimulus removal, however, there is no driving force for the asymmetrically-distributed droplets to shrink and small ones to grow in the formerly-stimulated region. Rather, large droplets are more stable than small ones; over infinite time, Ostwald ripening and droplet coalescence are expected to lead to a single large droplet, properties that are captured in long-timescale simulations of our model (Movie S3; STAR Methods).
What parameters govern the timescale with which a spatial pattern persists? In our simulations, patterns were effectively permanent after stimulus removal. However, our model does not for the movement of entire droplets by diffusion, intracellular flow, or active transport. Each of these processes may be expected to blur spatial patterns over time but their relative magnitudes are difficult to predict from first principles and may vary between cellular contexts. Nevertheless, the behavior we observe could have profound implications for a cell: a transient, locally-applied stimulus could result in a long-term asymmetry in the spatial distribution of protein/RNA droplets, even when individual monomers are able to exchange rapidly in and out of the concentrated phase to interact with other cellular factors (Figure 1G).
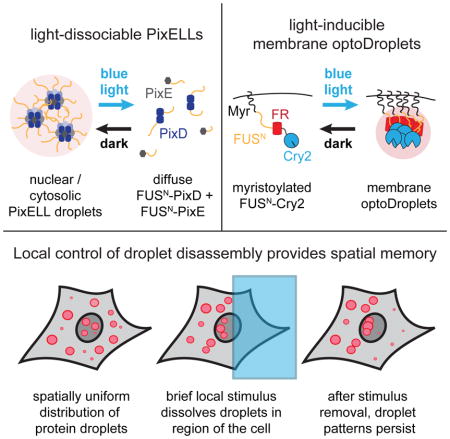
PixELLs: optogenetic control over dissociation of liquid-like protein droplets
Our model suggests that stimulus-dissociated clusters can exhibit long-term spatial memory, but how relevant is this phenomenon at the length- and time-scales of the cell? To address this question, we sought to develop an experimental system to match our modeled scenario: namely, where local stimulation could be used to induce dissociation of protein droplets that assemble spontaneously in the dark. Optogenetic control is ideal for such a study because precise spatial light stimuli can be readily applied and removed. Also, we recently demonstrated that protein phase separation is amenable to optogenetic control by fusing an intrinsically disordered protein region (IDR) to the Cry2 photolyase homology region (PHR) to create OptoDroplets (Shin et al., 2017). In response to light, Cry2 oligomerization nucleates IDR-containing clusters that, over seconds—minutes, grow into micron-scale, liquid-like droplets.
As a starting point for developing an inverse system that confers optogenetic control over droplet dissociation, we turned to two proteins, PixD and PixE, from Synechocystis sp. PCC6803 (Masuda et al., 2004; Yuan and Bauer, 2008). PixD and PixE associate in the dark into large multi-subunit complexes (thought to exhibit 10:4 or 10:5 PixD:PixE stoichiometry) that dissociate into dimers of PixD and monomers of PixE within seconds upon blue light stimulation. Upon a shift back to darkness, PixD cycles back to its binding-competent state within seconds to re-form complexes. We reasoned that fusing PixD and PixE to intrinsically disordered protein regions (IDRs) might enable the nucleation of phase-separated droplets in the dark, and that light stimulation might induce the rapid dissociation of these complexes (Figure 2A,B; Figure S2).
Figure 2. Developing an optogenetic system for spatial control over liquid droplet disassembly.

(a) Constructs used to create the PixELL optogenetic system and (b) schematic of blue light-dissociable intracellular droplets. (c) Representative images of intracellular clusters before and after 450 nm light-induced dissociation. (d) Quantification of photoswitchable clustering during 5 cycles of dissociation and aggregation. Mean ± SEM are shown for 8 representative cells. Images from c are shown as insets to relate intracellular droplet patterns to SNR quantification. (e) Visualization of two PixELL droplet fusion events. (f) Droplet intensity during FRAP experiments indicating photobleaching at t=0 and recovery over 10 min. Mean ± SEM are shown for 5 cells, normalized to initial intensity. See also Figures S2–S3 and Movies S4–S5.
Indeed, we found that expressing fluorescent FUSN-FusionRed-PixD and FUSN-Citrine-PixE proteins in NIH3T3 cells led to the formation of micrometer-sized spherical clusters in the dark which dissociated in seconds after blue light stimulation (Figure 2C). Light-controlled clustering was also fully reversible across multiple cycles of photostimulation (Figure 2D; Movie S4). PixD/PixE clusters exhibited hallmarks of phase separation into liquid-like droplets, including droplet fusion, shape relaxation, and recovery after photobleaching within minutes, similar to other liquid-like droplets (Shin et al., 2017) (Figure 2E,F; Movie S5). We termed these light-dissociable clusters PixELLs (Pix Evaporates from Liquid-like droplets in Light). In addition to defining the emergent spatiotemporal features of protein phase separation in cells, we expect the PixELL system could serve as a useful optogenetic tool for long-term concentration of proteins into synthetic membraneless organelles (Nakamura et al., 2017; Taslimi et al., 2014) or to sequester and release proteins of interest from subcellular compartments (Figure S3).
PixELLs exhibit spatial memory and convert shallow gradients into sharp boundaries
To test if the spatial distribution of PixELLs could encode long-term memory of transient stimuli, we applied and removed a blue light stimulus to subcellular regions of PixELL-expressing cells (Figure 3A; Movie S6). Light exposure induced seconds-timescale dissociation of droplets within the stimulated region, followed by droplet nucleation and growth in unstimulated regions within 10 minutes. Consistent with our model, cells maintained an asymmetric distribution of PixELLs after light stimulus removal, with a sharp boundary between the previously-stimulated and unstimulated cytosolic regions. This persistent asymmetry was evident in both the overall PixELL protein concentration and in the fluorescence intensity of individual droplets (Figure 3B–C). We hypothesized that spatial patterns might be even more striking in subcellular regions where droplet diffusion is slower, such as within the nucleus (Kuhn et al., 2011; Bosse et al., 2015). Indeed, illuminating the entirety of the cell except for a protected nuclear region enabled us to “draw” precise spatial patterns of droplets in the nucleus that remained for hours after the shift back to darkness, even as the nucleus rotated and moved within the cell (Figure 3D, Movie S6). For both nuclear and cytosolic clusters, asymmetric protein distributions are established within 5–10 min and persist for at least 100 min after the stimulus is removed (Figure S4).
Figure 3. PixELLs exhibit long-term spatial memory of transient stimuli.

(a) Schematic and images of spatially-restricted 450 nm light stimulation. Fluorescent images of FUSN-FusionRed-PixD are shown for cells before, during and after stimulation. (b) Cytoplasmic intensity in regions inside and outside the stimulation mask for 4 cells. Mean ± SEM are shown. (c) Mean cluster size for the cell in a, averaged across 5 clusters inside and outside the stimulation area. (d) Still images showing long-term memory of a nucleus-localized light stimulus. See also Figure S4 and Movie S6.
We reasoned that PixELLs would also be ideal to test for a second form of spatial information processing: the amplification of a shallow stimulus gradient into a sharp boundary of protein droplets. As is familiar from the of water crossing its freezing point to form ice, phase separation is an inherently all-or-none phenomenon, with the potential to exhibit dramatic physical responses to a small change in an external stimulus (e.g. temperature). Prior theoretical results suggest that this all-or-none effect could also be observed for spatial patterns of intracellular phase separation, where a shallow gradient of a droplet-dissociating stimulus might be converted into a sharp spatial boundary (Lee et al., 2013). Such a scenario is thought to describe P granule dynamics in C. elegans embryos (Brangwynne et al., 2009). To test this prediction, we applied a linear gradient of 450 nm light intensity to individual PixELL-expressing cells. Indeed, this light gradient induced a sharp boundary of intracellular droplets, converting a shallow stimulus into a switch-like response (Figure 4A–C; Movie S7). This spatial pattern was also retained after stimulus removal, demonstrating both gradient amplification and long-term spatial memory in a single experimental context (Figure 4B). Our results thus demonstrate that phase separation is a powerful and versatile way to convert transient, weak biochemical signals into long-lasting spatial patterns in cells.
Figure 4. PixELLs amplify shallow stimulus gradients into all-or-none spatial patterns of droplets.

(a) Gradient stimulation of a PixELL-expressing NIH3T3 cell. Fluorescent images of FUSN-FusionRed-PixD are shown for a representative cell stimulated with a linear gradient of light intensity. (b) Kymograph of maximum FUSN-FusionRed-PixD fluorescence within each row of the yellow box from a (right), and median blue light intensity measured within the yellow box from a (left). (c) Quantification of the kymograph in b at 35 min, after spatial light pattern is established. A gradual decrease in 450 nm intensity (top panel; blue curve) elicits a sharp, switch-like transition to form bright FUSN-FR-PixD droplets (bottom panel; red curve). See also Movie S7.
Membrane-localized optoDroplets also exhibit spatial memory
Our work thus far leaves two important questions unanswered. First, how robust are these phenomena –are they highly dependent on a specific optogenetic tool or cellular context? Second, can the asymmetries in droplet distributions be transmitted to downstream signaling processes to regulate localized cell responses? To address these questions, we set out to probe spatial memory in a distinct and biologically-important context: the membrane-localized signaling clusters formed by activated receptor tyrosine kinases (RTKs). RTKs have been shown to undergo large-scale clustering upon stimulation (van Lengerich et al., 2017) and are often used by cells to drive localized, subcellular responses to external cues (Friedl and Gilmour, 2009). Moreover, optogenetic variants of FGFR1 have been previously shown to drive Erk signaling, cytoskeletal rearrangement and directed migration (Grusch et al., 2014; Kim et al., 2014).
We first sought to adapt our optoDroplets or PixELL system to the plasma membrane to enable control over receptor activity. We found that PixELLs failed to cluster after fusion to an N-terminal myristoylation tag, yet Myr-optoDroplets exhibited robust, light-dependent membrane clustering with a high degree of spatial control (Figure 5A). Local light stimulation of Myr-optoDroplet-expressing cells drove membrane protein clustering only within the illuminated region, and which disassembled within minutes in the dark, consistent with the minutes-timescale half-life of the Cry2 photoactivated state (Figure 5B–C; Movie S8). We noticed that some Myr-optoDroplets exhibited fast, directional motion within the membrane, suggesting active transport along some cytoskeletal components. This directional movement was abolished by treatment with nocodazole but not latrunculin A or a carrier control, suggesting that it is microtubule-dependent (Movie S9). Nevertheless, despite this active transport, the majority of optoDroplets remain localized to the illuminated region over time.
Figure 5. Membrane-localized optoDroplets retain spatial memory of transient stimuli.

(a) Schematic of Myr-optoDroplet construct and mode of activation. (b) Still images of Myr-FUSN-FusionRed-Cry2 for a cell exposed to a transient, local 450 nm stimulus. (c) Quantification of total intensity for membrane regions inside and outside the stimulus mask, respectively. Mean ± SEM are shown for 3 cells. (d) Schematic and still images of Myr-FUSN-FusionRed-Cry2 localization in the membrane plane for a cell exposed to a local 450 nm stimulus (dashed blue box) followed by global 450 nm illumination. (e) Quantification of total intensity in membrane regions inside and outside the stimulus mask, respectively. Mean ± SEM are shown for 3 cells. See also Movies S8–S9.
We next sought to test if membrane clustering might also exhibit the hallmarks of long-term biophysical memory. However, unlike PixELLs, optoDroplet clustering is induced rather than dissociated by light. We have shown that spatial memory requires a cluster-dissociating stimulus, necessitating the use of a new stimulus protocol to test for memory. We reasoned that light-induced clustering could trigger memory formation if an initially local stimulus were then expanded to a global stimulus, a scenario where the unilluminated region is thus treated as the localized cluster-dissociating stimulus that is removed upon the shift to global illumination. Such a “local-to-global” stimulus protocol resembles the transition of a migrating cell from a chemoattractant gradient to a high uniform source; in this scenario it may well be advantageous for the cell to preserve memory of the most recent spatial gradient it encountered (Prentice-Mott et al., 2016).
Indeed, we found that this local-to-global stimulus protocol was able to maintain a local pattern of membrane Myr-optoDroplets for at least 1 h after a shift to global illumination (Figure 5D,E; Movie S8). Local illumination induced clustering within 5–10 min, decreasing the membrane optoDroplet concentration at un-illuminated positions and preventing cluster formation at these positions after the shift to global illumination. Taken together, our data demonstrates that spatial memory is robust, operating with similar kinetics in three distinct subcellular compartments (the cytosol, the nucleus and the plasma membrane) and with two optogenetic systems (PixD/PixE-based PixELLs and Cry2-based Myr-optoDroplets).
FGFR1 droplets can harness spatial memory to drive asymmetric cytoskeletal responses
We finally set out to probe whether the long-term memory encoded in spatial distribution of clusters could be functionally coupled to cell behavior. We first adapted our Myr-optoDroplet construct by fusing it to the cytoplasmic domain of the FGFR1 receptor to create the FGFR1-optoDroplet system (Figure 6A). We observed weaker but qualitatively-similar clustering in FGFR1-optoDroplet cells as compared to Myr-optoDroplets. The smaller size of FGFR1-optoDroplet clusters might be a result of FGFR1 phosphorylation of FUSN or Cry2, thereby altering these domains’ intrinsic capacity for oligomerization, or from recruitment of additional proteins that weaken optoDroplet association.
Figure 6. Liquid phase separation drives spatial memory in RTK signaling.

(a) Schematic showing FGFR1-optoDroplets for inducing RTK clustering and downstream signaling. (b) FGFR1-optoDroplet cells reversibly “cringe” in response to global blue light stimulation. (c) Quantification of change in cell surface area for cell pictured in b. (d) FGFR1-optoDroplet cells retract in response to light, ‘avoiding’ a local light stimulus. (e) FGFR1-optoDroplet cells exhibit persistent local clustering and cytoskeletal contraction even after a switch to global illumination. (f) Quantification of cell surface area within the local-to-global illuminated region (blue box in e) and global-only illuminated region (remainder of cell in e) during local-to-global illumination. See also Figure S5 and Movies S10–S12.
We validated that FGFR1-optoDroplets were functional and able to drive potent, light-switchable signaling responses. Illumination led to potent and reversible Erk activation within minutes, as measured by the Erk activity biosensor, ErkKTR, which leaves the nucleus in response to Erk phosphorylation (Figure S5) (Regot et al., 2014). Illuminating FGFR1-optoDroplet cells also elicited a pronounced cytoskeletal response: global “cringing” of entire cells in response to uniform illumination that persisted as long as light was present and was quickly reversed in the dark (Figure 6B,C; Movie S10).
Spatial patterning and long-term memory were also evident in the subcellular distribution of FGFR1-optoDroplets and cytoskeletal activity. Local light stimulation also induced local cell contraction, leading to reorientation of cells to avoid blue light illumination (Figure 6D; Movie S11). In cells subjected to our local-to-global stimulus protocol, FGFR1-optoDroplets induced immediate retraction of the plasma membrane within the stimulated region that also persisted upon a subsequent switch to global illumination. Just as observed in the case of Myr-optoDroplets, FGFR1-optoDroplets were concentrated at the initial site of local activation and depleted elsewhere, thereby preventing additional receptor clustering after the shift to global illumination (Figure 6E,F; Movie S12). Notably, the region of the plasma membrane with FGFR1-optoDroplet clusters moved with the retracting protrusion, but a “corset” of contractility was retained on the cell at the same position as these clusters throughout this process. Our results thus show that the spatial memory encoded by protein clusters can be functionally coupled to receptor activation on the plasma membrane, an important spatially-localized cellular response.
Discussion
Our computational and experimental findings demonstrate that a simple biophysical system – liquid droplets whose interaction strength is controlled by a spatial stimulus – is sufficient to maintain asymmetric, polarized protein distributions in live cells. We also demonstrate that protein phase separation is sufficient to amplify weak spatial stimuli into all-or-none responses, a phenomenon that was previously predicted based on in vivo observations of P granule condensation. When considered together, these properties suggest a model where protein condensation plays the role of a sensitive ‘memory foam’. Even a weak, transient stimulus – or shallow stimulus gradient – can drive sharp boundaries of protein droplets that persist for an order of magnitude longer than they take to establish. The formation and dissociation of intracellular phase-separated structures thus constitutes a simple and universal mechanism for spatially regulating biological processes.
Although the underlying physics that governs phase separation is well understood, the scenario in living cells is complicated by additional physical processes (e.g. cytoplasmic flow; cytoskeletal assembly/disassembly) as well as potential biological regulation (e.g. directed transport or regulated assembly/disassembly of droplets). Indeed, we find that PixELLs are more mobile in the cytosol than the nucleus, suggesting differences in diffusion/flow between these compartments, whereas membrane optoDroplets are actively transported in a microtubule-dependent fashion. Nevertheless, the phenomenon of spatial memory is quite robust, operating within cells on 2-dimensional surfaces and in 3-dimensional subcellular compartments; it also operates similarly for light-sensitive structures that are generated by distinct photosensitive and oligomerization domains. Future studies should test whether spatial memories encoded by protein clusters might play similar roles in diverse cell types, organisms and developmental stages.
Our results are reminiscent of the hysteresis observed in classic bi-stable biological systems (Xiong and Ferrell, 2003) but arise through a distinct mechanism. They do not represent a stable steady state formed by the action of positive/negative biochemical feedback loops, as in the case of the spatial patterns that emerge spontaneously from a Turing reaction-diffusion system. Instead, they are rooted in a kinetically-trapped biophysical process: an asymmetric distribution of protein clusters that is unable to mix quickly by diffusion or proceed to the equilibrium of a single connected droplet. Nevertheless, sources of positive and negative feedback are intrinsic to phase separation: as clusters grow, they become more stable and grow still faster (a form of local positive feedback), leading to the depletion of free monomers from solution (a form of long-range negative feedback). It is tempting to speculate that protein phase separation might provide a simple and universal way to store spatial information in biological systems, providing a substrate on which to layer more complex biochemical circuits for establishing and maintaining spatial patterns.
STAR Methods
CONTACT FOR REAGENT AND RESOURCE SHARING
Further information and requests for resources and reagents should be directed to and will be fulfilled by the Lead Contact, Jared Toettcher, (toettcher@princeton.edu).
EXPERIMENTAL MODEL AND SUBJECT DETAILS
Cell culture
NIH 3T3 mouse embryonic fibroblasts and Lenti-X 293T cells were grown in DMEM supplemented with 10% FBS, 1% L-Glutamine, and Pen/Strep. Cells were maintained on Thermo Scientific Nunc Cell Culture Treated Flasks with Filter Caps and grown at 37 C with 5% CO2.
METHOD DETAILS
Plasmid Construction
All plasmids were constructed using inFusion cloning (Clontech) to ligate in a PCR product to a pHR vector that was opened using either backbone PCR or restriction digest. Plasmids were then transformed into Stellar Competent Cells for amplification and storage.
Lentivirus production and transduction
Lentivirus was produced as per the protocol we described previously (Toettcher et al., 2013). Briefly, Lenti-X 293T cells were plated in a 6-well plate at 40% confluency and co-transfected with the appropriate pHR expression plasmid and lentiviral packaging plasmids (pMD2.G and p8.91 – gifts from the Trono lab) using Fugene HD transfection reagent. Viral supernatants were collected 2 days after transfection and passed through a 0.45 mm filter.
NIH 3T3 cells to be infected with lentivirus were plated in a 6 well dish at 20%–40% confluency. After adherence to the plate, 500 μl of filtered virus were added to the cells as was 50 μl of 1M HEPES. 24 h post-infection, viral media was replaced with normal growth media and cells were imaged at least 48 h after infection to allow time for integration and expression.
Cell preparation for imaging
For all imaging experiments cells were plated on black-walled, 0.17 mm glass-bottomed 96 well plates (In Vitro Scientific). Prior to cell plating, glass was pretreated with a solution of 10 μg/mL fibronectin in phosphate buffer saline (PBS) for 20 min. NIH-3T3 cells were given at least 2 hours to adhere onto the glass-bottomed plates in our supplemented DMEM. Just prior to imaging 50 μL of mineral oil was added to the top of each well to stop evaporation (Toettcher et al., 2011).
Time-lapse microscopy
Cells were maintained at 37C with 5% CO2 for the duration of all imaging experiments. Confocal microscopy was performed on a Nikon Eclipse Ti microscope with a Prior linear motorized stage, a Yokogawa CSU-X1 spinning disk, an Agilent laser line module containing 405, 488, 561 and 650 nm lasers, an iXon DU897 EMCCD camera, and a 60X oil immersion objective lens.
Optogenetic stimulation hardware
For microscopy experiments, cells were imaged with the 561 nm laser to image FUSN-FusionRed-PixD in PixELL cell lines, and Myr-FUSN-FusionRed-Cry2 in the optoDroplet cell lines. A 450 nm LED light source (XCite XLED1) was used for all spatial blue light stimulation experiments of both the PixELL and optoDroplet systems, and either the same 450 nm LED light source or 488 nm laser illumination was used for all global experiments. Light from the XLED1 system was delivered through a Polygon400 digital micromirror device (DMD; Mightex Systems) to control the temporal dynamics of light inputs. We applied specific spatial patterns to an image by drawing ROIs within the Nikon Elements software package. To attenuate 450 nm light to appropriate levels, we dithered the DMD mirrors to apply light 10% of the time, and set our 450 nm LED to 5% of its maximum intensity.
For the long term stimulation of PixELLs shown in Figure S4 and for the Erk-KTR experiments shown in Figure S5, we stimulated multiple cell positions in the same acquisition, unlike in the earlier experiments, where single positions received constant blue light. Therefore, we had to increase the DMD and LED intensity so that cells received more intense light for a shorter period of time. To do so, we set the DMD mirrors set to a 50% duty cycle and LED power at 50% of maximum intensity.
For the gradient stimulation experiment in Figure 4, we used a “gradient ROI” in NIS-Elements that allowed a gradient of 0–10% of the light to pass through from top to bottom.
Finally, for the Myr- and FGFR1-optoDroplet experiments in Figure 5 and Figure 6, where light moved from a local to global pattern, we began the experiment using an ROI to illuminate the region of interest. After the spatial pattern of activation was established, we quickly paused the experiment to resize the ROI so that it would cover the whole field of view, thus switching to global stimulation for the remainder of the experiment.
FRAP experiments
FRAP experiments were performed in the Nikon Microscopy Core imaging facility at Princeton University on a point-scanning confocal (A1R-Si on a Nikon Ti-E microscope chassis). Bleaching was performed by applying 7.5% of the maximum power from our 561nm laser on a single cluster. We found that this light was powerful enough to photobleach FusionRed fluorescence but not sufficiently intense to induce optogenetic stimulation and PixELL dissociation. Images were captured pre- and post-bleach using confocal imaging with the 561 nm laser at 0.4% power.
Drug Additions
For cytoskeletal perturbation experiments, all drugs were reconstituted to 1 mg/ml concentrations in DMSO. For the experiments shown in Movie S8, DMSO was diluted to 0.5% in full media (representing the maximum final DMSO concentration used in any drug treatment), while Latrunculin A was diluted to 5μg/ml in full media and Nocodazole to 2.5μg/ml. 20μl of each solution were added to NIH-3T3 cells in a 100μl of full media in 96 well glass bottom plate 16hrs before imaging.
QUANTIFICATION AND STATISTICAL ANALYSIS
Obtaining properties of cellular regions
All image analysis was performed in ImageJ. First, appropriate nuclear or cytoplasmic regions were tracked over time by hand annotation. We then measured properties of each annotated region at each timepoint, including the mean and standard deviation of pixel intensities, the area of the region, and its integrated intensity (e.g. area * mean). For measuring overall protein redistribution we used the integrated intensity over large, equally-sized cytoplasmic areas inside and outside the stimulation region.
For measuring kinetics of droplet assembly/disassembly, we found that the signal to noise ratio (the inverse of the coefficient of variation) to be an excellent metric that spanned a reproducible range even for cells with different PixELL expression levels. The signal-to-noise ratio is defined as SNR = μ/σ, where μ is the pixel-by-pixel mean intensity within the region and σ is the standard deviation. In particular, we found that the coefficient of variation CV = σ/μ took on large values that could vary substantially between cells with a high degree of droplet formation (or even between different regions of the same cell); by inverting these large numbers, the signal-to-noise ratio compressed their differences and led to reproducible measurements of the kinetics of droplet formation. We thus used the SNR to describe the kinetics of droplet formation in Figure 2.
For some analyses (e.g. FRAP photobleaching recovery; cluster size over time) we analyzed the intensity of individual droplets over the course of a timelapse acquisition. In these cases, we annotated an individual cluster by hand using the ImageJ ‘measure’ tool. From there we developed a Matlab script that (a) identifies the XY location of the peak intensity in the annotated region at each frame of the time series, (b) fits a 2-dimensional Gaussian to the region , and (c) calculates the integrated area under the fit Gaussian as the burst intensity I = 2πac2.
Figure 6 shows measurements of the sizes of FGFR1-optoDroplet cells undergoing light-induced contraction. To perform these analyses we took advantage of the fluorescence of the optoDroplet construct, which permitted us to segment cells from background by simply applying a threshold. Noisy bright pixels were excluded by a binary opening operation, any dark pixels in the interior of the image were filled in by a morphological hole-filling operation, and finally any remaining noisy regions were excluded by keeping only the biggest connected component at each time point. We then measured the total cell footprint area by measuring the number of pixels in the binary mask at each time point, and converting to units of μm2 using the pixel-to-distance calibration of our microscope. For some analyses we further subdivided and tracked the cell footprint area in both the illuminated and non-illuminated regions.
Computational model
Description of the model
Our computational model was intended to capture the basics of diffusion, association and dissociation of self-associating “proteins” in a simple and minimal context, where proteins were modeled as single elements on a 2 dimensional grid. In our model, proteins move randomly across the grid. Upon occupying grid spaces with neighboring spaces that are also occupied, proteins experience identical binding interactions with each neighbor that decreases the probability of movement away from that position. Interactions are assumed to be maximally conservative: if a protein moves from one grid space to an adjoining one where some neighbors are shared, it is assumed that these binding interactions are not broken so they do not contribute to the penalty. For all simulations, we used a 50 × 100 grid with reflective boundary conditions that was populated by a random initial distribution of 700 proteins monomers.
We define a contiguous set of interacting proteins as a “cluster”. Such clusters may exhibit liquid-like or solid-like properties depending on the interaction strength and other system parameters.
Our system thus admits three kinds of processes with the following rates (also see Figure S1A):
Diffusion, modeled as movement of a protein from its position on the lattice to a neighboring, unoccupied position. Without loss of generality, we take the rate of diffusive movement as the reference timescale for our simulations, setting the rate constant d = 1 in all cases.
Exchange of proteins between two neighboring grid positions. This exchange reaction can also be thought of as diffusion within the clustered phase. We assume that exchange within the clustered phase is half as likely as diffusion to an empty position (i.e. e = 0.5). Because exchange involves movement of two proteins, halving this rate leads to a comparable timescale of overall protein movement within both phases.
Unbinding, modeled as the breaking of neighboring interactions upon movement away from a grid location. We assume that each protein-protein interaction contributes an interaction energy ΔE, so an unbinding reaction proceeds according to the rate constant , where nlost is the number of neighbors whose contacts are broken upon moving away from the prior grid position and θ(x, y, t) is a stimulus parameter that we can vary at each time point and grid position. The stimulus θ can be thought of as a temperature-like scaling factor on the interaction energy. For high values of θ, interactions are relatively weak and the system remains in a diffuse state. As θ is lowered, interaction energies become stronger and the system enters different forms of an aggregated state. The parameter k0 is a constant that is related to the off-rate for breaking a single interaction. For all simulations, we took ΔE = 1 (without loss of generality because the scale of θ(x, y, t) is set by our input) and k0 = 1 so that in the limit where no neighbors are lost, the rate of unbinding is identical to the rate of diffusion.
Simulating the model
We simulated random trajectories for this 2D diffusion/aggregation system using a rejection kinetic Monte Carlo approach (rKMC). rKMC is quite closely related to the Gillespie algorithm that is often used for stochastic chemical systems, and which provably achieves the same results (Serebrinsky, 2011). Rejection kinetic Monte Carlo is highly efficient and straightforward to implement for systems with many reactions under conditions where there is a well-defined “fastest” reaction rate (in our case, that of diffusion), and where a large number of the possible reactions in each configuration proceed at or near this fastest rate (in our case, diffusion and exchange are highly likely be picked, as only the particles at the interface between two phases can undergo unbinding).
In brief, the algorithm proceeds as follows. We pick a random protein on the lattice and random direction for it to move. Such a movement in any direction corresponds to one of the three reactions as defined above (diffusion, exchange or unbinding). If a reaction rate is equal to 1 (which is our fastest rate, and that of diffusion to an empty square), it is automatically accepted. Otherwise, a random number r3 is rolled on the interval [0,1) and the reaction is accepted in proportion to its rate (e.g. if its rate is greater than r3). After each iteration, the time t is incremented, so that ti = ti−1 + τ, where τ = 1/Nrxns log (1/r4). In this formula Nrxns is the total number of possible reactions in the system and r4 is a fourth random number on the interval [0,1).
Note that Nrxns can easily be defined because all possible reactions are uniquely identified with movement from an occupied lattice position to any adjoining lattice position. Thus, the total number of reactions is equal to the sum of all neighboring lattice positions for each occupied lattice position (for the reflective boundary conditions we implement, all middle lattice positions have 8 neighbors; all edge positions have 5; each corner has 3).
Analyzing spatial properties from simulations
To compute parameters of individual clusters (e.g. their size or solidity), we first identified all connected components at each simulation timepoint using the standard MATLAB image processing function bwconncomp. From this list of all connected components in the image we then computed various properties, including the area and solidity of each connected component. Area is useful as a straightforward measure of cluster size. Solidity is defined as the area of a cluster divided by the convex area in which it can be enclosed; it provides a measure of whether clusters are filled, as expected if they are able to relax to a shape that minimizes surface area. Additionally, for each spatial stimulus simulation we measured the total number of proteins in the stimulated and unstimulated regions.
Performing computational FRAP experiments
FRAP analysis was performed in the model by saving the X-Y position of each monomer, and by tracking a single chosen “cluster” over time from an initial time t0 after clusters were established. Fluorescence “recovery” was then associated with the number of monomers within the cluster that had been exchanged for monomers not initially present.
We first identified all the monomers in a chosen cluster by selecting a particular connected component for analysis. For every subsequent timepoint we tracked the cluster’s position on the 2D lattice using morphological reconstruction (implemented by the MATLAB function imreconstruct), where the cluster at the prior timepoint was taken as a marker image.
We computed two quantities at each timepoint: ni, the number of monomers in the cluster at the ith timepoint, and oi, the intersection between the initial set of monomers in the cluster and the set of monomers at the ith timepoint. We then measured the percent recovery using the formula:
In this formula, the degree of recovery is captured in the first term; the second term is a normalization factor that accounts for the fraction of the total monomer pool that is “bleached” and would be expected to re-enter the cluster.
Model results
The model capture phase separation as a function of interaction strength
We first simulated our model for different values of the interaction temperature θ applied as a uniform global input, i.e. at all lattice positions and times (Figure S1b). We simulated 105 reactions at each temperature (which corresponded to a total simulation time of T ≈ 18 normalized time units at all temperatures). We found that over a narrow range of θ values, centered approximately at θ =1, the system became organized into a phase-separation-like state. At this state we observed a considerable fraction of subunits organized into aggregates, as well as subunits that persisted in the monomeric state. This state was characterized by fast recovery after photobleaching and substantial shape relaxation of the aggregates, both hallmarks of liquid-like behavior (Figure S1C,D). We thus used θ =1 to simulate the liquid-like state in all subsequent spatial stimulus experiments.
At progressively lower values of θ the cluster size continued to increase until virtually all subunits were contained within the aggregated phase. After further decreases in θ we observed a transition to a state with arrested dynamics: cluster size decreased from its maximum size because dissociation from a cluster became highly unlikely, leading to a large number of small, spatially-separated clusters. In our simulation this state persisted for long times, although it is likely that a more complex simulation accounting for diffusive or convective transport of entire clusters would serve to induce further aggregation by coalescence.
A localized decrease in interaction strength leads to local, memoryless aggregation
We next used the model to probe how a localized stimulus would affect aggregation/ dissolution (Figure S1E; Figure 1B). To model a stimulus-induced local increase in aggregation, we initially evolved the system with θ = 2 at all positions, then transiently dropped the “temperature” to θ =1 on the right-half of the grid (i.e. for columns 51–100), leaving θ = 2 on the left-half of the grid (columns 1–50) (Figure S1F). Each stimulation regime – initial equilibration, transient stimulation, and stimulus removal – was performed for 2×10⁶ simulation steps, corresponding to approximately 360 normalized time units (this total time varies slightly between simulations based on the stochastic nature of reactions in the kinetic Monte Carlo framework). We found that this stimulus protocol led to transient cluster formation and droplet growth, followed by quick reversal upon stimulus removal (Figure S1F–H). We also tested the converse experiment, meant to represent a stimulus-induced local decrease in association strength (Figure 1B). In this case, the system was evolved at the stimulus strength θ = 1 everywhere until it was transiently increased to θ = 2 on the right-half of the grid. This scenario, described in the main text, led to a persistent asymmetry of cluster formation (Figure 1B–E).
Long-term model simulations show Ostwald ripening and validate the stability of a single, connected droplet
For phase separating systems, it is expected that the thermodynamic steady state is the formation of a single, connected droplet, a familiar like the separation of oil and vinegar in salad dressing. Approach to this state can be driven by multiple processes, including collisions and fusion between distinct droplets and Ostwald ripening, where large droplets grow at the expense of smaller ones by exchanging monomers that diffuse between droplets. However, the rate of approach to this state can be slow, leading to the quasi-stable appearance of long-lived, large droplets.
We set out to test whether our model exhibits classic phase separation behaviors: Ostwald ripening, kinetically-trapped states with multiple large droplets, and an equilibrium state defined by a single large droplet. To do so we ran long simulations of at least 107 individual reactions, corresponding to ~2,000–3,000 time units (time units are comparable between all simulations). The results, presented in Movie S3, show that indeed Ostwald ripening can occur, where an initial distribution of ~15 droplets slowly ripens into 5 larger droplets over time, but these 5 droplets remain stable for at least 1,000 time units. In addition, we found that when the model is initialized with a single cluster, its shape relaxes to become approximately circular but no new droplets are formed over the entire course of the simulation. To perform this simulation we initialized the 50 × 100 grid with 700 molecules located in a single rectangle in the center of the grid.
These long-timescale observations compare favorably to those we find in cells using the PixELL and OptoDroplet systems, where multiple large droplets persist over long periods of time. Indeed, we never observe coalescence into a single intracellular droplet, suggesting that the final fusion events or Ostwald ripening occur extremely slowly, or that other active processes (e.g. the regulated disassembly of large droplets) prevent this equilibrium state from being attained.
Supplementary Material
Kinetic Monte Carlo simulations showing aggregation for three different values of the interaction strength parameter θ. Simulations are each run for 105 iterations (corresponding to approximately 18 simulated time units in each case). Three different values of θ are shown: θ = 0.2 (solid-like), θ =1 (liquid-like) and θ = 2 (diffuse). Related to Figure 1.
Kinetic Monte Carlo simulations illustrating the effect of stimulus-dependent local inhibition of aggregation (a local decrease in the value of θ). Simulation shows an initial aggregation phase (where θ =1 globally), followed by local disassembly (θ = 2 on the right half of the lattice), followed by a return to global value of θ =1. Blue bar indicates the timing and spatial extent of stimulation. Related to Figure 1.
Long-term kinetic Monte Carlo simulations forθ =1. In the first section of the movie, clustering was initiated from diffuse initial conditions, leading to the growth of individual clusters by Ostwald ripening. In the second section, the simulation was initialized from a single droplet, demonstrating that no additional droplets form over long simulation times. Related to Figure 1.
Time lapse imaging of NIH3T3 cells expressing FUSN-Citrine-PixE and FUSN-FusionRed-PixD. Cells show repeated reversible formation and dissociation of clusters in blue light. Images were acquired with RFP imaging settings (561 nm excitation) every 30 sec for 5 h. Cells were stimulated with blue light from a digital micromirror device (DMD) for 10 min once each hour. Blue line in movie signifies timing of light delivery. Scale bar indicates 20 μm. Related to Figure 2.
Time lapse imaging of a NIH3T3 cell expressing FUSN-Citrine-PixE and FUSN-FusionRed-PixD, imaged in a subcellular region where clusters fuse over time. Images were acquired with RFP imaging settings (561 nm excitation) every 10 sec for 1 h. Yellow arrows indicate examples of fusion of distinct PixELL clusters. Scale bar indicates 10 μm. Related to Figure 2.
Time lapse imaging of an NIH3T3 cell expressing FUSN-Citrine-PixE and FUSN-FusionRed-PixD in response to transient, local blue light stimulation either in the cytosol or in the nucleus. Images of the cytosolic pattern were acquired with RFP imaging settings (561 nm excitation) every 30 sec for 1 h, while the nuclear pattern was acquired with RFP imaging settings acquiring every 10 sec during blue light stimulation, followed by time-lapse acquisition every 2 min after stimulus removal. Blue line in the video signifies the timing of the blue light stimulus. Scale bars indicates 20 μm. Related to Figure 3.
Time lapse imaging of an NIH3T3 cell expressing of FUSN-Citrine-PixE and FUSN-FusionRed-PixD while cell is stimulated with a gradient of blue light. Images were acquired with RFP imaging settings (561 nm excitation) every 10 sec for 40 min. Cells were stimulated with a linear horizontal gradient of blue light intensity. Blue line in video signifies both the timing of application and orientation of the blue light gradient. Scale bar indicates 20 μm. Related to Figure 4.
Time lapse imaging of two NIH-3T3 cells expressing MYR-FusN-FusionRed-Cry2 during two different sets of blue-light stimulus regimes. The first is local-to-off; the second is local-to-global stimulation with blue light. Images of each cell were acquired with RFP imaging settings (561 nm excitation) every 30 sec for 1.5 h. Cells were first stimulated with a local 450 nm light input, followed by either turning the blue light off for the first cell or a switch to global illumination at the same intensity as the local input for the second cell. The blue line in video signifies the timing and spatial range of blue light stimulation. Scale bars indicate 20 μm. Related to Figure 5.
Time lapse imaging of approximately 10 μm × 20 μm patches of NIH-3T3 cell membranes expressing Myr-FUSN-FusionRed-Cry2 (Myr-OptoDroplets). Cells were treated with DMSO as a control (part 1 of the movie), 1 μg/mL latrunculin A (part 2), or 0.5 μg/mL nocodazole (part 3). Continuous blue light is added at time zero. Scale bar indicates 10 μm. Membrane-localized droplets exhibit active transport in DMSO- and latrunculin-treated cells, with active transport dramatically reduced in nocodazole-treated cells. Related to Figure 5.
Time lapse imaging of a NIH-3T3 cell expressing MYR-FusN-FusionRed-Cry2-FGFR1 during alternating bouts of global stimulation with blue light and withdrawal of the blue light stimulus. Images were acquired with RFP imaging settings (561 nm excitation) every 30 sec for 1 h. The blue line in video signifies the timing of blue light stimulation. Scale bar indicates 20 μm. Related to Figure 6.
Highlights.
We introduce PixELLs, an optogenetic system for protein droplet disassembly.
Modeling and experiments demonstrate long-term memory of local droplet dissociation.
Droplets ‘remember’ spatial stimuli in nuclei, the cytosol and on cell membranes.
FGFR-optoDroplets convert transient local inputs to persistent cytoskeletal responses.
Acknowledgments
We thank all members of the Toettcher lab for their comments and Orion Weiner, Doug Tischer and Lukasz Bugaj for a critical reading of the manuscript. We especially thank Dr. Peter Tonge (Stony Brook University) for sharing DNA constructs and expertise for the PixD and PixE proteins. E.D. was supported by NIH Training Grant T32GM007388 and G.U. was supported by a grant from the Doris Duke Charitable Foundation to the LA-HIP2.0 program at the Saban Research Institute of Children’s Hospital, Los Angeles. This work was also supported by NIH grant DP2EB024247 (to J.E.T.) and U01DA040601 (to C.P.B.). We also thank Dr. Gary Laevsky and the Molecular Biology Microscopy Core, which is a Nikon Center of Excellence, for microscopy support.
Footnotes
Declaration of interests
The authors declare no conflict of interests.
Author contributions
Conceptualization, E.D., A.A.G. and J.E.T.; Methodology, E.D., C.P.B. and J.E.T.; Investigation, E.D., G.U., and J.E.T.; Writing – Original Draft, E.D. and J.E.T.; Writing – Review & Editing, all authors; Funding Acquisition, C.P.B. and J.E.T.; Resources, C.P.B. and J.E.T.; Supervision, J.E.T.
Publisher's Disclaimer: This is a PDF file of an unedited manuscript that has been accepted for publication. As a service to our customers we are providing this early version of the manuscript. The manuscript will undergo copyediting, typesetting, and review of the resulting proof before it is published in its final citable form. Please note that during the production process errors may be discovered which could affect the content, and all legal disclaimers that apply to the journal pertain.
References
- Altschuler SJ, Angenent SB, Wang Y, Wu LF. On the spontaneous emergence of cell polarity. Nature. 2008;454:886–889. doi: 10.1038/nature07119. [DOI] [PMC free article] [PubMed] [Google Scholar]
- Banjade S, Rosen MK. Phase transitions of multivalent proteins can promote clustering of membrane receptors. eLife. 2014:3. doi: 10.7554/eLife.04123. [DOI] [PMC free article] [PubMed] [Google Scholar]
- Bosse JB, Hogue IB, Feric M, Thiberge SY, Sodeik B, Brangwynne CP, Enquist LW. Remodeling nuclear architecture allows efficient transport of herpesvirus capsids by diffusion. Proc Natl Acad Sci USA. 2015;112:E5725–33. doi: 10.1073/pnas.1513876112. [DOI] [PMC free article] [PubMed] [Google Scholar]
- Brangwynne CP, Eckmann CR, Courson DS, Rybarska A, Hoege C, Gharakhani J, Julicher F, Hyman AA. Germline P granules are liquid droplets that localize by controlled dissolution/condensation. Science. 2009;324:1729–1732. doi: 10.1126/science.1172046. [DOI] [PubMed] [Google Scholar]
- Doi M. Soft matter physics. Oxford University Press; 2013. [Google Scholar]
- Forrest KM, Gavis ER. Live imaging of endogenous RNA reveals a diffusion and entrapment mechanism for nanos mRNA localization in Drosophila. Current biology. 2003;13:1159–1168. doi: 10.1016/s0960-9822(03)00451-2. [DOI] [PubMed] [Google Scholar]
- Freeman Rosenzweig ES, Xu B, Kuhn Cuellar L, Martinez-Sanchez A, Schaffer M, Strauss M, Cartwright HN, Ronceray P, Plitzko JM, Forster F, et al. The Eukaryotic CO2-Concentrating Organelle Is Liquid-like and Exhibits Dynamic Reorganization. Cell. 2017;171:148–162. e119. doi: 10.1016/j.cell.2017.08.008. [DOI] [PMC free article] [PubMed] [Google Scholar]
- Friedl P, Gilmour D. Collective cell migration in morphogenesis, regeneration and cancer. Nature reviews Molecular cell biology. 2009;10:445–457. doi: 10.1038/nrm2720. [DOI] [PubMed] [Google Scholar]
- Gierer A, Meinhardt H. A theory of biological pattern formation. Kybernetik. 1972;12:30–39. doi: 10.1007/BF00289234. [DOI] [PubMed] [Google Scholar]
- Goldstein B, Macara IG. The PAR proteins: fundamental players in animal cell polarization. Developmental cell. 2007;13:609–622. doi: 10.1016/j.devcel.2007.10.007. [DOI] [PMC free article] [PubMed] [Google Scholar]
- Grusch M, Schelch K, Riedler R, Reichhart E, Differ C, Berger W, Ingles-Prieto A, Janovjak H. Spatio-temporally precise activation of engineered receptor tyrosine kinases by light. The EMBO journal. 2014;33:1713–1726. doi: 10.15252/embj.201387695. [DOI] [PMC free article] [PubMed] [Google Scholar]
- Kim N, Kim JM, Lee M, Kim CY, Chang KY, Heo WD. Spatiotemporal control of fibroblast growth factor receptor signals by blue light. Chemistry & biology. 2014;21:903–912. doi: 10.1016/j.chembiol.2014.05.013. [DOI] [PubMed] [Google Scholar]
- Kloc M, Etkin LD. RNA localization mechanisms in oocytes. J Cell Sci. 2005;118:269–282. doi: 10.1242/jcs.01637. [DOI] [PubMed] [Google Scholar]
- Kuhn T, Ihalainen TO, Hyvaluoma J, Dross N, Willman SF, Langowski J, Vihinen-Ranta M, Timonen J. Protein diffusion in mammalian cell cytoplasm. PloS one. 2011;6:e22962. doi: 10.1371/journal.pone.0022962. [DOI] [PMC free article] [PubMed] [Google Scholar]
- Landau DP, Binder K. A guide to Monte Carlo simulations in statistical physics. Cambridge university press; 2014. [Google Scholar]
- Lee CF, Brangwynne CP, Gharakhani J, Hyman AA, Julicher F. Spatial organization of the cell cytoplasm by position-dependent phase separation. Physical review letters. 2013;111:088101. doi: 10.1103/PhysRevLett.111.088101. [DOI] [PubMed] [Google Scholar]
- Lifshitz IM, Slyozov J. The kinetics of precipitation from supersaturated solid solutions. J Phys Chem Solids. 1961;19:35. [Google Scholar]
- Masuda S, Hasegawa K, Ishii A, Ono TA. Light-induced structural changes in a putative blue-light receptor with a novel FAD binding fold sensor of blue-light using FAD (BLUF); Slr1694 of synechocystis sp. PCC6803. Biochemistry. 2004;43:5304–5313. doi: 10.1021/bi049836v. [DOI] [PubMed] [Google Scholar]
- Nakamura H, Lee AA, Afshar AS, Watanabe S, Rho E, Razavi S, Suarez A, Lin YC, Tanigawa M, Huang B, et al. Intracellular production of hydrogels and synthetic RNA granules by multivalent molecular interactions. Nat Mater. 2017;17:79. doi: 10.1038/nmat5006. [DOI] [PMC free article] [PubMed] [Google Scholar]
- O’Brien RJ, Lau LF, Huganir RL. Molecular mechanisms of glutamate receptor clustering at excitatory synapses. Curr Op Neurobio. 1998;8:364–369. doi: 10.1016/s0959-4388(98)80062-7. [DOI] [PubMed] [Google Scholar]
- Prentice-Mott HV, Meroz Y, Carlson A, Levine MA, Davidson MW, Irimia D, Charras GT, Mahadevan L, Shah JV. Directional memory arises from long-lived cytoskeletal asymmetries in polarized chemotactic cells. Proc Natl Acad Sci USA. 2016;113:1267–1272. doi: 10.1073/pnas.1513289113. [DOI] [PMC free article] [PubMed] [Google Scholar]
- Regot S, Hughey JJ, Bajar BT, Carrasco S, Covert MW. High-sensitivity measurements of multiple kinase activities in live single cells. Cell. 2014;157:1724–1734. doi: 10.1016/j.cell.2014.04.039. [DOI] [PMC free article] [PubMed] [Google Scholar]
- Sailer A, Anneken A, Li Y, Lee S, Munro E. Dynamic Opposition of Clustered Proteins Stabilizes Cortical Polarity in the C. elegans Zygote. Developmental cell. 2015;35:131–142. doi: 10.1016/j.devcel.2015.09.006. [DOI] [PMC free article] [PubMed] [Google Scholar]
- Serebrinsky SA. Physical time scale in kinetic Monte Carlo simulations of continuous-time Markov chains. Physical review E, Statistical, nonlinear, and soft matter physics. 2011;83:037701. doi: 10.1103/PhysRevE.83.037701. [DOI] [PubMed] [Google Scholar]
- Shin Y, Berry J, Pannucci N, Haataja MP, Toettcher JE, Brangwynne CP. Spatiotemporal Control of Intracellular Phase Transitions Using Light-Activated optoDroplets. Cell. 2017;168:159–171. e114. doi: 10.1016/j.cell.2016.11.054. [DOI] [PMC free article] [PubMed] [Google Scholar]
- Shin Y, Brangwynne CP. Liquid phase condensation in cell physiology and disease. Science. 2017:357. doi: 10.1126/science.aaf4382. [DOI] [PubMed] [Google Scholar]
- Su X, Ditlev JA, Hui E, Xing W, Banjade S, Okrut J, King DS, Taunton J, Rosen MK, Vale RD. Phase separation of signaling molecules promotes T cell receptor signal transduction. Science. 2016;352:595–599. doi: 10.1126/science.aad9964. [DOI] [PMC free article] [PubMed] [Google Scholar]
- Taslimi A, Vrana JD, Chen D, Borinskaya S, Mayer BJ, Kennedy MJ, Tucker CL. An optimized optogenetic clustering tool for probing protein interaction and function. Nat Commun. 2014;5:4925. doi: 10.1038/ncomms5925. [DOI] [PMC free article] [PubMed] [Google Scholar]
- Toettcher JE, Gong D, Lim WA, Weiner OD. Light-based feedback for controlling intracellular signaling dynamics. Nature methods. 2011;8:837–839. doi: 10.1038/nmeth.1700. [DOI] [PMC free article] [PubMed] [Google Scholar]
- Toettcher JE, Weiner OD, Lim WA. Using optogenetics to interrogate the dynamic control of signal transmission by the Ras/Erk module. Cell. 2013;155:1422–1434. doi: 10.1016/j.cell.2013.11.004. [DOI] [PMC free article] [PubMed] [Google Scholar]
- Turing AM. The chemical basis of morphogenesis. Bulletin of mathematical biology. 1953;52:153–197. doi: 10.1007/BF02459572. discussion 119–152. [DOI] [PubMed] [Google Scholar]
- van Lengerich B, Agnew C, Puchner EM, Huang B, Jura N. EGF and NRG induce phosphorylation of HER3/ERBB3 by EGFR using distinct oligomeric mechanisms. Proc Natl Acad Sci USA. 2017;114:E2836–E2845. doi: 10.1073/pnas.1617994114. [DOI] [PMC free article] [PubMed] [Google Scholar]
- Wagner C. Theory of precipitate change by redissolution. Z Elektrochem. 1961;65:581–591. [Google Scholar]
- Xiong W, Ferrell JE., Jr A positive-feedback-based bistable ‘memory module’ that governs a cell fate decision. Nature. 2003;426:460–465. doi: 10.1038/nature02089. [DOI] [PubMed] [Google Scholar]
- Yuan H, Bauer CE. PixE promotes dark oligomerization of the BLUF photoreceptor PixD. Proc Natl Acad Sci USA. 2008;105:11715–11719. doi: 10.1073/pnas.0802149105. [DOI] [PMC free article] [PubMed] [Google Scholar]
Associated Data
This section collects any data citations, data availability statements, or supplementary materials included in this article.
Supplementary Materials
Kinetic Monte Carlo simulations showing aggregation for three different values of the interaction strength parameter θ. Simulations are each run for 105 iterations (corresponding to approximately 18 simulated time units in each case). Three different values of θ are shown: θ = 0.2 (solid-like), θ =1 (liquid-like) and θ = 2 (diffuse). Related to Figure 1.
Kinetic Monte Carlo simulations illustrating the effect of stimulus-dependent local inhibition of aggregation (a local decrease in the value of θ). Simulation shows an initial aggregation phase (where θ =1 globally), followed by local disassembly (θ = 2 on the right half of the lattice), followed by a return to global value of θ =1. Blue bar indicates the timing and spatial extent of stimulation. Related to Figure 1.
Long-term kinetic Monte Carlo simulations forθ =1. In the first section of the movie, clustering was initiated from diffuse initial conditions, leading to the growth of individual clusters by Ostwald ripening. In the second section, the simulation was initialized from a single droplet, demonstrating that no additional droplets form over long simulation times. Related to Figure 1.
Time lapse imaging of NIH3T3 cells expressing FUSN-Citrine-PixE and FUSN-FusionRed-PixD. Cells show repeated reversible formation and dissociation of clusters in blue light. Images were acquired with RFP imaging settings (561 nm excitation) every 30 sec for 5 h. Cells were stimulated with blue light from a digital micromirror device (DMD) for 10 min once each hour. Blue line in movie signifies timing of light delivery. Scale bar indicates 20 μm. Related to Figure 2.
Time lapse imaging of a NIH3T3 cell expressing FUSN-Citrine-PixE and FUSN-FusionRed-PixD, imaged in a subcellular region where clusters fuse over time. Images were acquired with RFP imaging settings (561 nm excitation) every 10 sec for 1 h. Yellow arrows indicate examples of fusion of distinct PixELL clusters. Scale bar indicates 10 μm. Related to Figure 2.
Time lapse imaging of an NIH3T3 cell expressing FUSN-Citrine-PixE and FUSN-FusionRed-PixD in response to transient, local blue light stimulation either in the cytosol or in the nucleus. Images of the cytosolic pattern were acquired with RFP imaging settings (561 nm excitation) every 30 sec for 1 h, while the nuclear pattern was acquired with RFP imaging settings acquiring every 10 sec during blue light stimulation, followed by time-lapse acquisition every 2 min after stimulus removal. Blue line in the video signifies the timing of the blue light stimulus. Scale bars indicates 20 μm. Related to Figure 3.
Time lapse imaging of an NIH3T3 cell expressing of FUSN-Citrine-PixE and FUSN-FusionRed-PixD while cell is stimulated with a gradient of blue light. Images were acquired with RFP imaging settings (561 nm excitation) every 10 sec for 40 min. Cells were stimulated with a linear horizontal gradient of blue light intensity. Blue line in video signifies both the timing of application and orientation of the blue light gradient. Scale bar indicates 20 μm. Related to Figure 4.
Time lapse imaging of two NIH-3T3 cells expressing MYR-FusN-FusionRed-Cry2 during two different sets of blue-light stimulus regimes. The first is local-to-off; the second is local-to-global stimulation with blue light. Images of each cell were acquired with RFP imaging settings (561 nm excitation) every 30 sec for 1.5 h. Cells were first stimulated with a local 450 nm light input, followed by either turning the blue light off for the first cell or a switch to global illumination at the same intensity as the local input for the second cell. The blue line in video signifies the timing and spatial range of blue light stimulation. Scale bars indicate 20 μm. Related to Figure 5.
Time lapse imaging of approximately 10 μm × 20 μm patches of NIH-3T3 cell membranes expressing Myr-FUSN-FusionRed-Cry2 (Myr-OptoDroplets). Cells were treated with DMSO as a control (part 1 of the movie), 1 μg/mL latrunculin A (part 2), or 0.5 μg/mL nocodazole (part 3). Continuous blue light is added at time zero. Scale bar indicates 10 μm. Membrane-localized droplets exhibit active transport in DMSO- and latrunculin-treated cells, with active transport dramatically reduced in nocodazole-treated cells. Related to Figure 5.
Time lapse imaging of a NIH-3T3 cell expressing MYR-FusN-FusionRed-Cry2-FGFR1 during alternating bouts of global stimulation with blue light and withdrawal of the blue light stimulus. Images were acquired with RFP imaging settings (561 nm excitation) every 30 sec for 1 h. The blue line in video signifies the timing of blue light stimulation. Scale bar indicates 20 μm. Related to Figure 6.