

Supplemental Digital Content is available in the text.
Keywords: blood, platelets, fibrin, hemodynamics, hemostasis, thrombosis
Abstract
Objective—
We investigated the coregulation of thrombin and fibrin as blood flows over a procoagulant surface.
Approach and Results—
Using microfluidic perfusion of factor XIIa-inhibited human whole blood (200 s−1 wall shear rate) over a 250-μm long patch of collagen/TF (tissue factor; ≈1 molecule per μm2) and immunoassays of the effluent for F1.2 (prothrombin fragment 1.2), TAT (thrombin–antithrombin complex), and D-dimer (post–end point plasmin digest), we sought to establish the transient mass balance for clotting under venous flow. F1.2 (but almost no free thrombin detected via TAT assay) continually eluted from clots when fibrin was allowed to form. Low-dose fluorescein-Phe-Pro-Arg-chloromethylketone stained fibrin-bound thrombin—a staining ablated by anti–γ′-fibrinogen or the fibrin inhibitor glypro-arg-pro but highly resistant to 7-minute buffer rinse, demonstrating tight binding of thrombin to γ′-fibrin. With fibrin polymerizing for 500 seconds, 92 000 thrombin molecules and 203 000 clot-associated fibrin monomer equivalents were generated per TF molecule (or per μm2). Fibrin reached 15 mg/mL in the pore space (porosity ≈0.5) of a 15-μm-thick thrombus core by 500 seconds and 30 mg/mL by 800 seconds. For a known rate of ≈60 FPA (fibrinopeptide-A) per thrombin per second, each thrombin molecule generated only 3 fibrin monomer equivalents during 500 seconds, indicating an intraclot thrombin half-life of ≈70 ms, much shorter than its diffusional escape time (≈10 seconds). By 800 seconds, gly-pro-arg-pro allowed 4-fold more F1.2 generation, consistent with gly-pro-arg-pro ablating fibrin’s antithrombin-I activity and facilitating thrombin-mediated FXIa activation.
Conclusions—
Under flow, fibrinogen continually penetrates the clot, and γ′-fibrin regulates thrombin.
On vessel injury or plaque rupture, platelets rapidly deposit at the perturbed site. Additionally, thrombin is generated by the coagulation cascade triggered by wall-exposed TF (tissue factor). Thrombin functions as a key driver of clotting by promoting human platelet activation via PAR1 (protease-activated receptor) and PAR4 and by cleaving fibrinogen for fibrin polymerization. The mouse laser injury model has revealed a heterogeneous clot structure with a tightly packed core of activated platelets and a less-stable and loosely packed outer shell of less activated platelets.1,2 Similarly, in microfluidic experiments with human blood, a P-selectin–positive core is detected that is colocalized with thrombin and fibrin. The thickness of the core region depends on the localization of thrombin because thrombin localization detected with a platelet-targeting biosensor3 is highly correlated temporally and spatially with P-selectin display in the core.4,5 Under venous conditions, antagonism of fibrin polymerization with the inhibitor gly-pro-arg-pro (GPRP) or blockade of γ′-fibrinogen with an antibody leads to larger clots.5 Consistent with thrombin localization in the clot core, the core is the location where interstitial permeation is expected to be less because of the lower porosity after contraction.6
In prior studies using TAT (thrombin–antithrombin complex) immunoassay on blood flowing over a procoagulant surface,7 little TAT was detectable in the effluent unless fibrin polymerization was blocked with GPRP. Fibrin efficiently captured >85% of the locally generated thrombin. For flow over a TF surface with fibrin polymerization blocked, the thrombin wall flux increased linearly with time to ≈0.5×10⁻¹² nmol/μm2 sec during the first 500 seconds of clotting. The thrombin flux then increased by a factor of 3-fold by 800 seconds of clotting—an increase blocked by anti-factor XIa antibody (O1A6).
Importantly, the γ′-fibrinogen slice variant represents ≈6% to 8% of the total γ-chains (or equivalently, the γA/γ′ heterodimer represents ≈12%–16% of the total fibrinogen).8,9 Fibrin presents the weak sites in the E-domain for thrombin exosite 1 (≈1.6–1.8 sites per monomer; Kd≈2–4 μM) and a high-affinity site that targets thrombin exosite 2 via the highly anionic and tyrosine-sulfated γ′-chain sequence (≈0.2–0.4 sites per monomer; Kd≈0.1–0.4 μM).10–12 Despite the measurement of a moderate submicromolar affinity of the γ′-chain of fibrin for thrombin, the binding may actually be much tighter as indicated by fibrin’s tight capture of endogeneous by generated thrombin7 and exogenously added thrombin.12 In fact, the binding by thick fibers of fibrin has been described as irreversible and unsuited for Scatchard analysis13 with steric capture/entrapment implicated.
Beyond measuring thrombin production by TAT assay in the presence of GPRP, thrombin generation can also be followed via the release of F1.2 (prothrombin fragment 1.2). F1.2 can be detected in the clot effluent even in the presence of fibrin generation. In contrast to thrombin generation, few if any quantitative measurements have been made of fibrin content of clots formed under flow. Fluorescent fibrinogen or fluorescent anti-fibrin antibody can be added to blood to follow the dynamics of intrathrombus fibrin generation. However, fluorescence is difficult to calibrate and can include platelet binding of fibrin(ogen). As an end point measurement, a clot formed on a procoagulant surface can be rinsed with buffer, subjected to plasmin, and then assayed by D-dimer immunoassay to give a quantitative measure of intraclot fibrin.
Because γ′-fibrin can capture thrombin, an improved understanding of clot growth requires direct measurement of the coregulation of local thrombin and fibrin dynamics. For clotting under flow, platelet densities are 50 to 200× greater than platelet-rich plasma.1,14 Additionally, considerable effort has been directed at computer simulation of TF-driven thrombin generation in tube reactions15,16 or under flow.17–19 To our knowledge, this is the first simultaneous measurement of the rate and quantity of thrombin and fibrin generated within a clot formed under venous flow.
Materials and Methods
The data that support the findings of this study are available from the corresponding author on request.
Materials
The following reagents were obtained: anti-human CD61 (BD Biosciences, San Jose, CA), Alexa Fluor647-conjugated human fibrinogen (Life Technologies, Grand Island, NY), collagen type I Chrono-Par aggregation reagent (Chrono-log, Havertown, PA), CTI (corn trypsin inhibitor; Hematologic Technologies, Essex Junction, VT), Phe-Pro-Arg-chloromethylketone (PPACK; Hematologic Technologies, Essex Junction, VT), Dade Innovin prothrombin time reagent (Siemens, Malvern, PA), Enzygnost F1+2 monoclonal kit (Siemens Healthcare Diagnostic, Tarrytown, NY), D-dimer ELISA kit (Abcam, Cambridge, MA), human FPA (fibrinopeptide-A), ELISA Kit (MyBioSource, San Diego, CA), EDTA (Sigma, St. Louis, MO), H-Gly-Pro-Arg-Pro-OH (EMD Chemicals, San Diego, CA), fluorescein Phe-Pro-Arg-chloromethylketone (fluorescein-PPACK; Hematologic Technologies, Essex Junction, VT), Sigmacote siliconizing reagent (Sigma, St. Louis, MO), and Sylgard 184 Silicone Elastomer kit (Dow Corning, Auburn, MI). O1A6 FXI antibody was a gift from Dr Andras Gruber (Department of Biomedical Engineering, Oregon Health and Science University). See the online-only Data Supplement for catalog numbers.
Polydimethylsiloxane Patterning and Flow Device
Polydimethylsiloxane devices were fabricated as described previously.7,20 Devices with a single long channel (250 μm in width and 60 μm in height) were used to pattern protein onto glass slides. Multichannel flow chambers were used for microfluidic thrombosis assay. Each of these devices has 8 individual flow channels (250 μm in width and 60 μm in height) that are diverging from a single inlet and converging into a common outlet where blood sample was collected. Polydimethylsiloxane devices can be reversibly fixed to glass slides through vacuum bonding. Glass slides were rinsed with ethanol, dried with filtered compressed air before being treated with Sigmacote to prevent surface triggered blood clotting. Collagen type I (1 mg/mL, 5 μL) was perfused through the main channel on the single-channel device to generate a patch (250 μm in length) of aligned collagen fibers on glass slides, followed by BSA (0.5% BSA in HEPES buffered saline, 5 μL). To add lipidated TF vesicles onto patterned collagen, Dade Innovin prothrombin time reagent (23 nmol/L) was subsequently perfused through the channel.21 After 30 minutes of incubation, excessive collagen or vesicles were washed with a final BSA rinse (20 μL). TF surface densities were ≈1 TF molecule per μm2, based on prior calibration using fluorescent imaging of FITC-annexin V–stained vesicles.7,21
Blood Collection and Sample Preparation
All donors were healthy individuals who provided consent under approval of University of Pennsylvania Institutional Review Board and were self-reported free of any medication or alcohol for at least 72 hours before blood donation. Blood was collected via venipuncture into syringes containing high dosage of CTI (40 μg/mL) to prevent contact activation and was subsequently labeled with CD61 antibody (2% by volume) and fluorescent fibrinogen (1.3% by volume) for platelet and fibrin epifluorescence detection, respectively. When needed, GPRP (5 mmol/L) was added to blood sample to block fibrin polymerization. In some experiments, fluorescein-PPACK was added to label the thrombin-active site.
Microfluidic Thrombosis Assay
The multichannel flow chamber was vacuum bonded on glass slides over the patterned TF bearing collagen patches. The flow channels were run perpendicularly to the collagen/TF patches and were primed and incubated with BSA buffer for at least 30 minutes before experiments to block nonspecific protein adsorption during blood perfusion. Labeled whole blood was transferred to BD 1-mL plastic syringes (Becton Dickson, Franklin Lakes, NJ), which were the then mounted on a PHD 2000 syringe pump (Harvard Apparatus, Holliston, MA). All flow experiments were initiated within 10 minutes after phlebotomy to avoid contact activation because of prolonged blood–surface contact even in the presence of high dosage of CTI. Blood was infused into the flow device at a constant flow rate of 16 μL/min (2 μL/min per channel), which corresponds to an initial wall shear rate of 200 s−1 in each channel. Platelet aggregation and fibrin formation were simultaneously monitored and captured with a fluorescence microscope (IX81; Olympus America, Inc, Center Valley, PA) equipped with a CCD camera (Hamamasu, Bridgewater, NJ).
F1.2, TAT, D-Dimer, and FPA Immunoassay
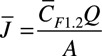
The effluent of the flow device was collected for various immunoassays (Figure 1). For F1.2 and FPA ELISA, the effluent was treated with 10 μL of quenching buffer containing EDTA (0.5 mmol/L) and PPACK (100 µmol/L). Calcium-dependent thrombin generation was immediately quenched by EDTA, and calcium-independent fibrinogen cleavage by thrombin was quenched with PPACK. A blood sample was collected from the outlet every 3 minutes into individual centrifuge tubes. For TAT assay, the sample was quenched only with EDTA to prevent further thrombin generation but to allow active thrombin to complex with antithrombin. Collected blood samples were centrifuged at 1500 g for 15 minutes to isolate platelet-poor plasma for ELISA. Background levels were determined by analyzing the plasma sample isolated from blood that was quenched with EDTA/PPACK buffer immediately after phlebotomy. For each mole of generated thrombin, 1 mole of F1.2 is released from converted prothrombin. Thus, the measured average F1.2 concentration ( ) 2 collections can be converted to an average thrombin flux (
 ) using the following equation, where Q is flow rate (16 μL/min) and A is total thrombotic area:
Figure 1.
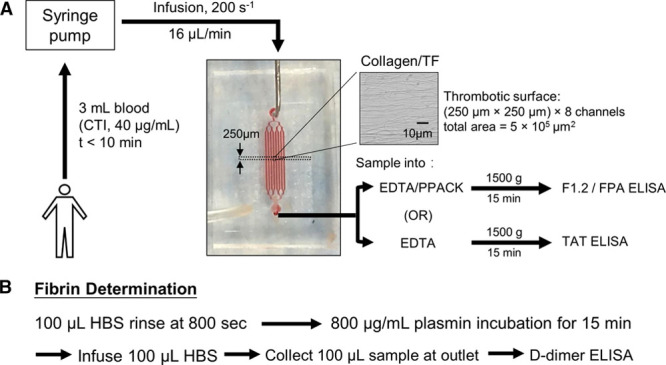
Experimental protocol to perfuse whole blood over discrete 250-μm-long collagen/TF (tissue factor) surfaces while measuring dynamic platelet and fibrin accumulation by fluorescence microscopy and detecting F1.2 (prothrombin fragment 1.2) and TAT (thrombin–antithrombin complex) in the effluent using immunoassays (A). In some experiments, the clot was rinsed in situ and subjected to plasmin digestion to release D-dimer for subsequent immunoassay (B). CTI indicates corn trypsin inhibitor; FPA, fibrinopeptide-A; HBS, HEPES buffered saline; and PPACK, Phe-Pro-Arg-chloromethylketone.
 |
For the fibrin end point determination after 800 seconds of clotting, whole blood perfusion was replaced with a HEPES buffered saline rinse and then subjected to high-dose plasmin digestion (800 μg/mL for 15 minutes) followed by digest collection and D-dimer ELISA. Each D-dimer detected was considered equivalent to a single fibrin monomer presenting 2 D-domains.
Results
Intrathrombus Thrombin Is Captured by Fibrin via the γ′ Fibrin(ogen) Variant
Human blood was collected in high concentration of FXIIa inhibitor CTI (40 μg/mL) and immediately perfused over collagen/TF to allow 2-color imaging of platelet and fibrin fluorescence dynamics and collection of effluent samples for assay of TAT, F1.2 (Figure 1A), or end point collection of plasmin-lyzed fibrin for D-dimer assay (Figure 1B). Under venous wall shear rate of 200 s−1, platelets and fibrin intensely accumulated on the collagen/TF patch with dense platelet aggregates surrounded by dense fibrin (Figure 2). Addition of a low concentration of fluorescein-PPACK (600 nmol/L) did not block fibrin deposition and allowed the detection of the thrombin-active site, which was highly colocalized with the fibrin (Figure 2, top) but considerably less so with platelets. Inclusion of 5 mmol/L GPRP to the assay had little effect on platelet deposition but ablated fibrin polymerization and ablated the detection of the thrombin-active site with fluorescein-PPACK (Figure 2, middle), indicating that capture of tightly bound thrombin within the clot required fibrin. This result was exactly consistent with the inability to detect TAT in the effluent unless GPRP was present.7 Inclusion of anti–γ′-fibrinogen antibody had a slight effect on fibrin morphology and completely ablated the detection of the thrombin-active site with fluorescein-PPACK (Figure 2, bottom), demonstrating that intrathrombus thrombin was captured and localized by γ′-fibrin(ogen).
Figure 2.
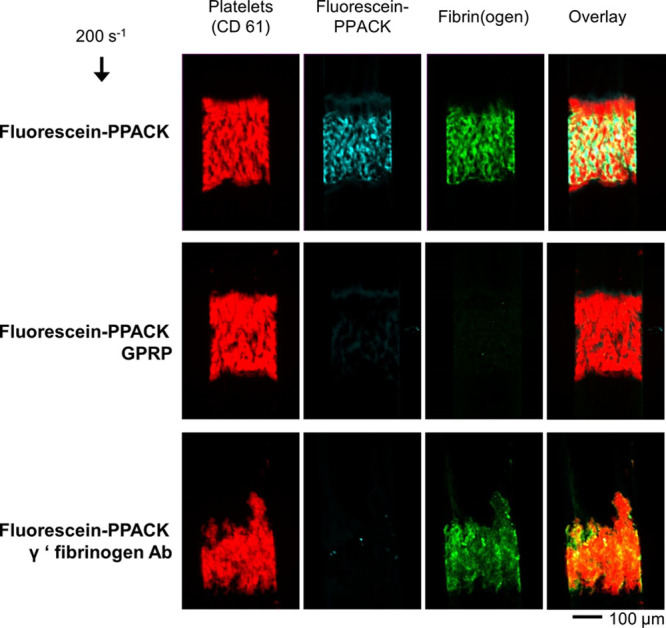
Accumulation of fluorescent platelets and fibrin(ogen) on collagen/TF (tissue factor) in the presence of low-dose fluorescein-Phe-Pro-Arg-chloromethylketone (PPACK) to stain for the thrombin-active site under control conditions (top) or GPRP (gly-pro-arg-pro) to block fibrin (middle) or anti-γ′-fibrinogen antibody (bottom).
In a separate experimental design, clots were allowed to form (CTI whole blood over collagen/TF) for 2 minutes at 200 s−1. Then, fluorescein-PPACK buffer was added for 2 minutes to label the thrombin-active site followed by a 7-minute high shear buffer wash at 1000 s−1. Again, the thrombin-active site detected with fluorescein-PPACK was (1) strongly stained in the clot, (2) highly colocalized with fibrin, (3) largely absent on platelet masses, and (4) highly resistant to high shear rate washout during a 7-minute time frame (Figure 3), all consistent with nearly irreversible binding of thrombin by fibrin.7,12,13
Figure 3.
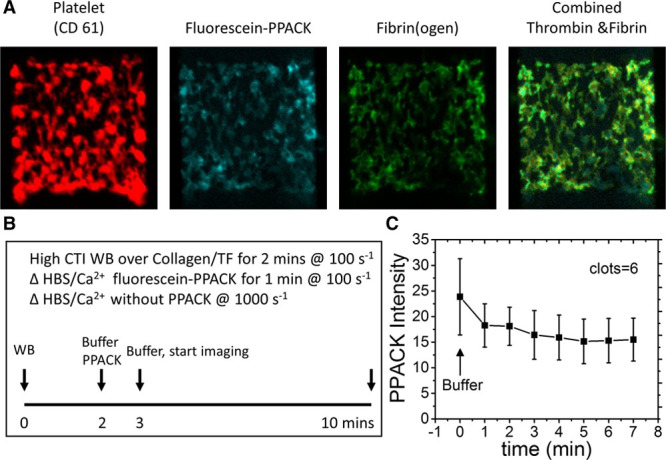
Washout experiment of fluorescein-Phe-Pro-Arg-chloromethylketone (PPACK)–labeled thrombin (A). Clots were formed for 2 min, stained with fluorescein-PPACK for 1 min, and then buffer washed for 10 min (B) to follow the elution of thrombin from the clot (C). Results are expressed as mean±SD (n=6). All the values are significantly different from zero (P<0.001) demonstrating essentially no washout of thrombin. CTI indicates corn trypsin inhibitor; HBS, HEPES buffered saline; TF, tissue factor; and WB, whole blood.
Thrombin Production Rates in Fibrin-Rich Clots
To measure thrombin production by whole blood clotting on collagen/TF while fibrin was polymerizing (no GPRP), F1.2 was measured in the clot effluent. The concentration of F1.2 increased linearly with time, for the first 500 seconds to a thrombin flux value of ≈0.5×10⁻¹² nmole thrombin per μm2 sec, essentially identical to the thrombin flux determined with TAT assay with GPRP present (Figure 4A). The amount of F1.2 generated was considerably greater in the presence of GPRP, especially at later times of 400 to 800 seconds where FXIa activity is considered an important contributor to thrombin production, in part, through a platelet polyphosphate-dependent mechanism.7,21 The increased F1.2 generation in the presence of GPRP was expected because thrombin would not be susceptible to γ′-fibrin sequestration. The late stage role of FXIa on F1.2 generation was shown at the later times between 400 and 800 seconds through the function blocking antibody O1A6 to inhibit FXIa (Figure 4B). The amount of F1.2 made in the presence of GPRP was ≈30% to 50% greater than the amount of TAT detected in the presence of GPRP (Figure 4A), which was expected because some of the thrombin released from the clot might be inhibited by C1 inhibitor or α2-macroglobulin instead of antithrombin. In a control experiment, all the F1.2 detected in the effluent was dependent on the TF in the collagen coating because blank chambers lacking collagen/TF produced essentially undetectable levels of F1.2 (regardless of the presence or absence of GPRP), also indicating that high-dose CTI quenches FXIIa in the inlet reservoir and flow channels of the microfluidic device (Figure II in the online-only Data Supplement).
Figure 4.
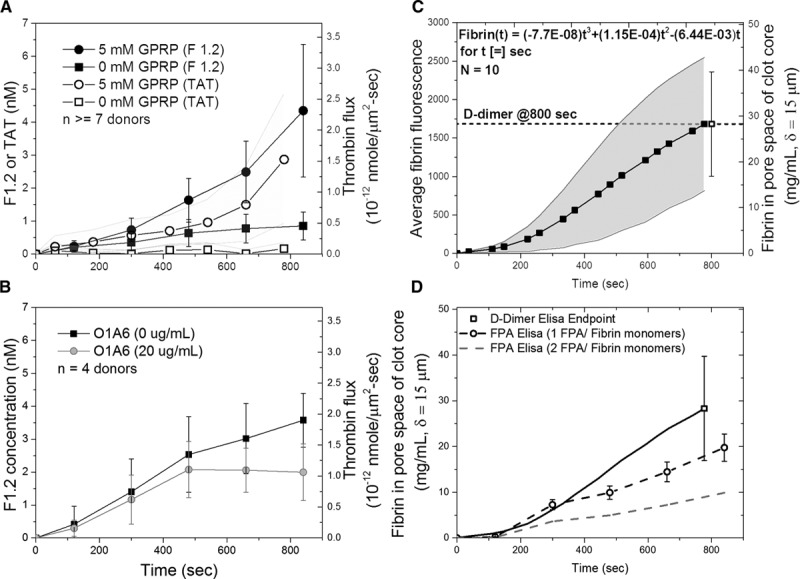
Comparison of F1.2 (prothrombin fragment 1.2) and TAT (thrombin–antithrombin complex) generation by whole blood clotting under venous flow conditions in the presence or absence of GPRP (gly-pro-arg-pro; A) or anti-FXIa antibody O1A6 (B). Alternatively, clots were formed with fluorescent fibrinogen tracer and then subjected to end point plasmin digest for assay of D-dimer (C). FPA (fibrinopeptide-A) generation was measured from 0 to 800 s. The result from independently measured D-dimer assay (dark line) was compared with assuming 1 FPA/fibrin monomer (dark dashed line) and 2 FPA/fibrin monomer (gray dashed line; D). Results are expressed as mean±SD.
Intrathrombus Fibrin Can Reach Levels 10-Fold Greater Than Plasma Fibrinogen Concentration
During the perfusion of whole blood over collagen/TF, the accumulation of fibrin can be followed dynamically with time using fluorescent fibrinogen (Figure 4C). At the end of the 800-second experiment, the clot was rinsed and subjected to plasmin degradation to release D-dimer for immunoassay. This 800-second end point measurement allowed the determination of the final fibrin concentration in the clot to be determined to be 30±15 mg/mL (≈90 μM fibrin; ≈10–15 μM γ′-fibrin chains) in the pore space of the clot. This fibrin concentration depends on several prior known constraints, such as the fibrin existing only in the pore space of a platelet mass with porosity of ≈0.5 and the core region having a thickness of 15 μm, as measured previously (Figure II in the online-only Data Supplement).4,19,22
At 800 seconds, the measured concentration of fibrin was 10-fold greater than typical average plasma fibrinogen concentration, indicating that fresh fibrinogen was entering the core of the clot where thrombin was generated. Using the end point measurement to calibrate the dynamic fluorescence signal obtained by microscopy of venous clotting on collagen/TF, the dynamic intrathrombus fibrin concentration in the pore space of the clot is given as (Figure 4C) [fibrin, mg/mL](t)=(−7.7×10−8) t3+(1.15×10⁻⁴)t2−(6.44×10⁻³) t, for t [=] 0 to 800 seconds.
Based on this calibration of the fluorescence signal, the concentration of fibrin generated at 500 seconds because of TF was ≈15 mg/mL. This postlysis D-dimer estimate of the clot fibrin includes incorporated fibrinogen that can stably incorporate into D-dimer (even without FXIIIa cross-linking) and assumes that fibrin monomers do not escape from the clot core because of their incorporation into fibrin. FXIIIa cross-linking is expected to be substantial by the end of the 800-second experiment. For fibrin at a density of 15 mg/mL, the calculated fibrin porosity is εfibrin=0.95, based on a fibrin fiber density of 280 mg fibrin/mL fiber.23
In Figure 4C, the variability in dynamic fibrin fluorescence across 10 healthy human donors was ≈±50% coefficient of variation (CV), which was greater than the 8% CV of the D-dimer ELISA and the intrachip clotting/flowrate/sampling error of ≈15% CV. The D-dimer end point assay was used to calibrate the average dynamic fibrin fluorescence (Figure 4C and 4D) because the 2 signals were highly correlated in individual donor measurements (R2=0.9592). Similar to the magnitude of the interdonor variability of the fibrin fluorescence signal, the interdonor variability of the D-dimer end point assay was ≈±40% CV (Figure 4C and 4D).
In a separate control experiment using FPA ELISA to corroborate the D-dimer end point data, we measured the dynamics of FPA generation from 0 to 800 seconds. Assuming 1 FPA/fibrin monomer, the FPA assay was calculated to produce slightly less fibrin than indicated by the independently measured D-dimer assay, albeit within the interdonor variation of the measurements (Figure 4D). Assuming 2 FPA/fibrin monomer (dashed line), the FPA assay predicted only about a third as much fibrin as the D-dimer end point assay. The difference between the FPA assay and D-dimer assay might be explained by (1) different donors used for each assay and (2) the incorporation into the fibrin of fibrinogen, single-cleavage des(A)-fibrin monomer, or even small amounts of des(B)-fibrin monomer.
Intrathrombus Fibrin/Thrombin Ratio Demonstrates Thrombin Has a Short Half-Life <100 ms
By measuring the thrombin flux with time (Figure 4A) with F1.2 assay as fibrin is made dynamically (Figure 4C), it is possible to determine the total amount of thrombin and fibrin made during the assay. By 500 seconds before the contact pathway engages, a total of 92 000 molecules of thrombin and 203 000 molecules of fibrin were generated per single molecule of TF (or per μm2 of surface area). By TAT assay, it is estimated that 15% of the thrombin can escape the clot as detectable TAT and that most (≈70%) of this escaping thrombin complexes with antithrombin with 30% captured by other inhibitors and undetected by TAT assay. Assuming that all fibrin monomers are captured within the fibrin of the clot, the ratio of intrathrombus fibrin to thrombin was remarkably low. There were only ≈3 fibrin monomer equivalents generated per thrombin molecule. Regarding FPA generation, the overall rate R is given as R=kcat×[(So/[So+Km])] where So=αA-chains=2[fibrinogen]. For kcat=77 s−1 and Km=5.7 μM24 or kcat=84 s−1 and Km=7.2 μM,25 the overall rate is R=60 FPA per thrombin per second. For this rate of generation of desA-fibrin monomer by thrombin-mediated release of FPA of 60 FPA per thrombin per second,24,25 the average lifetime of thrombin in the thrombus can be estimated to be ≈100 ms by
[72 300 thrombin]×(60 FPA/thrombin−second)×(average lifetime)=203 000 fibrin monomers×(2 FPA/monomer)
For a half-life t1/2 ≈0.693 (average lifetime), the half-life of thrombin in a clot with fibrin is t1/2 ≈ 70 ms, considerably shorter than the protein diffusional escape time of ≈5 to 10 seconds as calculated by simulation26 or measured with flash-activated albumin in clots.27 The short half-life of 70 ms is fully consistent with typical association rates of proteins with each other and the observation that almost all of the thrombin is captured by fibrin with minimal elution out of the clot.7
Calculation of Free Thrombin Within the Clot Assuming Equilibrium With Fibrin
Based on F1.2, TAT, and D-dimer assay, the concentrations within the core pore space of the clot at 500 seconds were estimated to be 15 μM thrombin and 45 μM fibrin (Figure 5). Both these intrathrombus concentrations were considerably greater than the plasma concentration of prothrombin (1.4 μM) and fibrinogen (9 μM). From the TAT assay, intraclot fibrin displayed ample capacity to bind substantial amounts of endogeneously generated thrombin. Based on equilibrium of 15 μM thrombin with 45 μM fibrin that presents 72 μM weak sites and 13.5 μM strong sites,12 we calculated that the free concentration of thrombin within the clot core was on the order of 100 to 200 nmol/L (≈10–20 U/mL) for a γ′-site Kd of ≈0.2 μM.
Figure 5.
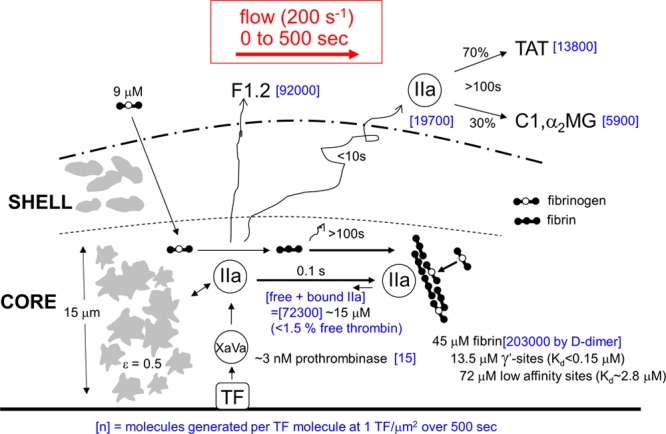
Transient mass balance for production in the thrombus core (15-μm thick, porosity ≈0.5) of thrombin and fibrin during 500 s of venous thrombosis on collagen/TF (tissue factor). During 500 s, the copy number [blue] per unit area of 1 μm2 (at 1 TF per μm2) in a pore volume of 7.5 μm3 was calculated for total thrombin generation (based on F1.2 [prothrombin fragment 1.2] assay), amount of thrombin escape in the presence of fibrin (based on TAT [thrombin–antithrombin complex] assay), deposited fibrin (based on D-dimer assay), and active prothrombinase (based on known kinetic constants29).
However, the value of Kd for endogeneously generated thrombin incorporated into endogenously generated fibrin may be different from values obtained with exogenously added thrombin and may depend on the exact concentration and polymerization conditions of thrombin and fibrin used in the measurement. The lack of washout of fluorescein-PPACK–stained fibrin during 7 minutes (Figure 3) was indicative of a slow off-rate. Given the lack of measurements on extremely high-density intrathrombus fibrin, we explored computationally (Methods in the online-only Data Supplement) a range of Kd values for the γ′-site, assuming the weak site in the E-domain was between 1 and 5 μM (Figure 6). Free intrathrombus thrombin concentrations were calculated to range from ≈20 to 200 nmol/L under conditions of tighter binding (γ′-site Kd, ≈1–50 nmol/L). These estimates do not include binding of free thrombin to platelet GP (glycoprotein) Ibα (Kd≈100 nmol/L) or consumption by fibrin-linked α2-macroglobulin or α1-antitrypsin.28
Figure 6.
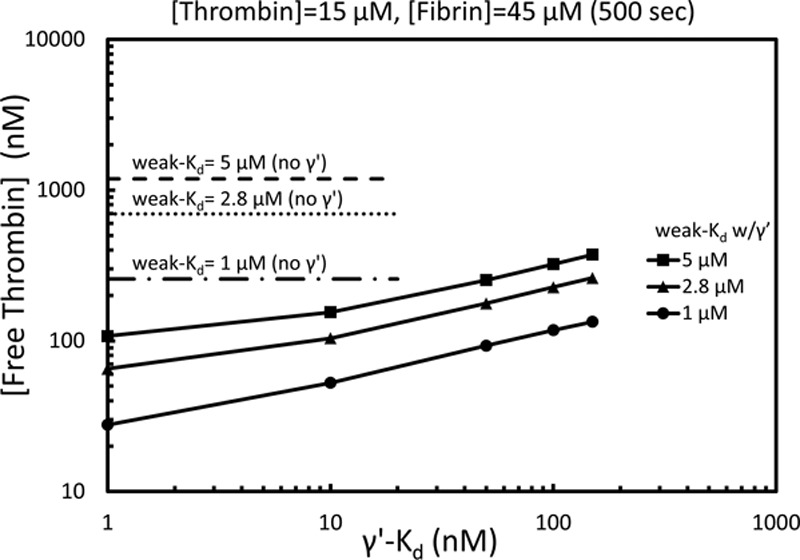
Calculation of free thrombin within the pore volume of the thrombus core at 500 s based on a total thrombin concentration of 15 μM and total fibrin concentration of 45 μM. The free thrombin concentration is shown for weak sites (E-domain) only with Kd of 2.8, 5 μM (dotted lines) or for weak sites in combination with the γ′-site with the γ′-Kd varied from 1 to 200 nmol/L (solid lines for weak Kd of 1 μM [circle], 2.8 μM [triangle], or 5 μM [square]). The weak and γ′-site concentrations were calculated to be 72 and 13.5 μM, respectively.12
Using known kinetic constants,29 we calculated that ≈15 molecules of active prothrombinase (Xa/Va) per μm2 were produced during the first 500 seconds of clotting to generate 92 000 molecules of thrombin (Methods in the online-only Data Supplement). For a core height of δ=15 μm and porosity ε=0.5, the platelet volume of the core (7.5 μm3) per 1 μm2 contains approximately the equivalent volume of a single platelet (≈10 μm3). By 500 seconds, there were ≈15 active prothrombinase complexes per platelet. Based on the half-lives of FXa and prothrombinase, it is likely that ≈102 molecules of Xa, Xa/Va, inhibited-Xa, and inhibited-Xa/Va were made per platelet during the 500-second distal of 1 molecule of TF. Interestingly, the effective concentration of 1 molecule of TF per 7.5 μm3 pore volume in the core corresponds to a relatively high TF concentration of 220 pmol/L.
Discussion
Blood clotting on a procoagulant surface under flow involves hundreds of reactions within activating platelets and the coagulating plasma. The autocatalytic nature of coagulation is remarkable, with a single molecule of TF found to generate 92 000 molecules of thrombin during a 500-second clotting window. This generation of thrombin was first measured7 using TAT assay in the absence of fibrin using GPRP. We now confirm this measurement using F1.2 assay as a gold standard for the first measurement of thrombin generation in the presence of fibrin polymerization under flow conditions. Clearly, fresh prothrombin can enter the clot. Using the D-dimer assay, the first measurement of intrathrombus fibrin concentration revealed that fresh fibrinogen substrate can also continually enter the clot and be converted to fibrin monomer and incorporated into fibrin. While the binding of thrombin into fibrin has been studied in the literature,30 the conditions of a thrombus formed under flow are unique relative to those found in a tube of clotting blood or plasma. Clearly, γ′-fibrin can bind endogeneously produced thrombin to a significant extent (Figures 2 and 3). The intrathrombus concentration of fibrin is high (5–10×), relative to fibrinogen levels in plasma. Although fibrin-bound thrombin is active against small peptide substrates and protected against antithrombin, fibrin-bound thrombin has relatively little activity against fibrinogen (showing only ≈1%–10% conversion of fibrinogen during 30 minutes by fibrin-bound thrombin31,32). Clot-bound thrombin may also have some potential role in wound healing. Unique to a thrombus formed under flow, free thrombin was predicted to have a short half-life because of fibrin binding and a low fibrin generating yield of only a few fibrin monomers per thrombin molecule. Prior computer simulations of TF-activated platelet-rich plasma clotting in a tube have considered combined production of thrombin and fibrin.16 However, most flow simulations predict thrombin to elute from the clot followed by a slower inhibition by antithrombin17–19 with little consideration of γ′-fibrin binding of thrombin. In this flow assay, the addition of high-dose heparin (4 U/mL) was found to ablate fibrin formation, indicating that the FXa-ATIII (antithrombin III), FXa/Va-ATIII, and thrombin-ATIII reactions can be catalyzed to outcompete fibrin monomer generation by thrombin. For example, heparin is known to accelerate ATIII inhibition of thrombin by >1000-fold33 and FXa/Va by 4800-fold.34 The data presented in Figure 4 should allow improved validation of simulations that seek to predict dynamic concentrations of prothrombinase (FXa/FVa), intrathrombus thrombin, and fibrin polymerization, as well as FXIa-mediated pathways that occur between 500 and 800 seconds of clotting.
In this transient mass balance, we sought to account for all the thrombin molecules and fibrin monomers that are generated on a surface over time. It is a transient mass balance because the system is never at steady state (eg, the thrombin flux increases with time in Figure 4A). We used various proxies including TAT, F1.2, FPA, and D-dimer to obtain a consistent view that (1) F1.2 and FPA leave the clot even when fibrin is made, (2) almost all the thrombin in the clot is captured by the deposited fibrin via tight binding with γ′-fibrin, and (3) thrombin is short lived within the clot because of the antithrombin-I activity of fibrin. While the role of γ′-fibrinogen in arterial thrombosis is less established, it is increasingly clear that low levels of γ′-fibrinogen are a risk factor for venous thrombosis.35,36 Using human blood, we have observed previously that γ′-fibrin has an important role in limiting clot growth under venous flow conditions.5 In future work on clotting under venous and arterial flow conditions, the effects of low and high γ′-fibrinogen levels on thrombin production, fibrin production, fibrin/thrombin ratio, and clot growth rate may prove clinically relevant, particularly in acute-phase response states where γ′-fibrinogen levels can change.37
Acknowledgments
S. Zhu and J. Chen conducted all experiments, and S.L. Diamond designed the study. All authors contributed to the writing of the manuscript.
Sources of Funding
This research was funded by National Institutes of Health grants R01 HL103419 and U01-HL-131053 (S.L. Diamond).
Disclosures
None.
Nonstandard Abbreviations and Acronyms
- CTI
- corn trypsin inhibitor
- F1.2
- prothrombin fragment 1.2
- FPA
- fibrinopeptide-A
- GPRP
- gly-pro-arg-pro
- PPACK
- Phe-Pro-Arg-chloromethylketone
- TAT
- thrombin–antithrombin complex
- TF
- tissue factor
The online-only Data Supplement is available with this article at http://atvb.ahajournals.org/lookup/suppl/doi:10.1161/ATVBAHA.118.310906/-/DC1.
Highlights
Under venous blood flow over collagen/tissue factor, the intrathrombus coregulation of thrombin and fibrin was measured.
In the clot core, fibrin reached 15 and 30 mg/mL at 500 and 800 seconds, respectively, many folds higher than plasma fibrinogen levels.
Intrathrombus thrombin reached a concentration of 15 μM by 500 seconds; however, ≈99% of this thrombin was sequestered by γ-prime fibrin.
References
- 1.Stalker TJ, Traxler EA, Wu J, Wannemacher KM, Cermignano SL, Voronov R, Diamond SL, Brass LF. Hierarchical organization in the hemostatic response and its relationship to the platelet-signaling network. Blood. 2013;121:1875–1885. doi: 10.1182/blood-2012-09-457739. doi: 10.1182/blood-2012-09-457739. [DOI] [PMC free article] [PubMed] [Google Scholar]
- 2.Welsh JD, Poventud-Fuentes I, Sampietro S, Diamond SL, Stalker TJ, Brass LF. Hierarchical organization of the hemostatic response to penetrating injuries in the mouse macrovasculature. J Thromb Haemost. 2017;15:526–537. doi: 10.1111/jth.13600. doi: 10.1111/jth.13600. [DOI] [PMC free article] [PubMed] [Google Scholar]
- 3.Welsh JD, Colace TV, Muthard RW, Stalker TJ, Brass LF, Diamond SL. Platelet-targeting sensor reveals thrombin gradients within blood clots forming in microfluidic assays and in mouse. J Thromb Haemost. 2012;10:2344–2353. doi: 10.1111/j.1538-7836.2012.04928.x. doi: 10.1111/j.1538-7836.2012.04928.x. [DOI] [PMC free article] [PubMed] [Google Scholar]
- 4.Muthard RW, Diamond SL. Side view thrombosis microfluidic device with controllable wall shear rate and transthrombus pressure gradient. Lab Chip. 2013;13:1883–1891. doi: 10.1039/c3lc41332b. doi: 10.1039/c3lc41332b. [DOI] [PMC free article] [PubMed] [Google Scholar]
- 5.Muthard RW, Welsh JD, Brass LF, Diamond SL. Fibrin, γ’-fibrinogen, and transclot pressure gradient control hemostatic clot growth during human blood flow over a collagen/tissue factor wound. Arterioscler Thromb Vasc Biol. 2015;35:645–654. doi: 10.1161/ATVBAHA.114.305054. doi: 10.1161/ATVBAHA.114.305054. [DOI] [PMC free article] [PubMed] [Google Scholar]
- 6.Tomaiuolo M, Stalker TJ, Welsh JD, Diamond SL, Sinno T, Brass LF. A systems approach to hemostasis: 2. Computational analysis of molecular transport in the thrombus microenvironment. Blood. 2014;124:1816–1823. doi: 10.1182/blood-2014-01-550343. doi: 10.1182/blood-2014-01-550343. [DOI] [PMC free article] [PubMed] [Google Scholar]
- 7.Zhu S, Lu Y, Sinno T, Diamond SL. Dynamics of thrombin generation and flux from clots during whole human blood flow over collagen/tissue factor surfaces. J Biol Chem. 2016;291:23027–23035. doi: 10.1074/jbc.M116.754671. doi: 10.1074/jbc.M116.754671. [DOI] [PMC free article] [PubMed] [Google Scholar]
- 8.Mosesson MW, Finlayson JS, Umfleet RA, Galanakis D. Human fibrinogen heterogeneities. I. Structural and related studies of plasma fibrinogens which are high solubility catabolic intermediates. J Biol Chem. 1972;247:5210–5219. [PubMed] [Google Scholar]
- 9.Mosesson MW. Update on antithrombin I (fibrin). Thromb Haemost. 2007;98:105–108. [PubMed] [Google Scholar]
- 10.Liu CY, Nossel HL, Kaplan KL. The binding of thrombin by fibrin. J Biol Chem. 1979;254:10421–10425. [PubMed] [Google Scholar]
- 11.Lovely RS, Moaddel M, Farrell DH. Fibrinogen gamma’ chain binds thrombin exosite II. J Thromb Haemost. 2003;1:124–131. doi: 10.1046/j.1538-7836.2003.00027.x. [DOI] [PubMed] [Google Scholar]
- 12.Haynes LM, Orfeo T, Mann KG, Everse SJ, Brummel-Ziedins KE. Probing the dynamics of clot-bound thrombin at venous shear rates. Biophys J. 2017;112:1634–1644. doi: 10.1016/j.bpj.2017.03.002. doi: 10.1016/j.bpj.2017.03.002. [DOI] [PMC free article] [PubMed] [Google Scholar]
- 13.Bänninger H, Lämmle B, Furlan M. Binding of alpha-thrombin to fibrin depends on the quality of the fibrin network. Biochem J. 1994;298:157–163. doi: 10.1042/bj2980157. [DOI] [PMC free article] [PubMed] [Google Scholar]
- 14.Brass LF, Diamond SL. Transport physics and biorheology in the setting of hemostasis and thrombosis. J Thromb Haemost. 2016;14:906–917. doi: 10.1111/jth.13280. doi: 10.1111/jth.13280. [DOI] [PMC free article] [PubMed] [Google Scholar]
- 15.Hockin MF, Jones KC, Everse SJ, Mann KG. A model for the stoichiometric regulation of blood coagulation. J Biol Chem. 2002;277:18322–18333. doi: 10.1074/jbc.M201173200. doi: 10.1074/jbc.M201173200. [DOI] [PubMed] [Google Scholar]
- 16.Chatterjee MS, Denney WS, Jing H, Diamond SL. Systems biology of coagulation initiation: kinetics of thrombin generation in resting and activated human blood. PLoS Comput Biol. 2010;6:1000950. doi: 10.1371/journal.pcbi.1000950. [DOI] [PMC free article] [PubMed] [Google Scholar]
- 17.Kuharsky AL, Fogelson AL. Surface-mediated control of blood coagulation: the role of binding site densities and platelet deposition. Biophys J. 2001;80:1050–1074. doi: 10.1016/S0006-3495(01)76085-7. doi: 10.1016/S0006-3495(01)76085-7. [DOI] [PMC free article] [PubMed] [Google Scholar]
- 18.Fogelson AL, Hussain YH, Leiderman K. Blood clot formation under flow: the importance of factor XI depends strongly on platelet count. Biophys J. 2012;102:10–18. doi: 10.1016/j.bpj.2011.10.048. doi: 10.1016/j.bpj.2011.10.048. [DOI] [PMC free article] [PubMed] [Google Scholar]
- 19.Lu Y, Lee MY, Zhu S, Sinno T, Diamond SL. Multiscale simulation of thrombus growth and vessel occlusion triggered by collagen/tissue factor using a data-driven model of combinatorial platelet signalling. Math Med Biol. 2017;34:523–546. doi: 10.1093/imammb/dqw015. doi: 10.1093/imammb/dqw015. [DOI] [PMC free article] [PubMed] [Google Scholar]
- 20.Maloney SF, Brass LF, Diamond SL. P2Y12 or P2Y1 inhibitors reduce platelet deposition in a microfluidic model of thrombosis while apyrase lacks efficacy under flow conditions. Integr Biol (Camb) 2010;2:183–192. doi: 10.1039/b919728a. doi: 10.1039/b919728a. [DOI] [PMC free article] [PubMed] [Google Scholar]
- 21.Zhu S, Travers RJ, Morrissey JH, Diamond SL. FXIa and platelet polyphosphate as therapeutic targets during human blood clotting on collagen/tissue factor surfaces under flow. Blood. 2015;126:1494–1502. doi: 10.1182/blood-2015-04-641472. doi: 10.1182/blood-2015-04-641472. [DOI] [PMC free article] [PubMed] [Google Scholar]
- 22.Colace TV, Muthard RW, Diamond SL. Thrombus growth and embolism on tissue factor-bearing collagen surfaces under flow: role of thrombin with and without fibrin. Arterioscler Thromb Vasc Biol. 2012;32:1466–1476. doi: 10.1161/ATVBAHA.112.249789. doi: 10.1161/ATVBAHA.112.249789. [DOI] [PMC free article] [PubMed] [Google Scholar]
- 23.Carr ME, Jr, Hermans J. Size and density of fibrin fibers from turbidity. Macromolecules. 1978;11:46–50. doi: 10.1021/ma60061a009. [DOI] [PubMed] [Google Scholar]
- 24.Vindigni A, Di Cera E. Release of fibrinopeptides by the slow and fast forms of thrombin. Biochemistry. 1996;35:4417–4426. doi: 10.1021/bi952834d. doi: 10.1021/bi952834d. [DOI] [PubMed] [Google Scholar]
- 25.Higgins DL, Lewis SD, Shafer JA. Steady state kinetic parameters for the thrombin-catalyzed conversion of human fibrinogen to fibrin. J Biol Chem. 1983;258:9276–9282. [PubMed] [Google Scholar]
- 26.Voronov RS, Stalker TJ, Brass LF, Diamond SL. Simulation of intrathrombus fluid and solute transport using in vivo clot structures with single platelet resolution. Ann Biomed Eng. 2013;41:1297–1307. doi: 10.1007/s10439-013-0764-z. doi: 10.1007/s10439-013-0764-z. [DOI] [PMC free article] [PubMed] [Google Scholar]
- 27.Welsh JD, Stalker TJ, Voronov R, Muthard RW, Tomaiuolo M, Diamond SL, Brass LF. A systems approach to hemostasis: 1. The interdependence of thrombus architecture and agonist movements in the gaps between platelets. Blood. 2014;124:1808–1815. doi: 10.1182/blood-2014-01-550335. doi: 10.1182/blood-2014-01-550335. [DOI] [PMC free article] [PubMed] [Google Scholar]
- 28.Talens S, Leebeek FWG, Demmers JAA, Rijken DC. Identification of fibrin clot-bound plasma proteins. PLoS One. 2012;7:e41966. doi: 10.1371/journal.pone.0041966. [DOI] [PMC free article] [PubMed] [Google Scholar]
- 29.Leiderman K, Fogelson AL. Grow with the flow: a spatial-temporal model of platelet deposition and blood coagulation under flow. Math Med Biol. 2011;28:47–84. doi: 10.1093/imammb/dqq005. doi: 10.1093/imammb/dqq005. [DOI] [PMC free article] [PubMed] [Google Scholar]
- 30.Elizondo P, Fogelson AL. A mathematical model of venous thrombosis initiation. Biophys J. 2016;111:2722–2734. doi: 10.1016/j.bpj.2016.10.030. doi: 10.1016/j.bpj.2016.10.030. [DOI] [PMC free article] [PubMed] [Google Scholar]
- 31.Fredenburgh JC, Stafford AR, Leslie BA, Weitz JI. Bivalent binding to gammaA/gamma’-fibrin engages both exosites of thrombin and protects it from inhibition by the antithrombin-heparin complex. J Biol Chem. 2008;283:2470–2477. doi: 10.1074/jbc.M707710200. doi: 10.1074/jbc.M707710200. [DOI] [PubMed] [Google Scholar]
- 32.Weitz JI, Hudoba M, Massel D, Maraganore J, Hirsh J. Clot-bound thrombin is protected from inhibition by heparin-antithrombin III but is susceptible to inactivation by antithrombin III-independent inhibitors. J Clin Invest. 1990;86:385–391. doi: 10.1172/JCI114723. doi: 10.1172/JCI114723. [DOI] [PMC free article] [PubMed] [Google Scholar]
- 33.Tsiang M, Jain AK, Gibbs CS. Functional requirements for inhibition of thrombin by antithrombin III in the presence and absence of heparin. J Biol Chem. 1997;272:12024–12029. doi: 10.1074/jbc.272.18.12024. [DOI] [PubMed] [Google Scholar]
- 34.Ellis V, Scully MF, Kakkar VV. The acceleration of the inhibition of platelet prothrombinase complex by heparin. Biochem J. 1986;233:161–165. doi: 10.1042/bj2330161. [DOI] [PMC free article] [PubMed] [Google Scholar]
- 35.Uitte de Willige S, de Visser MC, Houwing-Duistermaat JJ, Rosendaal FR, Vos HL, Bertina RM. Genetic variation in the fibrinogen gamma gene increases the risk for deep venous thrombosis by reducing plasma fibrinogen gamma’ levels. Blood. 2005;106:4176–4183. doi: 10.1182/blood-2005-05-2180. [DOI] [PubMed] [Google Scholar]
- 36.Macrae FL, Domingues MM, Casini A, Ariëns RA. The (patho)physiology of fibrinogen γ’. Semin Thromb Hemost. 2016;42:344–355. doi: 10.1055/s-0036-1572353. doi: 10.1055/s-0036-1572353. [DOI] [PubMed] [Google Scholar]
- 37.Cheung EY, Vos HL, Kruip MJ, den Hertog HM, Jukema JW, de Maat MP. Elevated fibrinogen gamma’ ratio is associated with cardiovascular diseases and acute phase reaction but not with clinical outcome. Blood. 2009;114:4603–4604; author reply 46044605. doi: 10.1182/blood-2009-08-236240. doi: 10.1182/blood-2009-08-236240. [DOI] [PubMed] [Google Scholar]