Abstract
Several studies reported platelet-to-lymphocytes ratio (PLR), neutrophil-to-lymphocyte ratio (NLR) and red blood cell distribution width (RDW) were associated with the mid-term survival or cancer stage in pancreatic cancer. However, the relationship between these markers and the long-term prognosis of pancreatic cancer is still unknown. We investigated the relationship between PLR, NLR, RDW, and the long-term prognosis of pancreatic cancer.
We included 182 pancreatic cancer patients who received operation at Linzi District People 's Hospital between August 2010 and January 2017. PLR, NLR, and RDW control data was obtained from 150 health volunteers from January 2011 to January 2017. Blood biochemical data before operation, preoperative computed tomography information, and pathological data of the pancreatic cancer patients were retrospectively collected for further analysis. Independent long-term prognostic significance of PLR, NLR, and RDW were analyzed in pancreatic cancer patients.
PLR, NLR, and RDW were significantly increased in pancreatic cancer group compared with the control. Receiver operating characteristic (ROC) curve analysis showed the optimal cut-off values of PLR, NLR, and RDW were 150, 1.73, and 13.2 respectively. Overall survival (OS) analysis showed pancreatic cancer patients with PLR≥150 (median time, 24 vs 37.5 months, P = .005) or RDW≥13.2 (median time, 27 months vs 37.5 months, P = .018) had lower postoperative 5 year OS compared with pancreatic cancer patients with PLR<150 or RDW<13.2. Univariate and multivariable Cox regression analysis for postoperative 5 year OS data showed PLR≥150 (HR = 2.451, 95% CI 1.215–4.947; P = .012) was still associated with the OS independently. Disease free survival (DFS) analysis showed pancreatic cancer patients with PLR≥150 (median time, 24 months vs 38 months, P = .002) or RDW≥13.2 (median time, 24 months vs 37.5 months, P = .006) had lower postoperative 5 year DFS compared with pancreatic cancer patients with PLR<150 or RDW<13.2. Univariate and multivariable Cox regression analysis for postoperative 5 year DFS data showed PLR≥150 (HR = 2.712, 95% CI 1.367–5.379; P = .004) was independently associated with the DFS.
In the present study, we find hematological biomarkers PLR≥150 is an independently predictive risk factor for the postoperative long-term prognosis in pancreatic cancer patients. Our study may provide a convenient way for the prognostic assessment of pancreatic cancer patients.
Keywords: long-term prognosis, operation, pancreatic cancer, PLR
1. Introduction
Pancreatic cancer is one of the most deadly diseases with very poor prognosis. It was reported its overall survival rate was only about 8% at 5 years after diagnosis and pancreatic cancer would become the second leading cause of cancer death in United States in 2030.[1] Surgical intervention is the only effective treatment for pancreatic cancer[2]; however, pancreatic cancer is almost impossible to be completely cured.[3]
It was reported pancreatic cancer cells interacted with the host immune system and resulted in a decreased lymphocytes ratio and inflammatory circulating markers were associated with the outcome of pancreatic cancer.[4] Asari et al[5] reported higher preoperative platelet-to-lymphocytes ratio (PLR) predicted lower mid-term outcomes in borderline resectable pancreatic cancer patients. Piciucchi et al[6] found elevated neutrophil-to-lymphocyte ratio (NLR) was associated with poor mid-term survival in patients with metastatic pancreatic cancer. These studies indicated PLR and NLR might be related with the long-term prognosis in pancreatic cancer patients.
As a main descriptive parameter for erythrocyte variation, increased red blood cell distribution width (RDW) was associated with poor prognosis in some diseases. Li et al[7] reported increased RDW predicted higher risk for coronary heart disease induced arrhythmia. Yilmaz et al[8] found RDW was associated with the stage of pancreatic cancer. But the relation between RDW and the long-term survival in pancreatic cancer patients has not been investigated.
In the present study, we retrospectively investigated changes of PLR, NLR, and RDW and whether they were associated with the long-term prognosis in patients with pancreatic cancer.
2. Patients and methods
2.1. Patients
From August 2010 to January 2017, 182 pancreatic cancer patients who received operation at Linzi District People 's Hospital was included in this study, details of the patient number in each part were shown in Figure 1. PLR, NLR, and RDW control data were obtained from 150 health volunteers from January 2011 to January 2017. Pancreatic cancer was confirmed with the pathologic diagnosis from the primary pancreatic lesion. Blood biochemical data before operation, preoperative computed tomography information, and pathological data of the patients were collected for further analysis. The pathological and clinical stages were assessed according to the TNM classification system and NCCN guidelines, respectively. Survival data were collected by clinical or telephone follow-up. This study was approved by the Institutional Review Board of Linzi District People 's Hospital.
Figure 1.
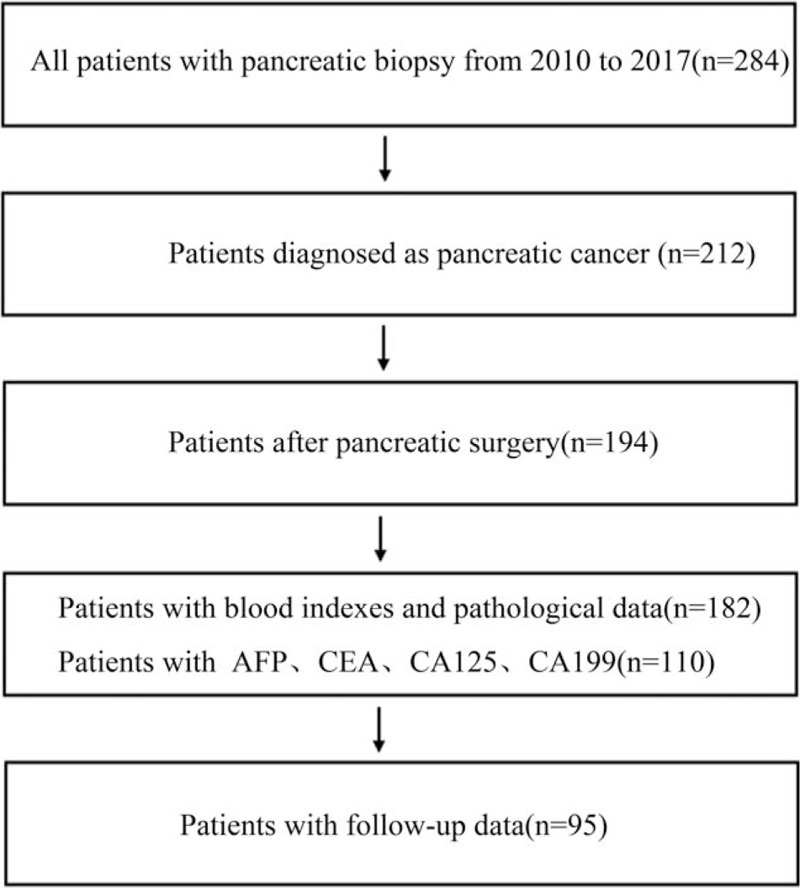
The flow chart of the study.
2.2. Statistical analysis
Statistical Package for Social Sciences, version 21.0 (SPSS, Chicago, IL) was used for statistical analysis. For non-normally distributed continuous variables, non-parametric Mann–Whitney U test was used for 2 group comparison. For categorical variables, chi-square test was used to test statistical differences. Optimal cut-off values for PLR, NLR, and RDW were determined by receiver operating characteristic (ROC) curve and the area under the curve (AUC). Disease free survival (DFS) was defined as the time from the date of pancreatic cancer diagnosis to the date of first recurrence after operation. Overall survival (OS) was defined as the time from the date of operation to the date of death or last follow-up. DFS and OS in 2 groups divided by PLR, NLR, or RDW were compared with Kaplan–Meier estimation with the log-rank test. Multivariate Cox proportional hazard model was used to examine risk factors found by the univariate analysis. Hazard ratio (HR) and 95% confidence intervals (CI) were calculated for comparison. Data were presented as mean ± SD, n (%) or HR (95%CI). P < .05 was considered statistically significant.
3. Results
3.1. Clinicopathological characteristics comparison and optimal cut-off values for PLR, NLR, and RDW
We first compared PLR, NLR, and RDW between pancreatic cancer group (n = 182) and the control group (n = 150). Results showed PLR, NLR, and RDW were significantly increased in pancreatic cancer group (154.6 ± 64.97 vs 106.75 ± 27.09, 2.69 ± 1.44 vs 1.65 ± 0.52 and 13.53 ± 1.40 vs 12.62 ± 0.75, respectively; Fig. 2). Then the optimal cut-off values of PLR, NLR, and RDW were determined by an ROC curve analysis. Around 182 pancreatic cancer patients underwent surgical resection were included in this analysis. Results showed the optimal cut-off values of PLR, NLR, and RDW were 150, 1.73, and 13.2 while the AUC of PLR, NLR, and RDW were 0.742, 0.779, and 0.708 (Fig. 3). Finally, pancreatic cancer patients were divided into 2 groups according to the cut-off values of PLR, NLR, and RDW and their clinicopathological characteristics were compared. Results showed there were no significant differences between PLR≥150 group and PLR<150 group. For the comparison between patients grouped by NLR and RDW, results showed there were more number of patients age ≥ 60 in NLR≥1.73 group compared with NLR<1.73 group (P = .026); Patients in RDW≥13.2 group had larger tumor size (P = .035), worse tumor differentiation (P = .002), more depth tumor infiltration (P < .001), worse tumor stage (P < .001) and higher CA199 (P = 0.012) compared with RDW<13.2 group; there were no significant differences in other characteristics (Table 1).
Figure 2.
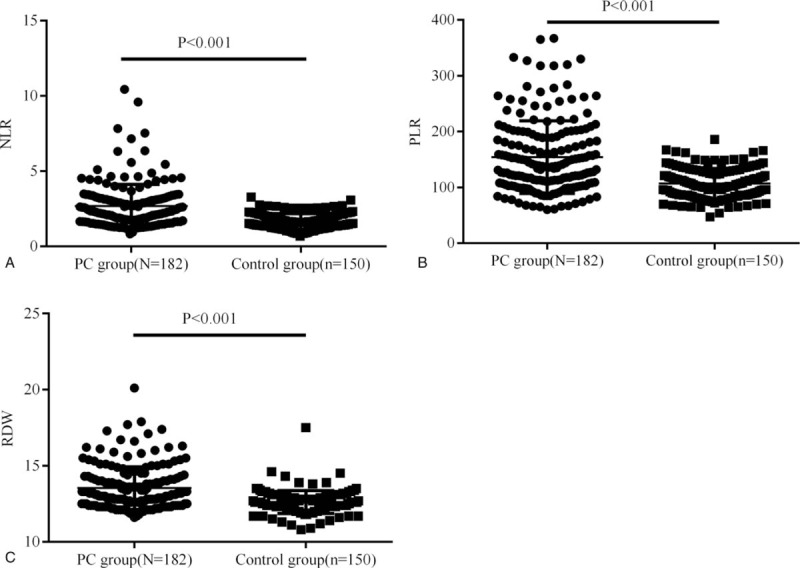
Preoperative peripheral blood NLR, PLR, and RDW between pancreatic cancer group and the control group. Results showed NLR, PLR, and RDW were significantly increased in pancreatic cancer group (N = 182) compared with the control (N = 150). NLR = neutrophil-to-lymphocyte ratio, PLR = platelet-to-lymphocytes ratio, RDW = red blood cell distribution.
Figure 3.
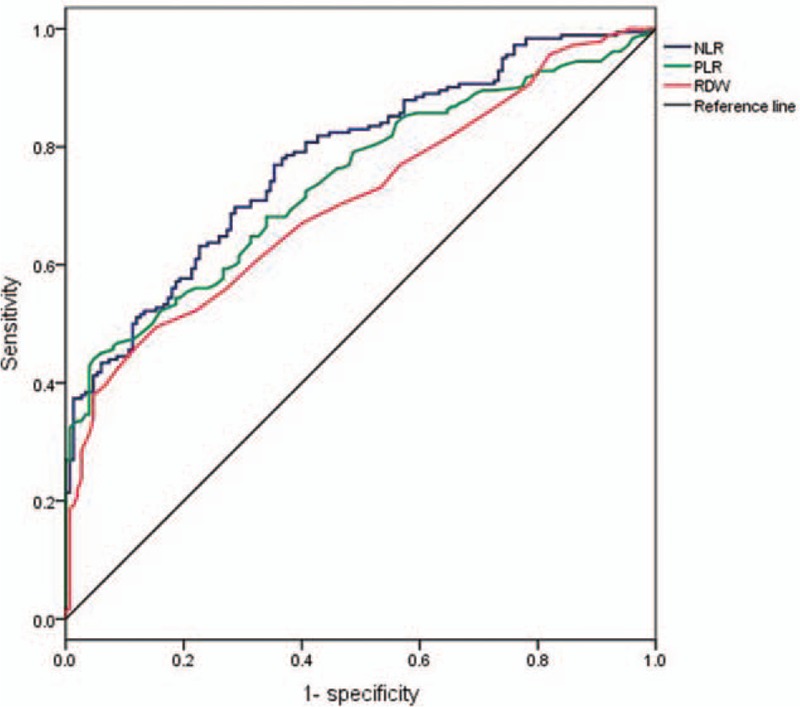
ROC analysis for survival prediction according to the preoperative NLR, PLR, and RDW. Area under ROC curves were 0.779, 0.742, and 0.708, respectively. NLR = neutrophil-to-lymphocyte ratio, PLR = platelet-to-lymphocytes ratio, RDW = red blood cell distribution, ROC = receiver operating characteristic.
Table 1.
Association of NLR, PLR, and RDW with clinicopathological characteristics.
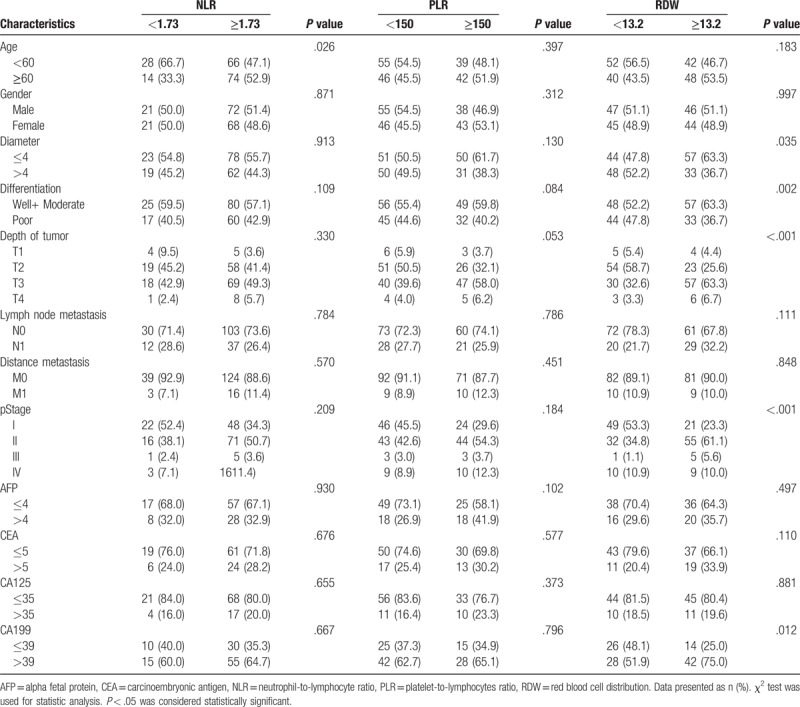
3.2. Overall survival analysis for patients grouped by PLR, NLR, and RDW
In this part, pancreatic cancer patients were grouped by the optimal cut-off values of PLR, NLR, and RDW and the OS analysis was performed with Kaplan–Meier estimation with the log-rank test between different groups. Results showed the 5 year OS rate (median time, 24 vs 37.5 months, P = .005) in PLR≥150 group (n = 37) was significantly lower than PLR<150 group (n = 58) (Fig. 4A). However, there were no significant differences in the 5 year OS rate (median time, 34 vs 34 months, P = .278) between NLR≥1.73 group (n = 24) and NLR<1.73 group (n = 71) (Fig. 4B). We finally assessed the 5 year OS rate between RDW≥13.2 group (n = 47) and RDW<13.2 group (n = 48) and found the OS was significantly lower in RDW≥13.2 group compared with RDW<13.2 group (median time, 27 months vs 37.5 months, P = .018) (Fig. 4C). Results in this part showed pancreatic cancer patients with PLR≥150 or RDW≥13.2 had a worse 5 year OS compared with pancreatic cancer patients with PLR<150 or RDW<13.2 while there were no differences in the 5 year OS between pancreatic cancer patients with NLR≥1.73 and patients with NLR<1.73.
Figure 4.
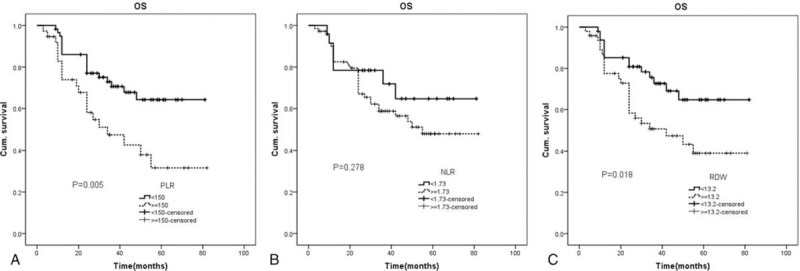
Overall survival analysis for patients grouped by PLR, NLR, and RDW. NLR = neutrophil-to-lymphocyte ratio, PLR = platelet-to-lymphocytes ratio, RDW = red blood cell distribution.
3.3. Univariate and multivariable Cox regression analysis for OS in pancreatic cancer patients
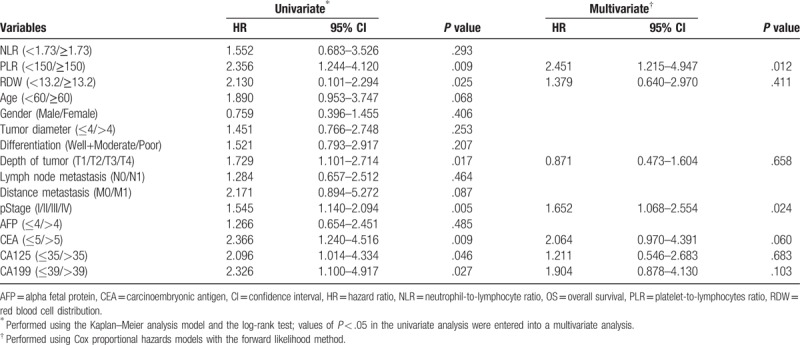
We first did univariate Cox regression analysis for OS in pancreatic cancer patients included in the present study. Results showed the PLR (P = .009), RDW (P = .025), depth of tumor (P = .017), pStage (P = .005), carcinoembryonic antigen (CEA) (P = .009), CA125 (P = .046), and CA199 (P = .027) were significantly associated with the OS. Then these 6 factors were included into the multivariable Cox regression analysis. Results showed preoperative PLR≥150 (HR = 2.451, 95% CI 1.215–4.947; P = .012) and preoperative pStage (HR = 1.652, 95% CI 1.068–2.554; P = .024) were still associated with the OS independently. Detail results in this part were shown in Table 2.
Table 2.
Univariate and multivariable Cox regression analyses for OS in 182 patients with pancreatic cancer.
3.4. Disease free survival analysis for patients grouped by PLR, NLR, and RDW
In this part, we adopted Kaplan–Meier analysis with the log-rank test to analysis the DFS in patients grouped by PLR, NLR, and RDW. Results showed the 5 year DFS rates (median time, 24 months vs 38 months, P = .002) were significantly lower in pancreatic cancer patients with PLR≥150 (n = 37) than patients with PLR<150 (n = 58) (Fig. 5A). No differences (median time, 34 months vs 34 months, P = .277) were found in the 5 year DFS between patients with NLR≥1.73 (n = 24) and patients with NLR<1.73 (n = 71) (Fig. 5B). Patients with RDW≥13.2 (n = 47) had significantly lower 5 year DFS (median time, 24 months vs 37.5 months, P = .006) compared with patients with RDW<13.2 (n = 48) (Fig. 5C).
Figure 5.
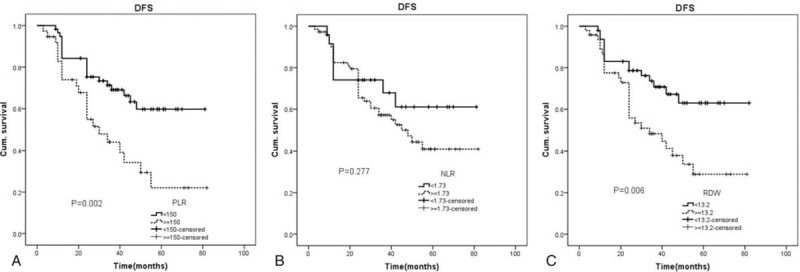
Disease free survival analysis for patients grouped by PLR, NLR, and RDW. NLR = neutrophil-to-lymphocyte ratio, PLR = platelet-to-lymphocytes ratio, RDW = red blood cell distribution.
3.5. Univariate and multivariable Cox regression analysis for DFS in pancreatic cancer patients
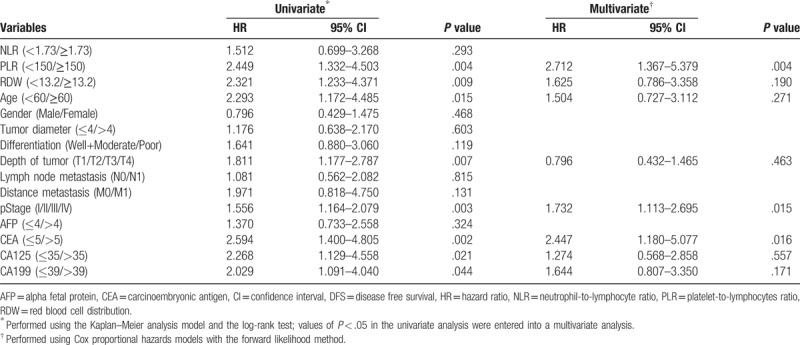
In order to find the independent prognostic factors for the postoperative DFS in pancreatic cancer patients. We first did univariate Cox regression analysis for DFS. Results showed PLR (P = .004), RDW (P = .009), age (P = .015), depth of tumor (P = .007), pStage (P = .003), CEA (P = .002), CA125 (P = .021) and CA199 (P = .044) were significantly associated with the DFS. Then these 8 preoperative factors were entered into the multivariable Cox regression analysis. Results showed PLR≥150 (HR = 2.712, 95% CI 1.367–5.379; P = .004), pStage (HR = 1.732, 95% CI 1.113–2.695; P = .015) and CEA (HR = 2.447, 95% CI 1.180–5.077; P = .016) were independently associated with the DFS. Details in this part were shown in Table 3.
Table 3.
Univariate and multivariable Cox regression analyses for DFS in 182 patients with pancreatic cancer.
4. Discussion
Pancreatic cancer is a kind of serious malignant tumor with a gradual rising morbidity, it is utility to find a relatively simple marker which is associated with the prognosis. We studied the relationship between PLR, NLR, RDW, and the long-term survival prognosis of pancreatic cancer in the present study, the results showed PLR≥150 was independently related with poor postoperative long-term OS and DFS in pancreatic cancer patients.
PLR is a clinical common hematological markers for the assessment of the inflammatory response in cancer patients since it is relatively easy to test before operation and has no adverse effect on the treatment. Previous studies showed PLR was associated with the prognosis of several kind cancers.
Kozasa et al[9] reported the pretreatment elevated PLR was independently associated with poor OS and progression-free survival in cervical cancer patients. A meta-analysis reported by Zhou et al[10] included a total of 2392 patients with biliary tract cancer and their results showed the pretreatment high PLR was an unfavorable prognostic factor for the OS. Yang et al[11] analyzed 778 patients with hepatocellular carcinoma between 2010 and 2013 and found elevated PLR before operation was independently related with poor postoperative OS and DFS. Ma et al[12] included 2340 patients with ovarian cancer into their meta-analysis to analyze the relationship between PLR and the prognosis of ovarian cancer, results showed the elevated PLR is associated with poor OS. All these previous studies showed PLR was a potentially simple and reliable biomarkers for the prediction of cancer prognosis.
We reviewed studies on the predictive role of PLR and pancreatic cancer prognosis and found PLR was associated with its prognosis. Martin et al[13] analyzed data from 124 patients with advanced pancreatic cancer and found patients with PLR≥200 had a median survival of 4 months while the median survival was 9.1 months in patients with PLR<200, which indicated elevated PLR was associated with poor median survival. In the research reported by Asari et al,[5] a total of 37 pancreatic cancer patients were included in their study and the postoperative median survival was compared, results showed patients with preoperative PLR≤225 had a median survival of 24.7 months while patients with preoperative PLR>225 had a median survival of only 10.2 months. Recently, a meta-analysis which included eight studies with 1904 pancreatic cancer patients reported by Song et al[14] showed elevated PLR was associated with decreased OS, especially in patients with PLR>150. In our study, we analyzed data from pancreatic cancer patients who received surgical treatment in our center, the prognostic value of preoperative PLR was tested and compared with other inflammation based hematological biomarkers such as NLR, RDW, CEA, CA199, and CA125. Our results showed that only PLR was independently associated with postoperative OS and DFS. Patients with PLR≥150 had a significantly lower 5 year OS and DFS compared with patients with PLR<150.
In the present study, we also found PLR was significantly increased in pancreatic cancer patients compared with the control, in addition to its association with postoperative OS and DFS. Mechanisms responsible for the increased PLR in pancreatic cancer have not been fully clarified. But some studies showed pancreatic cancer cells activated thrombocytes production while suppressed lymphocytes. Khorana et al[15] reported pancreatic cancer always induced thromboembolic disease which indicated pancreatic cancer might promoted the production of thrombocytes. Hamada et al reported pancreatic cancer tissues produced large amounts of IL-6, which activated megakaryocyte proliferation and produced more thrombocytes.[16,17] A study reported by Romano et al[18] included 22 pancreatic cancer patients, they found pancreatic cancer always accompanied by significantly decreased lymphocytes which showed a significantly immunosuppression. Bellone et al reported pancreatic cancer cells produced more transforming growth factor-β (TGF-β) and interleukin-10 (IL-10), both has been demonstrated had a significant immunosuppressive effect on lymphocytes.[19,20] These studies partly explained the increased PLR in pancreatic cancer patients and the relation between PLR and the postoperative prognosis. However, the specific mechanism for the increased thrombocytes production and lymphocytes suppression still need to be further investigated.
5. Conclusion
In the present study, we find hematological biomarkers PLR≥150 is an independently predictive risk factor for the postoperative long-term prognosis in pancreatic cancer patients. Our study may provide a convenient way for the prognostic assessment of pancreatic cancer patients.
Author contributions
Conceptualization: Jinming Yu, Shanli Liu.
Data curation: Jinming Yu, Zhaoyan Ding, Yuanming Yang, Shanli Liu.
Formal analysis: Jinming Yu, Zhaoyan Ding, Yuanming Yang.
Investigation: Jinming Yu, Yuanming Yang, Shanli Liu.
Methodology: Jinming Yu, Zhaoyan Ding, Yuanming Yang, Shanli Liu.
Writing – original draft: Jinming Yu, Shanli Liu.
Writing – review & editing: Shanli Liu.
Footnotes
Abbreviations: AUC = area under the curve, CI = confidence intervals, DFS = disease free survival, HR = hazard ratio, IL-10 = interleukin-10, NLR = neutrophil-to-lymphocyte ratio, OS = overall survival, PLR = platelet-to-lymphocytes ratio, RDW = red blood cell distribution width, ROC = receiver operating characteristic, TGF-β = transforming growth factor-β.
The authors have no conflicts of interest to disclose.
References
- [1].Siegel RL, Miller KD, Jemal A. Cancer statistics, 2016. CA Cancer J Clin 2016;66:7–30. [DOI] [PubMed] [Google Scholar]
- [2].Khatkov I, Izrailov R, Tyutyunnik P, et al. One hundred and forty five total laparoscopic pancreatoduodenectomies: a single centre experience. Pancreatology 2017;17:936–42. [DOI] [PubMed] [Google Scholar]
- [3].Loc WS, Smith JP, Matters G, et al. Novel strategies for managing pancreatic cancer. World J Gastroenterol 2014;20:14717–25. [DOI] [PMC free article] [PubMed] [Google Scholar]
- [4].Inman KS, Francis AA, Murray NR. Complex role for the immune system in initiation and progression of pancreatic cancer. World J Gastroenterol 2014;20:11160–81. [DOI] [PMC free article] [PubMed] [Google Scholar]
- [5].Asari S, Matsumoto I, Toyama H, et al. Preoperative independent prognostic factors in patients with borderline resectable pancreatic ductal adenocarcinoma following curative resection: the neutrophil-lymphocyte and platelet-lymphocyte ratios. Surg Today 2016;46:583–92. [DOI] [PubMed] [Google Scholar]
- [6].Piciucchi M, Stigliano S, Archibugi L, et al. The neutrophil/lymphocyte ratio at diagnosis is significantly associated with survival in metastatic pancreatic cancer patients. Int J Mol Sci 2017;18:4. [DOI] [PMC free article] [PubMed] [Google Scholar]
- [7].Li Y, Xiao Q, Zeng W, et al. Red blood cell distribution width is independently correlated with diurnal QTc variation in patients with coronary heart disease. Medicine (Baltimore) 2015;94:e822. [DOI] [PMC free article] [PubMed] [Google Scholar]
- [8].Yilmaz A, Malya F, Ozturk G, et al. Effect of pre-operative red blood cell distribution on cancer stage and morbidity rate in patients with pancreatic cancer. Int J Clin Exp Med 2014;7:3072–5. [PMC free article] [PubMed] [Google Scholar]
- [9].Kozasa K, Mabuchi S, Komura N, et al. Comparison of clinical utilities of the platelet count and platelet-lymphocyte ratio for predicting survival in patients with cervical cancer: a single institutional study and literature review. Oncotarget 2017;8:55394–404. [DOI] [PMC free article] [PubMed] [Google Scholar]
- [10].Zhou LH, Luo XF. Platelet to lymphocyte ratio in biliary tract cancer: review and meta-analysis. Clin Chim Acta 2017;474:102–7. [DOI] [PubMed] [Google Scholar]
- [11].Yang HJ, Jiang JH, Liu QA, et al. Preoperative platelet-to-lymphocyte ratio is a valuable prognostic biomarker in patients with hepatocellular carcinoma undergoing curative liver resection. Tumour Biol 2017;39:1010428317707375. [DOI] [PubMed] [Google Scholar]
- [12].Ma XM, Sun X, Yang GW, et al. The platelet-to-lymphocyte ratio as a predictor of patient outcomes in ovarian cancer: a meta-analysis. Climacteric 2017;20:448–55. [DOI] [PubMed] [Google Scholar]
- [13].Martin HL, Ohara K, Kiberu A, et al. Prognostic value of systemic inflammation-based markers in advanced pancreatic cancer. Intern Med J 2014;44:676–82. [DOI] [PubMed] [Google Scholar]
- [14].Song W, Tian C, Wang K, et al. Preoperative platelet lymphocyte ratio as independent predictors of prognosis in pancreatic cancer: a systematic review and meta-analysis. PLoS One 2017;12:e0178762. [DOI] [PMC free article] [PubMed] [Google Scholar]
- [15].Khorana AA, Fine RL. Pancreatic cancer and thromboembolic disease. Lancet Oncol 2004;5:655–63. [DOI] [PubMed] [Google Scholar]
- [16].Hamada S, Masamune A, Yoshida N, et al. IL-6/STAT3 plays a regulatory role in the interaction between pancreatic stellate cells and cancer cells. Dig Dis Sci 2016;61:1561–71. [DOI] [PubMed] [Google Scholar]
- [17].Alexandrakis MG, Passam FH, Moschandrea IA, et al. Levels of serum cytokines and acute phase proteins in patients with essential and cancer-related thrombocytosis. Am J Clin Oncol 2003;26:135–40. [DOI] [PubMed] [Google Scholar]
- [18].Romano F, Uggeri F, Crippa S, et al. Immunodeficiency in different histotypes of radically operable gastrointestinal cancers. J Exp Clin Cancer Res 2004;23:195–200. [PubMed] [Google Scholar]
- [19].Bellone G, Turletti A, Artusio E, et al. Tumor-associated transforming growth factor-beta and interleukin-10 contribute to a systemic Th2 immune phenotype in pancreatic carcinoma patients. Am J Pathol 1999;155:537–47. [DOI] [PMC free article] [PubMed] [Google Scholar]
- [20].Salazar-Onfray F, Lopez MN, Mendoza-Naranjo A. Paradoxical effects of cytokines in tumor immune surveillance and tumor immune escape. Cytokine Growth Factor Rev 2007;18:171–82. [DOI] [PubMed] [Google Scholar]


