Abstract
Dormant cancer cells, also referred to as quiescent, slowly cycling or “nonproliferative” cells, are believed to contribute to tumor recurrence and present a therapeutic problem because they are nonresponsive to current therapies that target proliferating cells. Concomitant tumor resistance (CTR) is the ability of a primary tumor to restrict the growth of secondary metastases. In this paper, we investigate these 2 cancer concepts using cellular magnetic resonance imaging (MRI). A new model for CTR is presented where a primary mammary fat pad tumor is generated using a human breast cancer cell line (231) and breast cancer brain metastases are generated using a cell line derived from 231 to be brain metastatic (231-BR). Iron oxide particles are used to label the 231BR cells to allow for tracking of the proliferating cells, which form metastases, and the nonproliferating cells, which remain dormant in the brain. Bioluminescence and fluorescence-activated cell sorting are used to validate the MRI data. The presence of a primary 231 mammary fat pad tumor inhibited the formation of MRI-detectable 231BR brain metastases. More iron-retaining cells persisted in the brains of mice with a primary tumor. Bioluminescence and fluorescence-activated cell sorting provide evidence that signal voids detectable by MRI on day 0 represent live, iron-labeled cells in the brain. This work shows that retention of iron by nonproliferative cancer cells can be exploited to monitor the fate of this important cell population in vivo, and it points to a new mechanism for CTR, the enhancement of dormancy by a primary tumor.
Keywords: MRI, concomitant tumor resistance, breast cancer, nanoparticles, dormancy
Introduction
Metastasis, the dissemination of cancer cells from the primary tumor and growth at secondary sites, is the major cause of mortality in patients with cancer and may occur years after successful removal of the primary tumor and adjuvant therapy. Dormant cancer cells, also referred to as quiescent, slowly cycling or ″nonproliferative″ cells, are believed to contribute to tumor recurrence (1–3). Clinical dormancy is reflected by relapses at distant sites after the original primary cancer diagnosis and remission. Dormant cancer cells also present a substantial therapeutic problem because they are quiescent and thus are nonresponsive to current therapies that only target proliferating cells (4–6). For many individuals, cancer may become dormant and not progress, while only in some, will it become a symptomatic disease. Discerning the mechanisms that either maintain prolonged cellular dormancy or activate dormant cells to a proliferative state has been a goal of scientists worldwide. However, relatively little is known about dormant cancer cells, and studying these cells is challenging, as, at present, there are few suitable in vivo assays.
The time to transition between dormancy and active metastatic growth may be governed by local (microenvironment) or systemic mechanisms. Concomitant tumor resistance (CTR) is the ability of a primary tumor to systemically restrict the growth of secondary distant metastases (7, 8). CTR has been described in human and animal systems, and it can be generated by both immunogenic and nonimmunogenic primary tumors (9). The relevance of CTR has been highlighted by numerous observations showing that the removal of human and murine tumors can be followed by an abrupt increase in metastatic growth, suggesting that a primary tumor may exert a controlling action on metastases (10). The following 3 potential mechanisms are usually cited for CTR, the primary tumor may:
Prime the immune system to assist clearance of metastatic cells.
Restrict the growth of distant metastases through production of antiangiogenic molecules.
Systemically deplete essential host factors, preventing the growth of any other tumors (athrepsia) (11).
The proliferative status of cancer cells can be interrogated in vivo using cellular magnetic resonance imaging (MRI). Cellular MRI uses magnetic agents to label specific cells, enhancing their detectability (12). The most widely used agents are iron oxide nanoparticles (13). The presence of iron in cells causes a distortion in the magnetic field and leads to signal loss in iron-sensitive images. Cells appear as discrete black regions. Even single iron-labeled cells could be detected using MRI (14, 15). Few groups have used iron nanoparticles and MRI to track cancer cells. This is because the iron nanoparticles are diluted over time in dividing cells, leading to loss of signal and therefore loss of cell detection. However, we, and others, have shown that the retention of iron particles in nonproliferative, or slowly cycling, cancer cells can be exploited to detect particular cancer cell populations (16–18). In this paper, we use cellular MRI to study CTR in a novel model of breast cancer metastasis to the brain.
Methods
Cell Culture
Human breast cancer cells (MDA-MB-231) were purchased from ATCC (Manassas, Virginia). Human brain metastatic breast cancer cells (MDA-MB-231-BR), previously transduced with enhanced green fluorescent protein, were a kind gift from Dr. Patricia Steeg's laboratory at the National Cancer Institute (Bethesda, Maryland) (19). Cells were grown in Dulbecco's Modified Eagle's Medium containing 10% fetal bovine serum (FBS), 1% antibiotics, and 0.375 mg/mL zeocin. For tracking cells in the brain by MRI, MDA-MB-231-BR cells were labeled with iron oxide nanoparticles (0.9 μm micron-sized paramagnetic iron oxide [MPIO], 62% magnetite, labeled with Flash Red; Bangs Laboratory, Fishers, Indiana) as previously described (20). Cell viability was measured by trypan blue exclusion and was not significantly different from previous experiments using unlabeled cells. Perl's Prussian Blue-stained cells were analyzed to evaluate iron labeling efficiency. The cell lines were tested for mycoplasma contamination using the MycoAlert Mycoplasma Detection Kit (Lonza, Rockland, Maine) and were found to be negative. To detect MDA-MB-231BR cells with bioluminescence imaging (BLI), cells were transduced using RediFect Red-Fluc-GFP lentiviral particles (Perkin-Elmer) at a multiplicity of infection of 50. After transduction, the cells underwent 2 rounds of fluorescence-activated cell sorting (FACS) to select for the top 5% green fluorescent protein (GFP)+ expressers.
Experimental Animals
In this study, 6- to 8-week-old female nude mice (nu/nu; Charles River Laboratories, Wilmington, Massachusetts) were housed in a barrier facility. Experiments were approved by the Animal Use Subcommittee of the University Council on Animal Care at the University of Western Ontario. Four groups of mice were studied. Mice in groups 1 and 2 (n = 8/group) received an injection of either vehicle (Hank's Balanced Salt Solution; group 1) or 500 000 unlabeled MDA-MB-231 cells (group 2) in the lower right mammary fat pad. The primary mammary fat pad tumors were allowed to grow for 15 days in group 2 at which time mice in groups 1 and 2 received an intracardiac injection of 175 000 iron-labeled MDA-MB-231-BR cells suspended in 0.1 mL of Hank's Balanced Salt Solution. All injections were performed while under anesthesia induced by isoflurane (2%). Mice in groups 3 (n = 3) and 4 (n = 2) received only MDA-MB-231BR cells via intracardiac injection and were used for BLI and FACS, respectively.
MRI
MRI was performed using a 3.0 T GE Excite MR750 clinical scanner (General Electric, Mississauga, Ontario, Canada), with a custom insertable gradient coil and a custom mouse head radiofrequency coil. Isoflurane anesthesia was used during scans, and the temperature was maintained with warm saline bags. Images were acquired using a 3-dimensional balanced steady-state free precession pulse sequence with spatial resolution = 100 × 100 × 200 μm and scan time = 35 minutes for brain imaging and spatial resolution = 200 × 200 × 200 μm and scan time = 30 minutes for body imaging. Images of the mouse brain were obtained on the day of the intracardiac injection to evaluate the initial arrest of cells in the brain and at the endpoint to evaluate metastatic growth and quantify the number of residual signal voids; the endpoint was day 30 after intracardiac injection. For group 2, the mouse body was also imaged at endpoint to evaluate the mammary fat pad tumor growth. Mice were euthanized by pentobarbital (Euthanyl) overdose after the final imaging session. Tissues were formalin-fixed, paraffin-embedded and sectioned with image guidance. Hematoxylin and eosin staining was used to visualize basic morphology. Figure 1 illustrates the imaging experiments.
Figure 1.
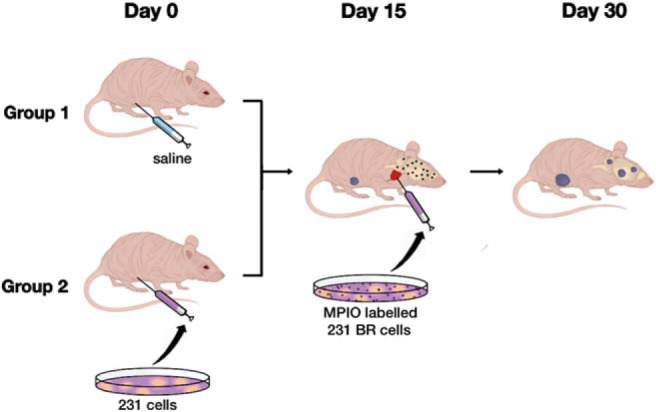
Illustration of the mouse imaging experiments. Mice in group 1 (n = 8) received an injection of saline into the lower right mammary fat pad on day 0, while those in group 2 (n = 8) received an orthotopic injection of 500 000 unlabeled MDA-MB-231 cells in the lower right mammary fat pad. The primary tumors were allowed to grow for 15 days in group 2, at which time, mice in both groups 1 and 2 received an intracardiac injection of 175 000 micron-sized paramagnetic iron oxide (MPIO)-labeled MDA-MB-231-BR cells suspended in 0.1 mL of saline (day 15). The brains of all mice were imaged on day 30. Mammary fat pad tumors were imaged for mice in group 2.
Magnetic Resonance Image Analysis
Brain images were assessed for regions of signal loss because of the presence of iron-containing cells, and regions of high signal representing metastases. To assess whether the primary mammary fat pad tumor has an effect on the growth of metastases, the number of tumors in the whole brain was counted and the volume of each metastasis was measured. To assess whether the presence of a primary tumor influences the number of nonproliferative cancer cells in the brain, the number of discrete signal voids in 50 evenly spaced MRI slices was counted.
Image analysis was performed using open-source OsiriX image software (version 3.9.2). Brain metastases were manually counted and segmented in each of the image slices per mouse. The region-of-interest volume tool was used to calculate the tumor volume.
Statistical analysis was performed using GraphPad Prism version 6.0 software (GraphPad, San Diego, California). Two-way unpaired Student t-tests were used to compare 2 groups at a single time point. Data are presented as mean and standard error of the mean (SEM).
BLI
Group 3 mice (n = 3) received an intracardiac injection of 50 000 iron-labeled luciferase-positive MDA-MB-231-BR cells for day 0 BLI. BLI was performed on a hybrid optical/Xray scanner (IVIS Spectrum animal imager, Xenogen, Alameda, California) on 3 mice within 1 hour after intracardiac injection of iron-labeled MDA-MB-231-BR cells. Mice were anesthetized with isoflurane (2% in 100% oxygen) using a nose cone attached to an activated carbon charcoal filter for passive scavenging. Mice received 150 μL of D-luciferin (30 mg/mL) intraperitoneally, and BLI images were captured every 1–5 minutes for up to 30 minutes.
Flow Cytometry
Group 4 mice (n = 2) received an intracardiac injection of 500 000 iron-labeled MDA-MB-231-BR cells, as described above. The brains of these mice were imaged with MRI to confirm the presence of signal voids in the brain indicative of a successful intracardiac injection. Mice were sacrificed 1-day post cell delivery by a pentobarbital (Euthanyl) overdose. After sacrifice, mice were perfused with a 0.9% saline solution and the brains were immediately excised. Individual mouse brains were dissociated using a Papain Dissociation System (Worthington Biochemical Corporation, Lakewood, New Jersey) according to the manufacturer's instructions. After dissociation, the resulting cells from 2 mouse brains were pooled and then MPIO-containing cells were concentrated using an EasySep® magnet (STEMCELL Technologies Inc., Vancouver, British Columbia, Canada). The isolated concentrate was resuspended in 1% FBS in phosphate-buffered saline and was then analyzed for live GFP+ Flash Red+-containing cells by FACS. To determine viability, cells were stained with 7-aminoactinomycin D viability dye (ThermoFisher Scientific, Waltham, Massachusetts) for 20 minutes on ice before sorting. FACS was conducted on a FACSAriaIII system (BD Biosciences, San Jose, California) using a 100-μm filter and normal dissociated mouse brain was used as a negative control. Live (7-aminoactinomycin-negative) GFP+ Flash Red+ cells were collected in 100% FBS and transferred to DMEM containing 10% FBS for in vitro expansion. FlowJo© software (Tree Star Inc., Ashland, Oregon) was used to analyze FACS data.
Results and Discussion
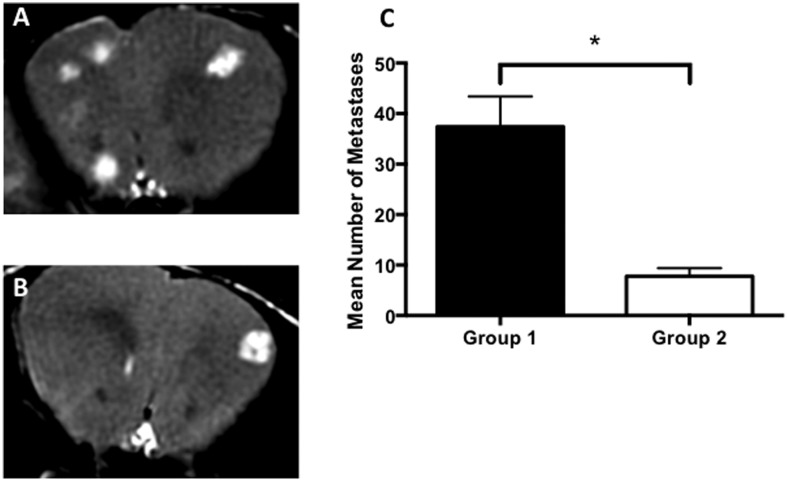
All mice developed MRI-detectable brain metastases. The average volume of the brain metastases was not significantly different in group 1 or 2. All mice in group 2 developed mammary fat pad tumors. Brain metastases were visualized as regions of signal hyperintensity in balanced steady-state free precession images. Fewer brain metastases developed in mice with a primary mammary fat pad tumor. Figure 2 shows representative mouse brain images with metastases and analysis of the mean number of brain metastases per group. The mean number of MRI-detectable brain metastases counted was 37.4 (±6 SEM) for group 1 mice and 7.8 (±1.6 SEM) for group 2 mice. These results indicate that a primary mammary fat pad tumor can inhibit the development of brain metastases. To the best of our knowledge, this is the first report of a mouse model where a parental breast tumor and brain metastatic clone is used in the same animal and the first such model for studying CTR.
Figure 2.
Fewer brain metastases formed in mice with a primary tumor (group 2). Representative magnetic resonance (MR) image slices from a mouse in group 1 (A) and group 2 (B). Brain metastases in balanced steady state free precession (bSSFP) images appear as areas of signal hyperintensity. On Day 30, significantly more brain metastases had developed in group 1 mice (C). Data are presented as the mean and SEM. *P < .001.
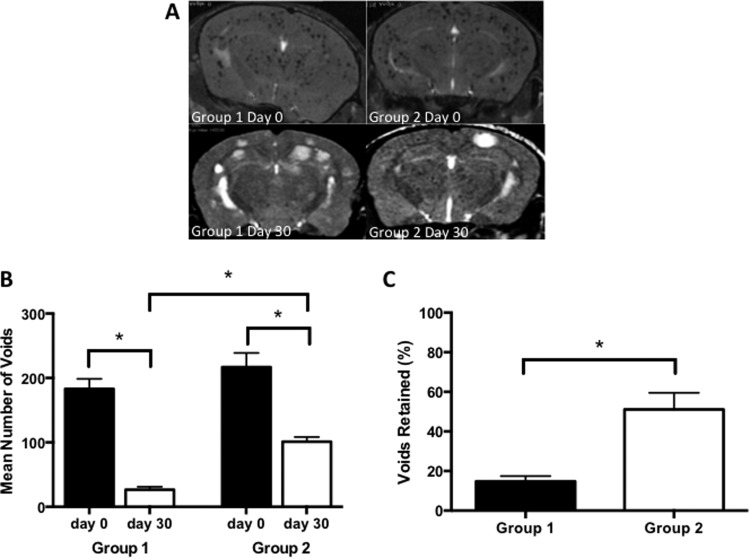
Signal voids, representing iron-labeled cancer cells, were observed in the mouse brains on the day of the injection and at endpoint. These appear as discrete regions of signal loss throughout the brain. On the day of the intracardiac injection, images showed that there was no significant difference in the number of voids in the brain for groups 1 and 2. The mean number of voids counted from day 0 images was 183 (±15.7 SEM) for group 1 and 217 (±22.1 SEM) for group 2. In the endpoint images, however, significantly more voids persisted in the brains of mice that also had a primary mammary fat pad tumor. The mean number of voids counted from day 30 images was 26.5 (±4.5 SEM) for group 1 and 101 (±7.5 SEM) for group 2. Representative mouse brain images and an analysis of the number of signal voids and the percentage of voids retained in the brain are shown in Figure 3. This finding suggests that the presence of a primary breast tumor can enhance the persistence of iron-retaining MDA-MB-231-BR cancer cells in the brain and points to a possible new mechanism for CTR.
Figure 3.
More iron-retaining cells persist in the brains of mice with a primary tumor (group 2). Representative magnetic resonance imaging (MRI) of mouse brain for groups 1 and 2 at days 0 and 30. At day 0, signal voids were evident in the brains of all mice. At day 30, brain metastases appeared in all mice; fewer in group 2, as shown in Figure 2 (A). There was no significant difference in the mean number of signal voids counted for groups 1 and 2 at day 0 (B). However, on day 30, there were significantly greater numbers of signal voids in group 2 mice compared with those in group 1 mice. The quantification of signal voids in the brain is also presented as a percentage of voids retained at day 30, with a significantly higher percentage of voids retained in group 2 mice (C). Data are presented as the mean and SEM. *P < .001.
Previous work with each cell line, MDA-MB-231 and MDA-MB-231BR, in separate model systems has provided evidence for the ability to track nonproliferative iron-labeled cancer cells in vivo by MRI (16, 20). Additional evidence is that signal voids identified by MRI are attributed to viable, iron-labeled cancer cells that come from the BLI and flow cytometry experiments performed here. Figure 4 shows MRI and BLI of the same mouse performed on the day 50 000 iron/luciferase-positive MDA-MB-231BR cells were injected. The day 0 MRI (Figure 3A) shows the characteristic signal voids dispersed throughout the whole brain volume, in 3 representative image slices, representing iron-positive cancer cells that have arrested in the capillaries in the brain. The day 0 BLI (Figure 3B) shows signal in the brain. FLuc BLI requires adenosine triphosphate as a cofactor and therefore the BLI signal is only detected from live cells (21). Together, these images provide proof that the signal voids detectable by MRI on day 0 represent live, luciferase-positive cells in the brain.
Figure 4.
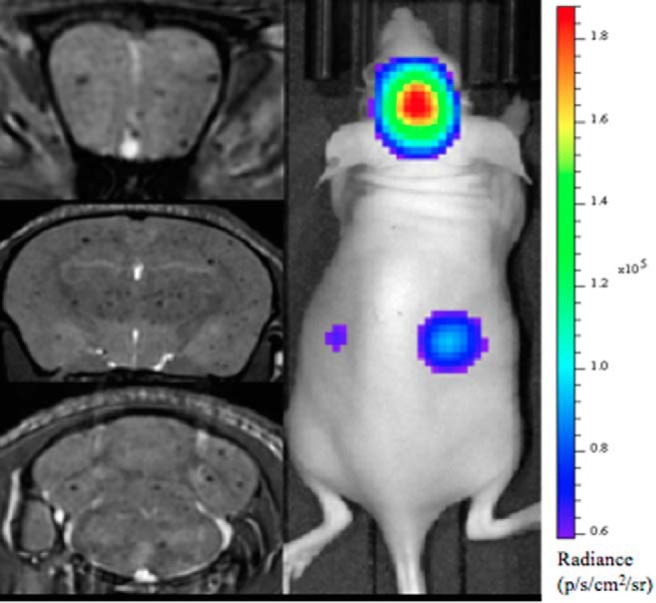
Bioluminescence (BLI) and MRI of a representative mouse from group 3 on day 0. Whole mouse BLI shows strong signal in the brain and weaker signal in the mouse body (Right Panel). MR image slices from a 3-dimensional (3D) bSSFP image acquisition for the same mouse (Left Panel). The 3 images are at the level of the frontal brain, midbrain, and hindbrain, and signal voids are detected throughout.
FACS was used to successfully isolate live cells that were GFP+ and red fluorescent (red MPIO) from the brains of mice that were injected with 500 000 GFP+ iron-labeled 231BR cells (Figure 5). MRI confirmed the successful delivery of MPIO-labeled cells to the mouse brain (Figure 5, A and B). Brains from 2 mice that had successful cell delivery were isolated, and dissociated cells were pooled for FACS analysis. A total of 5.1 × 10⁶ cells were analyzed after concentration by magnetic column. The majority of these cells were likely normal brain cells from the whole brain dissociation; however, FACS analysis identified and isolated 2.9 × 10³ live GFP+ Flash Red+ cells (Figure 5C). GFP+ Flash Red+ cells were found only in the brains of mice that had received MPIO-labeled 231BR cell injections, naïve mouse brain exhibited no GFP+ or Flash Red+ cell populations. The identified GFP+ Flash Red+ cells were collected and expanded in vitro. The majority (∼90%) of isolated cells adhered to tissue culture plastic and successfully expanded, displaying the same cell morphology as the original cultured 231BR cells (data not shown). Because the cancer cells were GFP+ and the iron particles were Flash Red-labeled, these FACS data provide additional support for our claim that signal voids in magnetic resonance images represent viable iron-positive cancer cells. We acknowledge that there is the potential for the iron from labeled cells to be transferred to phagocytic cells if they die and that this bystander cell labeling may lead to misinterpretation of the MRI signal voids as the original iron-labeled, injected cancer cells. Future FACS work will investigate other cell types in the brain to determine if other cell types are positive for the iron label and the relative percentages of cancer cells versus noncancer cells that are red fluorescent and, if possible, the relative iron content.
Figure 5.
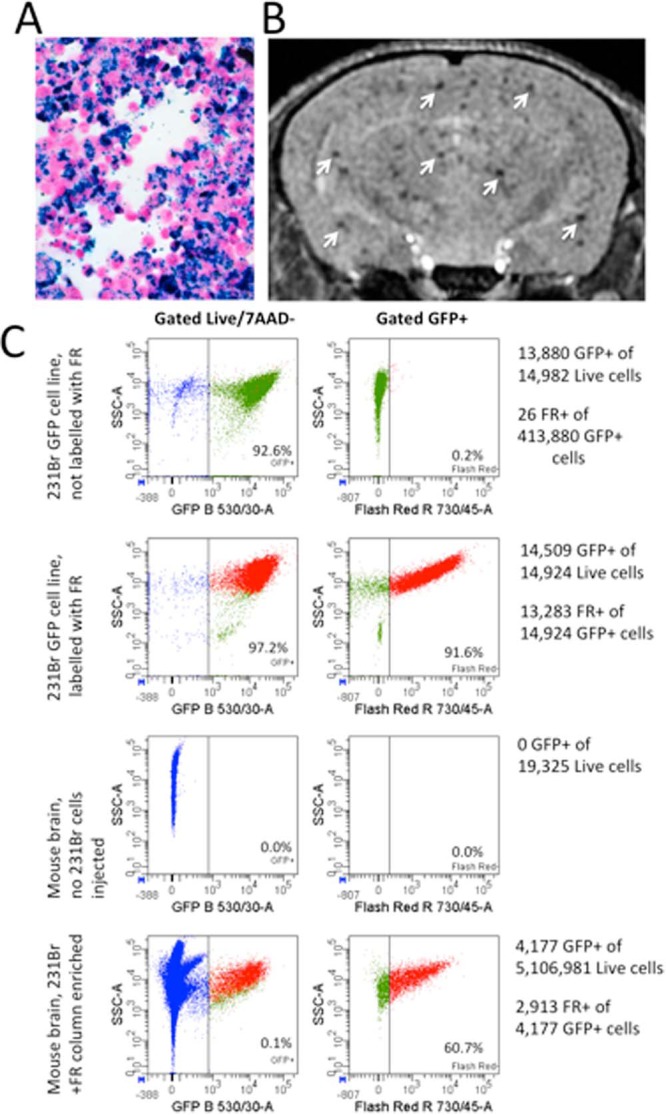
Isolation of live green fluorescent protein (GFP)+ Flash Red+ cells from whole mouse brain. Perl's Prussian Blue staining (blue) confirmed MPIO labeling of 231BR cells; 10× magnification (A). MRI confirmed the successful delivery of MPIO-labeled 231BR cells to mouse brain (arrows) (B). FACS analysis of dissociated mouse brain concentrated with a magnetic column identified and isolated a subset of live GFP+ Flash Red+ cells from the dissociated brain cell population. GFP+ Flash Red+ cells were only found and isolated from mice that had received labeled 231BR cell injections (C).
Ruggiero et al. have identified a molecular basis for CTR that involves 2 serum factors (meta- and ortho-tyrosine isomers), released by highly metabolic primary tumors, which suppress metastasis formation. They show that the antitumor effects are mediated, in part, by early inhibition of the mitogen-activated protein/extracellular-signal-regulated kinase pathway and inactivation of STAT3, potentially driving tumor cells into a state of dormancy (22). Our work also suggests that a primary tumor may enhance cancer cell dormancy as a mechanism for the inhibition of metastasis formation. Future studies will focus on evaluation of the cell cycle status on iron-retaining cancer cells and serum factors, which may be involved in the MRI observations, to provide additional information on these potential mechanisms.
Acknowledgments
The authors acknowledge funding for this research from the Canadian Cancer Society and the Cancer Research Society. The authors also acknowledge Chelsey Gareau for Figure 1.
Conflict of Interest: None reported.
Footnotes
- CTR
- Concomitant tumor resistance
- MRI
- magnetic resonance imaging
- BLI
- Bioluminescence
- FACS
- fluorescence-activated cell sorting
- FBS
- fetal bovine serum
- GFP
- green fluorescent protein
- SEM
- standard error of the mean
- MPIO
- micron-sized paramagnetic iron oxide
References
- 1. Allan AL, Vantyghem SA, Tuck AB, Chambers AF. Tumor dormancy and cancer stem cells: implications for the biology and treatment of breast cancer metastasis. Breast Dis. 2006;26:87–98. [DOI] [PubMed] [Google Scholar]
- 2. Wikman H, Vessella R, Pantel K. Cancer micrometastasis and tumour dormancy. APMIS. 2008;116(7–8):754–770. [DOI] [PubMed] [Google Scholar]
- 3. Fehm T, Mueller V, Marches R, Klein G, Gueckel B, Neubauer H, Solomayer E, Becker S. Tumor cell dormancy: implications for the biology and treatment of breast cancer. APMIS. 2008;116(7–8):742–753. [DOI] [PubMed] [Google Scholar]
- 4. Aguirre-Ghiso JA. Models, mechanisms and clinical evidence for cancer dormancy. Nat Rev Cancer. 2007;7(11):834–846. [DOI] [PMC free article] [PubMed] [Google Scholar]
- 5. Castano Z, Tracey K, McAllister SS. The tumor macroenvironment and systemic regulation of breast cancer progression. Int J Dev Biol. 2011;55(7):889–897. [DOI] [PubMed] [Google Scholar]
- 6. Goss PE, Chambers AF. Does tumour dormancy offer a therapeutic target? Nature Rev Cancer. 2010;10:871–877. [DOI] [PubMed] [Google Scholar]
- 7. Chiarella P, Bruzzo J, Meiss RP, Ruggiero RA. Concomitant tumor resistance. Cancer Lett. 2012;324(2):133–141. [DOI] [PubMed] [Google Scholar]
- 8. Prehn RT. The inhibition of tumor growth by tumor mass. Cancer Res. 1991;51(1):2–4. [PubMed] [Google Scholar]
- 9. Franco M, Bustuoabad OD, Di Gianni PD, Meiss RP, Vanzulli S, Buggiano V, Pasqualini CD, Ruggiero RA. Two different types of concomitant resistance induced by murine tumors: morphological aspects and intrinsic mechanisms. Oncol Rep. 2000;7:1053–1063. [DOI] [PubMed] [Google Scholar]
- 10. Demicheli R, Retsky MW, Hrushesky WJM, Baum M. Tumor dormancy and surgery-driven interruption of dormancy in breast cancer: learnings from failures. Nat Clin Practice Oncol. 2007;4(12):699–710. [DOI] [PubMed] [Google Scholar]
- 11. Galmarini CM, Tredan O, Calmarini FC. Concomitant resistance and early breast cancer: should we change treatment strategies? Cancer Metastasis Rev. 2014;33(1):271–283. [DOI] [PubMed] [Google Scholar]
- 12. Liu W, Frank JA. Detection and quantification of magnetically labeled cells by cellular MRI. Eur J Radiol. 2009;70(2):258–264. [DOI] [PMC free article] [PubMed] [Google Scholar]
- 13. Liu F, Laurent S, Fattahi H, Vander Elst L, Muller RN. Superparamagnetic nanosystems based on iron oxide nanoparticles for biomedical imaging. Nanomedicine (Lond). 2011;6(3):519–528. [DOI] [PubMed] [Google Scholar]
- 14. Heyn C, Ronald JA, Mackenzie LT, MacDonald IC, Chambers AF, Rutt BK, Foster PJ. In vivo magnetic resonance imaging of single cells in mouse brain with optical validation. Magn Reson Med. 2006;55(1):23–29. [DOI] [PubMed] [Google Scholar]
- 15. Shapiro EM, Sharer K, Skrtic S, Koretsky AP. In vivo detection of single cells by MRI. Magn Reson Med. 2006;55(2):242–249. [DOI] [PubMed] [Google Scholar]
- 16. Economopoulos V, Chen Y, McFadden C, Foster PJ. MRI detection of nonproliferative tumor cells in lymph node metastases using iron oxide particles in a mouse model of breast cancer. Transl Oncol. 2013;6(3):347–354. [DOI] [PMC free article] [PubMed] [Google Scholar]
- 17. Townson JL, Ramadan SS, Simedrea C, Rutt BK, MacDonald IC, Foster PJ, Chambers AF. Three-dimensional imaging and quantification of both solitary cells and metastases in whole mouse liver by magnetic resonance imaging. Cancer Res. 2009;69(21):8326–8331. [DOI] [PubMed] [Google Scholar]
- 18. Magnitsky S, Roesch A, Herlyn M, Glickson JD. In vivo and ex vivo MR imaging of slowly cycling melanoma cells. Magn Reson Med. 2011;66(5):1362–1373. [DOI] [PMC free article] [PubMed] [Google Scholar]
- 19. Palmieri D, Bronder JL, Herring JL, Yoneda T, Weil RK, Stark AM, Kurek R, Vega-Valle E, Feigenbaum L, Halverston D, Vortmeyer AO, Steinberg SM, Aldape K, Steeg PS. Her-2 overexpression increases the metastatic outgrowth of breast cancer cells in the brain. Cancer Res. 2007;67(9):4190–4198. [DOI] [PubMed] [Google Scholar]
- 20. Heyn C, Ronald JA, Ramadan SS, Snir JA, Barry AM, MacKenzie LT, Mikulis DJ, Palmieri D, Bronder JL, Steeg PS, Chambers AF, Rutt BK, Foster PJ. In vivo MRI of cancer cell fate at the single-cell level in a mouse model of breast cancer metastasis to the brain. Magn Reson Med. 2006;56:1001–1010. [DOI] [PubMed] [Google Scholar]
- 21. Zhao H, Doyle TC, Coquoz O, Kalish F, Rice BW, Contag CH. Emission spectra of bioluminescence reporters and interaction with mammalian tissue determine the sensitivity of detection in vivo. J Biomed Opt. 2005;10(4):41210. [DOI] [PubMed] [Google Scholar]
- 22. Ruggiero RG, Bruzzo J, Chiarella P, Bustuoabad OD, Meiss RP, Vanzulli S, Pasqualini CD. Concomitant tumor resistance: the role of tyrosine isomers in the mechanisms of metastasis control. Cancer Res. 2012;75(2):1043–1050. [DOI] [PubMed] [Google Scholar]


