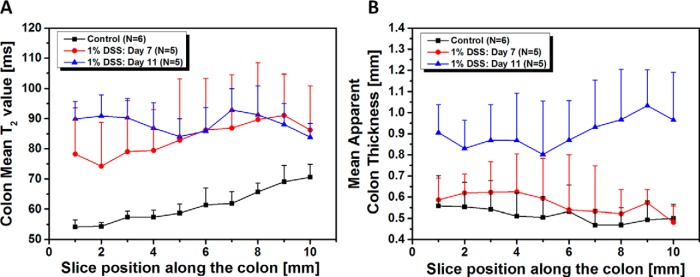
Figure 4.
Quantitative analysis of T2 maps calculated from a section-by-section analysis of untreated and treated mice. Mean colon T2 values (A), mean apparent colon thickness as function of section position along the colon in the untreated colon (n = 6), and treated mice with 1% DSS on day 7 (n = 5) and 11 (n = 5) (B). Values are reported as mean ± SD. *P < .05 Student 2-tailed t test, for all section positions, for both mean colon T2 values, and mean apparent colon thickness, except for the mean colon T2 values at a section position of 7 mm.

