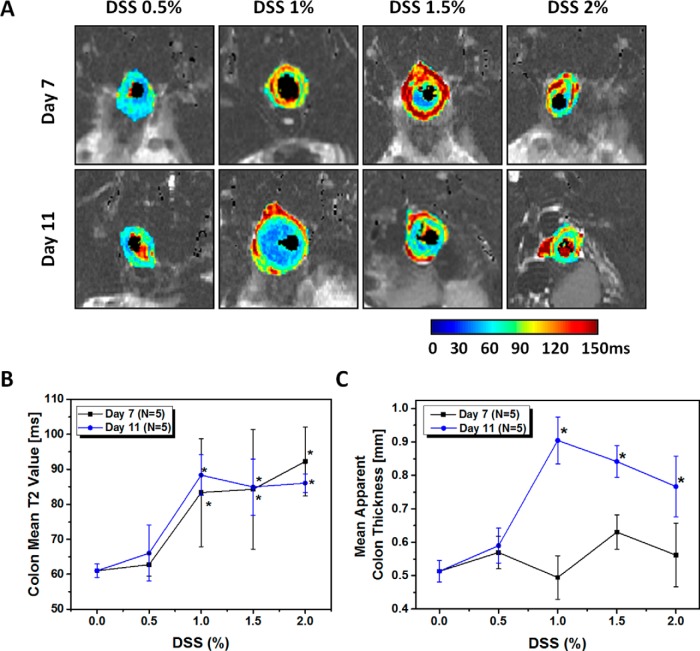
Figure 6.
DSS dosage response. The T2 maps of representative treated mice with different DSS ratio from 0.5% to 2% on day 7 and 11 (A). Quantitative analysis of T2 maps, as an average value across all sections of untreated and treated mice, at different DSS ratios. Mean colon T2 values (B), Mean apparent colon thickness in untreated (0% DSS) colon (n = 6), and treated mice with 0.5%–2% DSS on day 7 (n = 5) and 11 (n = 5) (C). Values are reported as mean ± SD. *P < .05 Student 2-tailed t test.

