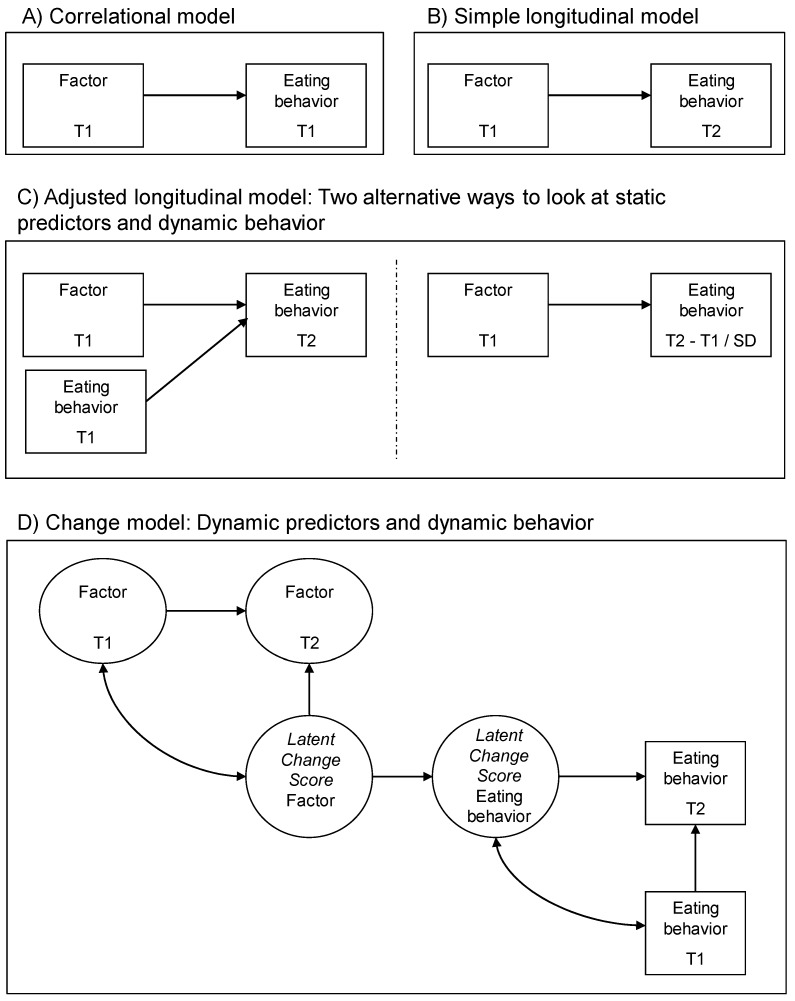
Figure 2.
Example models of static and dynamic research designs. Note: T = time point; SD = standard deviation. This figure provides a visualization of static (panels A–C) and dynamic (panel D) research designs. Each design investigates a relation between a shaping factor and an outcome—for the current purposes, this would be an outcome related to eating behavior. The designs become progressively more complex: (Panel A) describes a cross-sectional design where a factor at time 1 is associated with an outcome at the same time point. (Panel B) describes a simple longitudinal design where a factor at time 1 predicts an outcome at a later time, time 2. (Panel C) describes an adjusted longitudinal design wherein a factor at time 1 still predicts an outcome at a later time, but now taking into account the baseline (time 1) level of that outcome. (Panel D) describes a dynamic research design including two measurement moments for both factor and outcome, such that it can be determined whether changes in the factor predict changes in the outcome. This figure is adapted from Renner et al., 2008 [41] and is reproduced with the first author’s permission.

