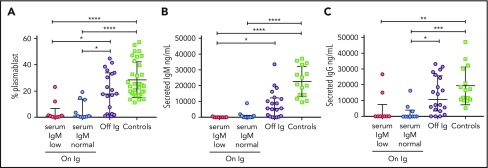
Figure 4.
Correlation of patient serum IgM with in vitro response to IL-21. IL-21-induced in vitro plasmablast percentage (A), secreted IgM (B), and secreted IgG (C) are shown for healthy control patients, patients receiving Ig who had either normal or low serum IgM for age, or patients off Ig. Medians and interquartile ranges are indicated. Brackets depict comparisons with significant P values: *P < .05; **P < .01; ***P < .001; and ****P < .0001.

