

Abstract
Purpose
To correlate ellipsoid zone (EZ) defects on spectral-domain optical coherence tomography (SD-OCT) with retinal sensitivity loss on macular integrity assessment (MAIA) microperimetry in macular telangiectasia type 2 (MacTel).
Methods
Macular SD-OCT volumes and microperimetry maps were obtained during the international, multicenter, randomized phase 2 trial of ciliary neurotrophic factor for type 2 MacTel on two visits within 5 days of one another. Software was developed to register SD-OCT to MAIA scanning laser ophthalmoscopy images and to overlay EZ defect areas on the microperimetry maps generated from microperimetry sensitivity values at specific points and from interpolated sensitivity values. A total of 134 eyes of 67 patients were investigated.
Results
The semiautomated registration algorithm was found to be accurate, both qualitatively by visual inspection of the nearly perfect overlap of the retinal vessels and quantitatively as assessed by interobserver reliability metrics performed in 98 eyes of 49 patients (intraclass correlation of aggregate retinal sensitivity loss >0.99). Aggregate retinal sensitivity loss within the EZ defect area was highly correlated with EZ defect area (Pearson correlation coefficient 0.93 and 0.92 at screening and baseline for noninterpolated maps; both were 0.94 for interpolated maps; P values <0.001).
Conclusions
With our software and image processing algorithms, there is nearly perfect correlation between retinal sensitivity on microperimetry and EZ defect area on SD-OCT. Our software allows determination of functional and structural changes with increasing disease severity and demonstrates that functional loss on microperimetry may be used as a surrogate marker of EZ loss on SD-OCT in type 2 MacTel.
Keywords: macular telangiectasia, microperimetry, optical coherence tomography, software, ellipsoid zone
A prospective natural history study of macular telangiectasia type 2 (MacTel) initiated in 2005 has better defined the imaging characteristics of MacTel. One of the earliest signs is loss of luteal pigment centrally seen as fundus hyperautofluorescence.1 This is followed by changes in optical coherence tomography (OCT), such as hyporeflective spaces in the inner and outer retina, and discontinuity or defects in the photoreceptor ellipsoid zone (EZ).2
In addition, cone loss is observed by adaptive optics scanning laser ophthalmoscopy imaging.3 OCT and confocal scanning laser ophthalmoscopy findings are associated with early mesopic function deficits that are first observed nasal to fixation.4 These data suggest that photoreceptor loss is intrinsic to MacTel and precedes the well-known vascular changes.
Previous studies have correlated EZ abnormalities with loss of retinal function in MacTel,5,6 suggesting that EZ loss is suitable as a surrogate parameter for retinal function. Using a prototype spectral-domain OCT (SD-OCT) system, Paunescu and colleagues7 reported a correlation between visual acuity and photoreceptor layer integrity. Maruko et al.8 demonstrated focal retinal function loss on Nidek (Fremont, CA, USA) microperimetry associated with the EZ line defects in six eyes of three patients and Charbel Issa et al.9 reported function loss on microperimetry associated with outer retinal abnormalities, including EZ defects, in 33 comprehensively phenotyped subjects.
Projection of OCT's inherent three-dimensional (3-D) information into a two-dimensional (2-D) en face image (e.g., through summed voxel projection [SVP]), streamlines comparison of data acquired by functional 2-D imaging systems (Fig. 1). With this approach, it is possible to correlate loss of the EZ band as visualized on OCT and functionally relevant metrics to assess disease severity in MacTel. For example, in a study of 49 eyes of 28 patients, Sallo and colleagues10 correlated visual field defects on Nidek microperimetry with en face OCT. These investigators showed that areas of retinal sensitivity defects were closely associated with cavitation of the outer retina and gaps in the EZ. The goal of our study was to create a novel robust semiautomatic software to aid in correlating function with structure in MacTel. We hypothesized that this software can more accurately demonstrate the association between EZ defects on SD-OCT scans with retinal sensitivity loss on macular integrity assessment (MAIA) microperimetry in a large cohort of patients with MacTel.
Figure 1.

OCT imaging of a subject with type 2 MacTel. (Left) Representative zoomed-in section of a B-scan, where the orange and light green lines correspond to the boundaries of the EZ band. For clarity of visualizing pathology, this B-scan is laterally and axially clipped in the central portion. (Right) En face OCT created by averaging pixel intensities in the EZ band of 97 equally distanced B-scans. The horizontal red line in the en face image corresponds to the location and extent of the zoomed-in B-scan on the left. Note that each B-scan (before clipping) laterally spans 5800 μm, which corresponds to the horizontal length of the en face image. The vertical dark green lines (in both images) show corresponding positions on en face and B-scan images. A “collapse” or break in EZ band on the B-scan image corresponds to the prominent dark area on en face OCT. Units for x- and y-axes in both images are microns.
Materials and Methods
Study Participants
Macular SD-OCT volumes and microperimetry sensitivity maps were obtained during screening and baseline visits of an international, multicenter, randomized phase 2 trial of ciliary neurotrophic factor for type 2 MacTel (NTMT02; Neurotech, Cumberland, RI, USA). The study protocol was in compliance with the Health Insurance Portability and Accountability Act (HIPAA) and Clinical Trials (NCT01949324, United States and Australia) guidelines, adhered to the tenets of the Declaration of Helsinki and HIPAA, and was prospectively approved by the institutional ethics committee of each participating center. Written informed consent was obtained from each participant after detailed explanation of the nature and possible consequences of the study.
Functional Testing
Best-corrected visual acuity (BCVA) was determined in each eye per the Early Treatment Diabetic Retinopathy Study protocol.11,12 Microperimetry testing was administered following pupillary dilation with one drop of tropicamide 1% and phenylephrine 2.5% each. Retinal sensitivity assessment was performed using a microperimeter with eye tracking (MAIA-1; CenterVue, San Jose, CA, USA) with the latest software version (1.7.0 or higher).
Participants underwent a 2-minute microperimetry training session to demonstrate the principles of the MAIA examination before the full test. The full examination was then performed using a custom grid consisting of 85 points centered on the fovea and covering a large area of the macula nasally and temporally (Fig. 2, second row). Light stimuli were presented randomly during the examination. Sensitivity results were reported in decibels. Fixation stability was expressed as the bivariate contour ellipse area (BCEA), the area of an ellipse on the retinal surface within which the center of the target was imaged 68% of the time. Smaller BCEA values correspond to more precise fixation.13 To assess repeatability, two microperimetry examinations were performed, the first during the screening visit and the second during the baseline visit within 5 days of the initial examination. Examinations were performed in a semidark room, in which participants were placed for at least 10 minutes before testing. Care was taken to eliminate all other light sources or background noise to prevent subject distraction.
Figure 2.

Registration of en face OCT SVP and microperimetry images. Each column represents a different eye. Rows from top to bottom display (first row) OCT SVP, (second row) MAIA SLO fundus image with microperimetry map, (third row) registered overlay, and (fourth row) B-scan crossing through the center of the EZ break anchored on the OCT SVP. The overlay image in the third row shows the smaller field-of-view OCT SVP (in green) registered on the microperimetry images (in red). The overlap of vessels in the overlay image qualitatively attests to the accuracy of our registration. In the fourth row, pseudo-color stripes on the central B-scan represent the corresponding sensitivity profile as obtained from the registered interpolated microperimetry maps, visualizing the morphology/sensitivity correlations. x-, y-, and z-axis units in the fourth row are microns.
Imaging
Red-free fundus images containing the MAIA microperimetry maps were obtained from each subject. High-resolution SD-OCT volume scans consisting of 97 B-scans each with 1024 A-scans within a 20 degree × 20 degree (approximately 6 × 6 mm) retinal area at automatic real tracking 9 were acquired at the screening visit using a Spectralis unit (Heidelberg Engineering GmBH, Heidelberg, Germany).
Image Processing
The Duke Optical Coherence Tomography Retinal Analysis Program14,15 was used to semiautomatically segment on each B-scan from OCT macular volumes, the EZ layer boundaries (delineated by the orange and light green lines in Fig. 1). For each volume, the layer boundary positions were then used to generate an EZ thickness map of size 97 × 1024 pixels. We then interpolated these maps to N × M pixel images to achieve equivalent 10-μm pixel pitch in both en face (x-y) directions.16 Next, thickness values were converted from pixels to microns using 3.87-μm axial pixel pitch specified by the OCT manufacturer. The software estimated a geometric transformation with eight unknown parameters, which can be estimated by a minimum set of four pairs of corresponding pixels between the images.17 Because in most cases the graders could find more than four pairs of corresponding pixels between images, which creates an overdetermined system of linear equations, these parameters were determined using a Random Sample Consensus (RANSAC)18-based outlier rejection scheme (Fig. 2).
Semiautomatic software was developed to accurately register the en face OCT image to the microperimetry image ensuring near perfect vessel overlap with a high degree of repeatability. The software used the segmented OCT B-scans to generate an en face OCT SVP by averaging all pixel values in the EZ layer in the axial direction. In defect areas in which EZ layer thickness was zero, an intensity of zero was assigned. Because only the EZ intensity values were averaged, the EZ defect was readily observed in the en face SVP image (Fig. 1). A grader then selected a minimum of four pixel pairs at various locations on the en face OCT SVP, most commonly near easily identifiable vessels or at vessel bifurcations, corresponding to similar locations on the microperimetry images. The software estimated a geometric transformation between the images with a RANSAC18-based outlier rejection scheme (Fig. 2).
Lateral resolution of OCT SVP (Fig. 1) is significantly higher than the density of microperimetric sensitivity loci; in this study, there were 85 retinal sensitivity measurements per eye (Fig. 3, top left). In addition to replicating the method of Sallo and colleagues,10 which used microperimetry data for all loci tested, and to better match data from these two ophthalmic modalities, we interpolated the microperimetry data to achieve similar pixel density to the SVP (Fig. 3, top middle). This was achieved by using a joint Gaussian linear interpolator, with each sensitivity dot center as the center of a Gaussian distribution. The SD  for each Gaussian distribution was chosen experimentally as 50 times the number of pixels covered by each dot.19
Figure 3.

Geometric correspondence of EZ defects on OCT with retinal sensitivity loss on MAIA microperimetry. (Top left) Microperimetry data overlaid on a red-free fundus image. (Top middle) Interpolated microperimetry data (map). (Top right) Abnormal microperimetry mask M (green) after thresholding (<25 dB) data. (Bottom left) OCT SVP registered and overlaid on microperimetry image. (Bottom middle) EZ mask O (red) after thresholding the EZ thickness (<12 μm) data from OCT. (Bottom right) Overlay of masks O (red) and M (green) with overlap area shown in yellow. In all images, the outer octagonal boundary in yellow shows the convex hull field of view of microperimetry sensitivity, inside which the interpolation and overlap are computed.
To define the upper limit of abnormal microperimetry values that best correspond to the EZ loss on OCT, microperimetry maps (Fig. 3, top middle) were first thresholded in the range of 0 to 36 dB in 0.5-dB steps to create a set of binary masks (Fig. 3, top right, shows an example of thresholding at <25 dB). On OCT, areas in which the EZ band was thinner than 12 μm were marked as an EZ defect, thus generating a 2-D binary mask of EZ defect area (Fig. 3, bottom middle). Next, these two binary maps were registered and overlaid (Fig. 3, bottom right). We calculated the summation of sensitivity and specificity of matching the two binary maps for different threshold values, to optimize the receiver operating characteristic curve.
Interobserver Reproducibility
To assess the accuracy of the semiautomatic registration method, OCT and microperimetry images from 98 eyes of 49 randomly chosen patients were registered by two independent nonexpert users masked to each other's markings.
Microperimetric Data Analysis
Sensitivity thresholds measured within the EZ defect areas were compared with those measured external to the lesion. As previously described,10 background sensitivity was defined as the average of retinal sensitivity values measured at all test points located outside the area of the EZ defect in each eye. To obtain the aggregate retinal sensitivity loss, the absolute difference relative to the background sensitivity was calculated at each test point within the area of the EZ defect and these differences were summed. Aggregate retinal sensitivity loss (expressed in decibels) thus reflects the EZ defect area and scotoma depth in a single variable. As an extension to the technique of Sallo et al.,10 a new metric termed “interpolated aggregate sensitivity loss” was calculated with interpolated microperimetry sensitivity values to provide measurement values in addition to the 85 loci tested by the microperimetry grid.
Statistical Analysis
Descriptively, we examined the mean and SD for each measurement of interest. Repeatability between the screening and baseline measurements as well as the interobserver reproducibility between the two independent users of the semiautomatic registration software was assessed by computing the intraclass correlation coefficient (ICC) along with 95% confidence intervals. Paired t-tests were used to compare measurements between left and right eyes (dependent groups). Last, Pearson correlation coefficients were computed to assess the relationship between EZ defect and sensitivity loss. A P < 0.05 was considered significant. Analyses were conducted using commercially available statistical software (IBM SPSS Statistics version 17; IBM Corporation, Armonk, NY, USA; and SAS version 9.2; SAS Institute, Cary, NC, USA).
Results
Participant Characteristics
We analyzed 134 eyes of 67 participants with available SD-OCT volume scans and MAIA microperimetry examinations. Participants ranged in age from 45 to 79 years (mean 61.5 ± 8.9 years), and 39% were males.
Retinal Function
Mean right eye BCVA was 75.0 ± 8.1 letters (Snellen equivalent 20/32) and left eye BCVA was 77.7 ± 8.6 letters (20/30). Eyes in which the fovea was included in the area of EZ discontinuity had a mean letter score of 73.0 ± 8.9 (range 46–92, Snellen 20/32), and eyes with no detectable EZ defects at the foveal center had a significantly higher mean letter score, 79.3 ± 6.6 (range 65–91, Snellen 20/25), P < 0.001.
Microperimetry sensitivity measurements had high reproducibility between the two visits that were performed within 5 days of each other (Table 1).
Table 1.
Retinal Sensitivity Values and Their Reproducibility During Screening and Baseline Visits (All 67 Subjects)

Correlation Between EZ Defect on OCT and Sensitivity Loss on Microperimetry
Average and aggregate retinal sensitivity values on MAIA microperimetry obtained during the screening and baseline visits are shown in Table 1. Differences in retinal sensitivity loss between areas of EZ defect and unaffected areas were statistically significant (paired t-test, P < 0.01 in both right and left eyes for raw and interpolated data). A high positive correlation was found between aggregate sensitivity loss and EZ defect area (Pearson correlation coefficients were 0.93 and 0.92 at screening and baseline, respectively, for noninterpolated maps, and 0.94 and 0.94, respectively, for interpolated maps, P values for all cases <0.001, Fig. 4). The topographic distribution of retinal sensitivity loss corresponded closely to that of the EZ defect area (Fig. 4).
Figure 4.

Correlation between EZ break and microperimetry sensitivity data. (Left column) Data from first visit; (right column) data from second visit. Top row represents correlation between interpolated aggregate sensitivity loss and EZ break area (0.94 for both first and second visit). Bottom row represents correlation between EZ break areas of the left and right eyes (0.56 for both first and second visits).
Threshold for Matching Abnormal Microperimetry Data to EZ Defect Area
The plot in Figure 5 quantifies the overlap between the EZ defect map on OCT to the thresholded abnormal sensitivity map on microperimetry. Optimal overlap in this graph is achieved by setting microperimetry map sensitivity thresholds at 25.0 dB, which is consistent with the value reported by MAIA20 to be the threshold of normal sensitivity value.
Figure 5.

Correlation between the EZ defect areas on OCT and the abnormal sensitivity areas on microperimetry. The horizontal axis represents the threshold of normal from abnormal sensitivity values on microperimetry. The measure of correlation is the sum of specificity and sensitivity values achieved by matching the EZ defect map on OCT and abnormal sensitivity map on microperimetry. (Blue line) First visit with optimum threshold 25.0 dB, sensitivity 0.766, specificity 0.693. (Red line) Second visit with optimum threshold 25.0 dB, sensitivity 0.787, specificity 0.701.
Interobserver Reproducibility
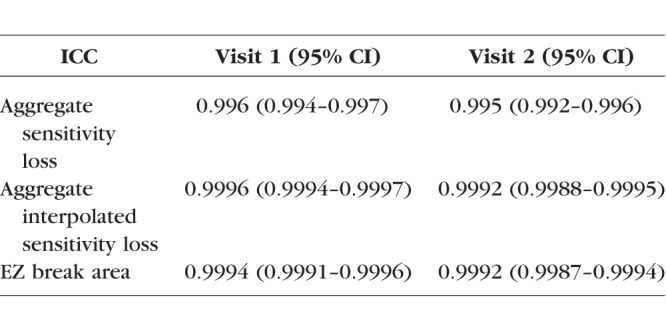
Agreements between average and aggregate retinal sensitivity values and EZ defect areas for 49 randomly chosen subjects and for the two graders were calculated (Table 2). High ICCs very close to 1 were observed for aggregate sensitivity loss, aggregate interpolated sensitivity loss, and EZ break area.
Table 2.
Interobserver Reproducibility Between Two Independent Graders (48 Randomly Selected Subjects)
Fixation Stability
The BCEA ranged from 0 to 35.2°2 (mean 1.6 ± 4.5°2) in right eyes, and from 0 to 35.9°2 (mean 1.7 ± 4.6°2) in left eyes for the screening visit, and from 0.1 to 19.4°2 (mean 1.4 ± 2.7°2) in right eyes, and from 0 to 34.4°2 (mean 1.8 ± 4.4) in left eyes for the baseline visit. A statistically significant correlation between BCEA and EZ defect area was not observed (P = 0.99 and P = 0.85, for screening visit and baseline visit, respectively. There was high repeatability for the BCEA indices between the baseline and screening visits (ICC 0.86; 95% CI 0.81–0.90).
Discussion
In this study, we demonstrated the remarkable correlation between structural markers of en face OCT and retinal function on microperimetry testing in the largest cohort of MacTel patients reported to date. We developed a robust semiautomated, locally deformable registration algorithm to overlay en face OCT with MAIA microperimetry maps. Our software proved accurate in determining functional and structural changes with increasing disease severity and showed that scotoma on microperimetry can serve as a functional surrogate marker of EZ loss on SD-OCT in MacTel.
The rationale for the suitability of the EZ as an indicator of dysfunction in MacTel is based on the anatomic structure of the fovea and the pathobiology of the disease. As most of the axons and pedicle terminals of the foveolar cones are displaced radially during foveal development,21 the parafoveal area contains mainly Müller cells and glia. As this is the area where first cavitations occur in MacTel, and as Müller cells create the external limiting membrane, this indicates that Müller cells are primarily affected in MacTel.22 The thickness of EZ band of 12 μm marked as an EZ defect in our study represents approximately 50% decrease of the mitochondrial agglomerates,3 and is consistent with the threshold for metabolic failure of cones or sensitivity loss on microperimetry. Thus, the loss of the EZ on SD-OCT is indeed expected to correlate with cone-mediated sensitivity loss.
Our study determined a higher correlation between the structural information from SD-OCT and functional information from microperimetry as compared with previous studies.5,6,10 Specifically, the Pearson coefficients for the correlation between aggregate retinal sensitivity loss and EZ defect area between the work of Sallo and colleagues10 and ours were 0.85 and 0.94, respectively. This disparity could be due to a number of reasons. First, our study dataset was larger, which likely reduced the effect of outliers in the analysis. Second, it is possible that our EZ defect segmentation and/or our semiautomated segmentation methods were more accurate than the previous technique. This can be robustly ascertained through a head-to-head comparison on a shared dataset. Third, regardless of the segmentation or registration method used, our method of interpolating microperimetry data resulted in a 1% to 2% better correlation between OCT and microperimetry data. We also showed the EZ defect areas on OCT best match the microperimetry loci with retinal sensitivity <25 dB.
In MacTel, en face OCT has been used effectively to assess 2-D and 3-D extent of the lesion, to perform topographical analysis, and to compare results with other imaging modalities.23–25 Our work follows the method of Sallo and colleagues,10 which analyzed EZ bands on OCT volumes to demonstrate that EZ break area was associated with a loss of mesopic retinal sensitivity. We found that retinal loci with EZ defects had severely decreased retinal sensitivities with mean values ranging from 13.9 to 15.6 dB, depending on the study visit and eye analyzed, and corresponded to an absolute scotoma. In contrast, retinal loci outside the EZ defect had normal sensitivity values with a mean of 26.5 to 27.0 dB. Differences in retinal sensitivity loss between affected and unaffected areas were statistically significant. The differences between mean sensitivities within the EZ defect area and the background were approximately 14 dB, larger than the value of 8 dB reported by other investigators.10,26,27 This discrepancy is likely due to the use of the MAIA instead of the Nidek MP-1 microperimetry unit, and may be due to variation in underlying disease between patients enrolled in this and prior studies.
Evaluation of fixation stability in the cohort of MacTel patients analyzed failed to reveal a statistically significant correlation between BCEA and EZ defect area, corroborating earlier reports,9,10,28 and likely reflecting the fact that most MacTel patients retain excellent fixation stability despite disease progression.
Our semiautomated OCT-microperimetry registration algorithm was found to be very accurate, as demonstrated qualitatively by the nearly perfect overlap between the macular vessels on en face OCT and the vessels on the microperimetry scanning laser ophthalmoscopy (SLO) images (Fig. 2). Quantitative interobserver reliability experiments further attested to the accuracy of registration method. A high positive correlation was found between aggregate sensitivity loss and EZ defect area. Notably, this correlation was stronger than in the work of Sallo and colleagues,10 which used manual overlays of the en face OCT and microperimetry maps, and stronger than the correlation between outer retinal thickness on OCT and retinal sensitivity afforded by the software Multi-modal Mapper described by Charbel and colleagues.9 Methodologically, our study differs significantly from that of Charbel et al.,9 because our registration method uses en face OCT images, and produces experimental validation through sensitivity interpolation, optimal threshold computation, and correlation analysis.
The topographic distribution of retinal sensitivity values generally corresponded closely to that of the EZ defect area, although in some analyzed cases, the correspondence was not perfect near the lesion border, a dynamic area that reflects functional changes in MacTel. We identified areas of EZ defects that correlated with nonscotomatous loci on microperimetry testing, suggesting that in these areas the EZ defect loss may represent an earlier marker of dysfunction in MacTel. This observation was supported by the recent study of Wang and colleagues29 in three eyes of MacTel patients from two unrelated families, in which measurable visual sensitivity on adaptive optics microperimetry was noted in areas of apparent focal cone loss on adaptive optics SLO and OCT. These results and ours may suggest that MacTel lesions with a preserved external limiting membrane may contain functioning photoreceptors with abnormal imaging characteristics. Cones in transitional states may have dispersed mitochondria and may still be able to deliver signals.30 In some areas, radially displaced cone axons or pedicles may be affected, but their distal portions, including the EZ, may remain intact. We also noted cases in which the areas of decreased sensitivity corresponded to areas of intact EZ in the en face OCT. In support of this finding, Charbel and colleagues9 demonstrated a significant relationship between the outer retinal thickness on SD-OCT and retinal sensitivity on Nidek MP-1 microperimetry, suggesting that neurodegeneration leaving more than 40 to 60 μm outer retinal thickness would be associated with residual light sensitivity, whereas degeneration beyond this threshold may completely abolish retinal light sensitivity. An additional possible explanation for the two contrasting findings is that the optimal sensitivity threshold for the OCT values (pixels) and microperimetry sensitivity (dB) necessary to achieve the ideal correlation between the two modalities may vary slightly from subject to subject, depending on disease severity and individual variability.
Despite its significant strengths, our study has potential limitations. Because fixation may be affected in MacTel patients, small eye movements may lead to motion artifacts near the foveal center, an area devoid of vascular landmarks. However, in the study of Sallo et al.,10 measurements of EZ defect areas had a high degree of reproducibility between scans and over time. Using our methodology, we found that microperimetry sensitivity measurements inside and outside EZ defect areas had high repeatability between the two visits that were performed within 5 days of each other.
In agreement with prior studies,10 a dark ring surrounding the EZ defect was observed in approximately half of the en face OCT images. Although the etiology of this low backscatter is unclear, the shape and location of the dark ring is remarkably similar to the area in which Powner et al.31 demonstrated Müller cell loss or dysfunction resulting in depletion of macular pigment. A future study is necessary to evaluate the differences in retinal sensitivity and anatomy on OCT B-scans between the retinal areas within the dark ring as compared with normal retinal areas in these cases and in cases without a dark ring phenomenon.
In conclusion, the robust semiautomated software was found to be accurate, as assessed by the nearly perfect overlap of the retinal vessels on en face OCT with those on microperimetry maps and the high degree of correlation between high-resolution imaging of the EZ defect area and visual function in MacTel patients. Our software allowed determination of functional and structural changes with increasing disease severity and demonstrated that scotoma on microperimetry is a strong functional surrogate marker of EZ loss on SD-OCT in type 2 MacTel.
Acknowledgments
Presented at the annual meeting of the Association for Research in Vision and Ophthalmology, Seattle, Washington, United States, May 3, 2016.
Supported by the Lowy Medical Research Institute (La Jolla, CA, USA) for the clinical study and the analysis presented in this manuscript. The funding organization participated in the design of the study in the article.
Disclosure: D. Mukherjee, None; E.M. Lad, None; R.R. Vann, None; S.J. Jaffe, None; T.E. Clemons, None; M. Friedlander, None; E.Y. Chew, None; G.J. Jaffe, Heidelberg Engineering (C); S. Farsiu, P
Appendix
Participating principal investigators and centers of the MacTel Study Group: Jose-Alain Sahel, MD, PhD, Centre Hopitalier National D'Optalmologie des Quinze-Vingts, Paris, France; Robyn Guymer, MD, Centre for Eye Research, East Melbourne, Australia; Gisele Soubrane, MD, PhD, FEBO, Clinique Ophtalmolgie de Creteil, Creteil, France; Alain Gaudric, MD, Hopital Lariboisiere, Paris, France; Steven Schwartz, MD, Jules Stein Eye Institute, UCLA, Los Angeles, CA, USA; Ian Constable, MD, Lions Eye Institute, Nedlands, Australia; Michael Cooney, MD, MBA, Manhattan Eye, Ear, and Throat Hospital, New York, NY, USA; Catherine Egan, MD, Moorfields Eye Hospital, London, UK; Lawrence Singerman, MD, Retina Associates of Cleveland, Cleveland, OH, USA; Mark C. Gillies, MD, PhD, Save Sight Institute, Sydney, Australia; Martin Friedlander, MD, PhD, Scripps Research Institute, La Jolla, CA, USA; Daniel Pauleikhoff, Prof. Dr, St. Franziskus Hospital, Muenster, Germany; Joseph Moisseiev, MD, The Goldschleger Eye Institute, Tel Hashomer, Israel; Richard Rosen, MD, The New York Eye and Ear Infirmary, New York, NY, USA; Robert Murphy, MD, The Retina Group of Washington, Fairfax, VA, USA; Frank Holz, MD, University of Bonn, Bonn, Germany; Grant Comer, MD, University of Michigan, Kellogg Eye Center, Ann Arbor, MI, USA; Barbara Blodi, MD, University of Wisconsin, Madison, WI, USA; Diana Do, MD, The Wilmer Eye Institute, Baltimore, MD, USA; Alexander Brucker, MD, Scheie Eye Institute, Philadelphia, PA, USA; Raja Narayanan, MD, LV Prasad Eye Institute, Hyderabad, India; Sebastian Wolf, MD, PhD, University of Bern, Bern, Switzerland; Philip Rosenfeld, MD, PhD, Bascom Palmer, Miami, FL, USA. Paul S. Bernstein, MD, PhD, Moran Eye Center, University of Utah, UT, USA. Joan W. Miller, MD, Massachusetts Eye and Ear Infirmary, Harvard Medical School, Boston, MA, USA.
References
- 1. Charbel Issa P, Heeren TF, Kupitz EH, Holz FG, Berendschot TT. . Very early disease manifestations of macular telangiectasia type 2. Retina. 2016; 36: 524– 534. [DOI] [PubMed] [Google Scholar]
- 2. Charbel Issa P, Gillies MC, Chew EY,et al. Macular telangiectasia type 2. Prog Retin Eye Res. 2013; 34: 49– 77. [DOI] [PMC free article] [PubMed] [Google Scholar]
- 3. Ooto S, Hangai M, Takayama K,et al. High-resolution photoreceptor imaging in idiopathic macular telangiectasia type 2 using adaptive optics scanning laser ophthalmoscopy. Invest Ophthalmol Vis Sci. 2011; 52: 5541– 5550. [DOI] [PubMed] [Google Scholar]
- 4. Charbel Issa P, Helb HM, Rohrschneider K, Holz FG, Scholl HP. . Microperimetric assessment of patients with type 2 idiopathic macular telangiectasia. Invest Ophthalmol Vis Sci. 2007; 48: 3788– 3795. [DOI] [PubMed] [Google Scholar]
- 5. Sallo FB, Peto T, Egan C,et al. The IS/OS junction layer in the natural history of type 2 idiopathic macular telangiectasia. Invest Ophthalmol Vis Sci. 2012; 53: 7889– 7895. [DOI] [PMC free article] [PubMed] [Google Scholar]
- 6. Heeren TFC, Kitka D, Florea D,et al. Longitudinal correlation of ellipsoid zone loss and functional loss in macular telangiectasia type 2 [published online ahead of print May 24, 2017] Retina. 10.1097/IAE.0000000000001715. [DOI] [PMC free article] [PubMed]
- 7. Paunescu LA, Ko TH, Duker JS,et al. Idiopathic juxtafoveal retinal telangiectasis: new findings by ultrahigh-resolution optical coherence tomography. Ophthalmology. 2006; 113: 48– 57. [DOI] [PMC free article] [PubMed] [Google Scholar]
- 8. Maruko I, Iida T, Sekiryu T, Fujiwara T. . Early morphological changes and functional abnormalities in group 2A idiopathic juxtafoveolar retinal telangiectasis using spectral domain optical coherence tomography and microperimetry. Br J Ophthalmol. 2008; 92: 1488– 1491. [DOI] [PubMed] [Google Scholar]
- 9. Charbel Issa P, Troeger E, Finger R, Holz FG, Wilke R, Scholl HPN. . Structure-function correlation of the human central retina. PLoS One. 2010; 5: e12864. [DOI] [PMC free article] [PubMed] [Google Scholar]
- 10. Sallo FB, Peto T, Egan C,et al. “En face” OCT Imaging of the IS/OS junction line in type 2 idiopathic macular telangiectasia. Invest Ophthalmol Vis Sci. 2012; 53: 6145– 6152. [DOI] [PMC free article] [PubMed] [Google Scholar]
- 11. Early Treatment Diabetic Retinopathy Study Research Group. Early Treatment Diabetic Retinopathy Study design and baseline patient characteristics: ETDRS report number 7. Ophthalmology. 1991; 98: 741– 756. [DOI] [PubMed] [Google Scholar]
- 12. Ferris FL, Kassoff A, Bresnick GH, Bailey I. . New visual acuity charts for clinical research. Am J Ophthalmol. 1982; 94: 91– 96. [PubMed] [Google Scholar]
- 13. Crossland MD, Dunbar HMP, Rubin GS. . Fixation stability measurement using The Mp1 microperimeter. Retina. 2009; 29: 651– 656. [DOI] [PubMed] [Google Scholar]
- 14. Chiu SJ, Izatt JA, O'Connell RV, Winter KP, Toth CA, Farsiu S. . Validated automatic segmentation of AMD pathology including drusen and geographic atrophy in SD-OCT images. Invest Ophthalmol Vis Sci. 2012; 53: 53– 61. [DOI] [PubMed] [Google Scholar]
- 15. Chiu SJ, Li XT, Nicholas P, Toth CA, Izatt JA, Farsiu S. . Automatic segmentation of seven retinal layers in SDOCT images congruent with expert manual segmentation. Opt Express. 2010; 18: 19413– 19428. [DOI] [PMC free article] [PubMed] [Google Scholar]
- 16. ANSI. American National Standard for the Safe Use of Lasers, ANSI Z1361. Orlando, FL: Laser Institue of America; 2000. [Google Scholar]
- 17. Szeliski R. . Computer Vision: Algorithms and Applications. New York, NY: Springer Science+Business Media; 2010. [Google Scholar]
- 18. Fischler MA, Bolles RC. . Random sample consensus: a paradigm for model fitting with applications to image analysis and automated cartography. Commun ACM. 1981; 24: 381– 395. [Google Scholar]
- 19. Aurenhammer F. . Voronoi diagrams–a survey of a fundamental geometric data structure. ACM Comput Surv. 1991; 23: 345– 405. [Google Scholar]
- 20. Parodi MB, Triolo G, Morales M,et al. MP1 and MAIA fundus perimetry in healthy subjects and patients affected by retinal dystrophies. Retina. 2015; 35: 1662– 1669. [DOI] [PubMed] [Google Scholar]
- 21. Hendrickson AE, Yuodelis C. . The morphological development of the human fovea. Ophthalmology. 1984; 91: 603– 612. [DOI] [PubMed] [Google Scholar]
- 22. Zhu M, Krilis M, Gillies MC. . The relationship between inner retinal cavitation, photoreceptor disruption, and the integrity of the outer limiting membrane in macular telangiectasia type 2. Retina. 2013; 33: 1547– 1550. [DOI] [PubMed] [Google Scholar]
- 23. Chew EY, Clemons TE, Peto T,et al. Ciliary neurotrophic factor for macular telangiectasia type 2: results from a phase 1 safety trial. Am J Ophthalmol. 2015; 159: 659– 666.e1. [DOI] [PMC free article] [PubMed] [Google Scholar]
- 24. Wolff B, Basdekidou C, Vasseur V, Sahel JA, Gaudric A, Mauget-Faysse M. . “En face” optical coherence tomography imaging in type 2 idiopathic macular telangiectasia. Retina. 2014; 34: 2072– 2078. [DOI] [PubMed] [Google Scholar]
- 25. Nunes RP, Goldhardt R, de Amorim Garcia Filho CA,et al. Spectral-domain optical coherence tomography measurements of choroidal thickness and outer retinal disruption in macular telangiectasia type 2. Ophthalmic Surg Lasers Imaging Retina. 2015; 46: 162– 170. [DOI] [PubMed] [Google Scholar]
- 26. Rangaswamy NV, Patel HM, Locke KG, Hood DC, Birch DG. . A comparison of visual field sensitivity to photoreceptor thickness in retinitis pigmentosa. Invest Ophthalmol Vis Sci. 2010; 51: 4213– 4219. [DOI] [PMC free article] [PubMed] [Google Scholar]
- 27. Hood DC, Ramachandran R, Holopigian K, Lazow M, Birch DG, Greenstein VC. . Method for deriving visual field boundaries from OCT scans of patients with retinitis pigmentosa. Biomed Opt Exp. 2011; 2: 1106– 1114. [DOI] [PMC free article] [PubMed] [Google Scholar]
- 28. Finger RP, Charbel Issa P, Fimmers R, Holz FG, Rubin GS, Scholl HPN. . Reading performance is reduced by parafoveal scotomas in patients with macular telangiectasia type 2. Invest Ophthalmol Vis Sci. 2009; 50: 1366– 1370. [DOI] [PubMed] [Google Scholar]
- 29. Wang Q, Tuten WS, Lujan BJ,et al. Adaptive optics microperimetry and OCT images show preserved function and recovery of cone visibility in macular telangiectasia type 2 retinal lesions cone function and recovery in MacTel type 2. Invest Ophthalmol Vis Sci. 2015; 56: 778– 786. [DOI] [PMC free article] [PubMed] [Google Scholar]
- 30. Powner MB, Gillies MC, Zhu M, Vevis K, Hunyor AP, Fruttiger M. . Loss of Muller's cells and photoreceptors in macular telangiectasia type 2. Ophthalmology. 2013; 120: 2344– 2352. [DOI] [PubMed] [Google Scholar]
- 31. Powner MB, Gillies MC, Tretiach M,et al. Perifoveal muller cell depletion in a case of macular telangiectasia type 2. Ophthalmology. 2010; 117: 2407– 2416. [DOI] [PMC free article] [PubMed] [Google Scholar]