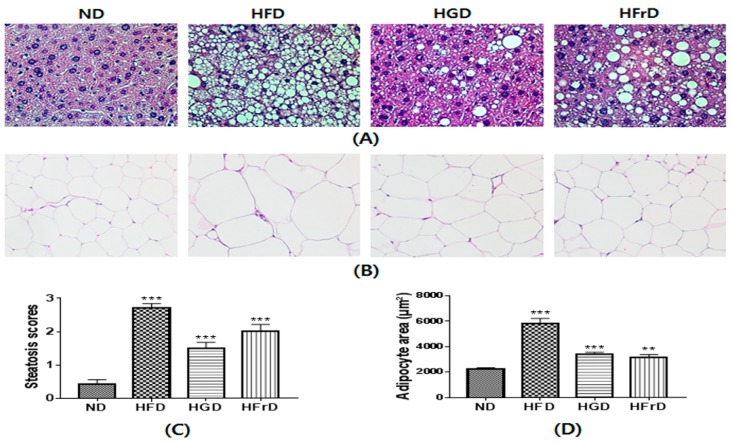
Figure 6.
HFD, HGD or HFrD-induced hepatic steatosis and adipocyte hypertrophy. (A,B) representative histological results of liver and WAT by hematoxylin and eosin staining; (C) steatosis score of liver; (D) quantification of adipocyte area. Values are expressed as means ± SEM for 3 mice per group (** p < 0.01, and *** p < 0.001 vs. ND).

