

ABSTRACT
Objective:
To evaluate the effect of a clinical management program involving education on hand function in patients with rhizarthritis.
Methods:
One hundred and eight patients with rhizarthritis and multiple arthritis (191 hands with clinical and radiographic rhizarthritis) followed for two years as part of an educational program on osteoarthritis were administered the SF-36, DASH, and HAQ questionnaires and measured for the strength of their palmar grip, pulp to pulp pinch, key (lateral) pinch, and tripod pinch at the time of inclusion and after 24 months. Age, race, level and frequency of physical activity, sex, body mass index, percentage of body fat, and degree of osteoarthritis were correlated to the test outcomes.
Results:
Women improved less than men on the HAQ (p=0.037). Each 1% reduction in fat percentage increased the chance of HAQ score improvement by 9.2% (p=0.038). Physical activity did not influence improvement in the parameters evaluated (p>0.05). Palmar grip improvement was affected by age and presence of rhizarthritis (p<0.05); patients with unilateral rhizarthritis improved 5.3 times more than patients without the disease (p=0.015), while improvement in palmar grip strength decreased 6.8% per year (p=0.004). Pulp pinch grip strength improved more in women than in men (p=0.018).
Conclusion:
Patients with rhizarthritis and multiple arthritis improved quality of life and grip strength through clinical treatment, an educational program, and fat loss. Level of Evidence II; Retrospective study.
Keywords: Hand deformities, acquired; Hand strength; Osteoarthritis; Knee; Health education; Fat body
RESUMO
Objetivo:
Avaliar o efeito de um programa de tratamento clínico com ensino da função das mãos em pacientes com rizoartrite.
Métodos:
Cento e oito indivíduos com rizoartrite e poliartrose (191 mãos com rizoartrite clínico-radiográfica) acompanhados por dois anos num programa educacional sobre osteoartrite responderam os questionários SF-36, DASH e HAQ e os testes de força de preensão palmar, pinça-polpa, pinça-chave e pinça-trípode no momento da inclusão e 24 meses depois. Idade, raça, nível e frequência de atividade física, sexo, índice de massa corporal, porcentagem de gordura corpórea, grau de osteoartrite foram correlacionados aos testes realizados.
Resultados:
As mulheres melhoraram em menor grau que homens no HAQ (p = 0,037) e cada redução de 1% no percentual de gordura aumenta 9,2% a chance de melhora no HAQ (p = 0,038). A atividade física não influenciou a melhora dos parâmetros avaliados (p > 0,05). Idade e presença de rizoartrite influenciam a melhora da preensão palmar (p < 0,05), sendo que pacientes com rizoartrite unilateral melhoram 5,3 vezes mais que pacientes sem a doença (p = 0,015) e a melhora da preensão diminui 6,8% por ano (p = 0,004). As mulheres melhoraram em maior grau que homens na pinça-polpa (p = 0,018).
Conclusão:
Pacientes com rizoartrite e poliartrose têm melhor qualidade de vida e força de preensão com o tratamento clínico, programa educacional e perda de gordura. Nível de Evidência II; Estudo retrospectivo.
Descritores: Deformidades adquiridas da mão, Força da mão, Osteoartrite, Joelho, Educação em saúde, Corpo adiposo
INTRODUCTION
Osteoarthritis (OA) is the most frequent cause of musculoskeletal disability worldwide.1,2 It is considered a final common pathway of several diseases3-6 characterized by degradation and loss of articular cartilage, sclerotic remodeling of the subchondral bone, formation of cysts and osteophytes at the edges of joints, contraction and loosening of the ligaments, muscular atrophy and contractures, and inflammation of the synovial membrane.6,7
OA can develop in any joint, but most frequently affects the knees, hips, hands, the facet joints, and feet. 8 The radiographic prevalence of OA of the hand varies from 27% to over 80%, 1 and symptomatic OA of the hand becomes more prevalent with age, and is more frequent in women and in certain races. 8 - 10
We created an educational program for patients with OA of the knee which from the outset included clinical and radiographic evaluation of all patient complaints, including the hands, in addition to classes on joint protection. 11 - 15 Approximately 70% of our sample was composed of patients with multiple OA and comorbidities, mainly affecting the knees, spine, and hands. 15 The program addressed holistic treatment of OA that extended beyond an educational program with or without classes and provided patients with routine diacerein, analgesics, hand orthotics, acupuncture and physiotherapy as required. Patients were always instructed to perform regular physical activity at least three times per week and to lose weight if they were overweight or obese.
The objective of this study is to verify whether the program and/or the personal characteristics for physical behavior and the degree of rhizarthritis in the patients improved arm function and hand grip strength.
METHODS
This retrospective study was conducted using data collected during the PARQVE Project (Project Arthritis Recovering Quality of Life through Education, Projeto Artrose Recuperando Qualidade de Vida pela Educação), 11 - 13 , 15 which was conducted in the Osteometabolic Diseases Group at the Instituto de Ortopedia e Traumatologia do Hospital das Clínicas da Faculdade de Medicina da Universidade de São Paulo (IOT-HC/FMUSP) from January 2012 to January 2014. The study was approved by the institutional review board for research ethics (CAPPesq, number 622/11).
To comprise the sample of this study, we selected patients who participated in the education program for knee OA (outpatients) who also presented arthritis of the trapezium-first metacarpal joint according to the classification by Eaton et al. 16 Other patient inclusion criteria were age 45 years or above, clinical and/or radiographic diagnosis of knee arthritis with knee pain requiring analgesics, no neurological pathologies, and the ability to understand and provide informed consent. 11 - 13 , 15
The exclusion criteria were: patients undergoing surgery during the study which would stop them from performing physical exercise, participation in another clinical trial or another nutritional support group, and patients without initial and final evaluations (complete clinical and radiological assessments) for carpal-metacarpal arthritis in the thumb.
Intervention
All patients received a book 17 and a DVD containing information about OA and lifestyle change, and were advised to read the material at least three times at home. The patients also received periodic reinforcement from the medical team (in the ambulatory follow-up visits every six months) related to daily practice of physical exercise and diet, as well as prescriptions for diacerein and analgesics, hand orthotics, acupuncture, and physiotherapy. 11 - 15 After two years in the project (after the last evaluation), some patients received viscosupplementation in the trapezium-first metacarpal joint, and all participated in one more day of class with the multiprofessional team, where occupational therapists taught the participants specific exercises for the hands. 17
Data Collection
At inclusion and at the end of two years, participants completed the SF-36 questionnaire (Medical Outcomes Study 36-Item Short-Form Health Survey), 18 the DASH assessment (Disabilities of the Arm, Shoulder and Hand), 19 and the HAQ (Health Assessment Questionnaire), 20 and underwent hand dynamometry, which quantified palmar grip strength, key (lateral) pinch strength, pulp to pulp pinch strength, and tripod pinch strength. Data were also collected on the type, frequency, and intensity of physical activity patients habitually practiced each week, as well data such as age, sex, race, educational level, weight, height, body mass index (BMI), and body fat percentage (BFP) were also collected. X-rays were taken of the hands of all patients.
The X-rays were analyzed by a group of three orthopedists and stratified according to the classification by Eaton et al. 17 When there was disagreement between the two observers, the third observer broke the tie.
The diagnosis of rhizarthritis was established if the patient had positive typical symptoms and/or radiographic signs of carpal-metacarpal arthritis of the thumb.
Statistical analysis
Improvement was considered to be a reduction of at least three points on the DASH, an increase of five points for quality of life scores (HAQ and SF-36), and for the other assessments, improvement of 5% between the initial and two-year evaluations. For the strength measurements, if one side improved by at least 5%, the patient was considered to have improved in the analyses in which the patient was evaluated as a whole, not the hands separately. Intense physical activity was defined as swimming, cycling, or weight lifting and/or frequency of more than 180 minutes of physical activity per week. The degrees of rhizarthritis were defined according to the classification by Eaton et al. 17
The quantitative characteristics were described according to the improvement in each criterion using summary measurements (mean, standard deviation, median, minimum, and maximum) and were compared using Student’s t-test or the Mann-Whitney tests. The improvements in each criterion were described according to the qualitative characteristics and association with likelihood ratio or chi-squared tests.
The odds ratios were estimated for each variable of interest with improvement in each criterion, along with their respective 95% confidence intervals using simple logistic regression.
Multiple logistic regression models were estimated, selecting the variables in the non-adjusted analysis which demonstrated a descriptive level below 0.2 (p<0.2), and in all models the rhizarthritis variable was maintained to verify the combined influence for reach of the improvement criteria.
To assess the degree to which rhizarthritis influenced improvement in strength measurements, the second degree forces were described using absolute and relative frequencies, and the relationship between the degree and the improvement in strength was assessed using generalized estimation equations with binomial distribution and the logit link function with an interchangeable correlation matrix.
To perform the analyses, IBM SPSS for Windows software version 20.0 was used, and Microsoft Excel 2003 was used to tabulate the data. The tests were performed at a 5% significance level.
RESULTS
Of the 195 patients with knee OA (isolated or multiple OA, with and without comorbidities) who completed the two-year program, 49 did not have complete clinical and radiological assessment of the hands and were excluded. Among the 146 patients with complete clinical and radiological assessments, 108 patients had clinical and/or radiographic rhizarthritis. (Figure 1)
Figure 1. Flow of study participants.
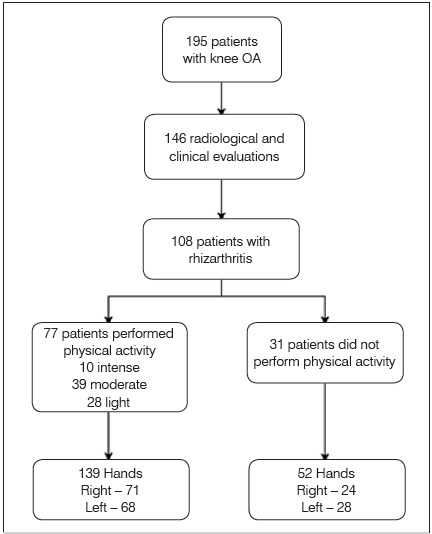
The 146-patient sample consisted of 112 women (76%) and 34 men, with an average age of 69.2±9.2 years (minimum 48, maximum 89 years) and 8±3 years of schooling; 93 declared their race as White, 17 Black, 31 mixed-race of African descent, 4 Asian, and 1 did not declare race. The initial mean BMI was 31.1±5.5 (minimum 20.06, maximum 49.0) and the mean final BMI was 31.14±5.7. The initial BFP was 36.10±8.5% (minimum 11.32%, maximum 52%) and the mean final BFP was 37.94±8.7%. Only 16 of the patients performed intense physical activity, while 43 did not perform any physical activity.
With regard to the diagnosis of carpal-metacarpal arthritis of the thumb 108 patients were diagnosed with rhizarthritis (38 without rhizarthritis); 83 had bilateral arthritis and 25 had unilateral rhizarthritis. A total of 191 hands with rhizarthritis were observed: 19 stage 1 on the Eaton scale (9.94%), 103 stage 2 (53.92%), 43 stage 3 (22.51%), and 26 stage 4 (13.61%). Of these, 77 patients practiced physical activity and 31 patients did not practice any physical activity.
The DASH score decreased from 34.0±19.5 to 27.9±18.5 over the 2-year study period, and the HAQ score dropped from 0.80±0.5 to 0.68±0.4.
Average palmar grip strength decreased from 22.6±9.6 to 21.3±7.4 (22.4±9.5 to 21.5±7.4 in the right arm (RA) and 22.8±9.6 to 21.1±7.4 in the left arm (LA); the average pulp to pulp pinch strength rose from 4.0±1.7 to 4.4±1.4 (4.1±1.8 to 4.6±1.4 in the RA and 3.9±1.6 to 4.2±1.3 in the LA); the average key (lateral ) pinch strength rose from 6.2±2.3 to 6.7±2.1 (6.4±2.5 to 7.0±2.1 in the RA and 6.0±2.1 to 6.4±2.1 in the LA); and the average tripod pinch strength increased from 5.0±2.0 to 5.4±1.8 (5.2±2.1 to 5.6±1.8 in the RA and 4.9±1.8 to 5.3±1.7 in the LA).
In the statistical analysis of the questionnaires, only race influenced improvement in physical quality of life (SF-36-PCS, p<0.05); after adjustment, the chance of improvement in Black patients was 4.76 times the chance of improvement in white patients (p=0.015). The presence of rhizarthritis also did not influence improvement in PCS (p>0.05). (Table 1) With regard to improvement in psychological quality of life (SF-36-MCS), only the time of study in isolation had an influence on improvement (p=0.042), but after adjusting for the other selected characteristics, no assessed variable influenced the score (p>0.05). (Table 2) None of the evaluated characteristics influenced improvement in the DASH (p>0.05). (Table 3) We found that women had 79% less chance of improvement in HAQ score than men (p=0.037) and each 1% decrease in body fat percentage increased the chance of improvement in the HAQ by 9.2% (p=0.038), although in most patients the body fat percentage worsened (mean and median values were negative). (Table 4)
Table 1. Improvement in the physical component of the SF-36 (PCS) according to qualitative characteristics and the results of the statistical tests.
| Variable | Improvement in Physical Component of the SF-36 (PCS) | Total | OR not adjusted | 95% CI | p | OR adjusted | 95% CI | p | |||
|---|---|---|---|---|---|---|---|---|---|---|---|
| No | Yes | Below | Above | Below | Above | ||||||
| Type of physical activity, n (%) | 0.408 | ||||||||||
| None | 29 (70.7) | 12 (29.3) | 41 | 1.00 | |||||||
| Class text/Stretching | 20 (62.5) | 12 (37.5) | 32 | 1.45 | 0.54 | 3.87 | |||||
| Walking/Gymnastics/Water aerobics | 36 (70.6) | 15 (29.4) | 51 | 1.01 | 0.41 | 2.48 | |||||
| Swimming/Cycling/Lifting Weights | 8 (50) | 8 (50) | 16 | 2.42 | 0.74 | 7.93 | |||||
| Intensity of physical activity, n (%) | 0.484# | ||||||||||
| None | 31 (72.1) | 12 (27.9) | 43 | 1.00 | |||||||
| Light Activity | 39 (63.9) | 22 (36.1) | 61 | 1.46 | 0.63 | 3.40 | |||||
| Moderate Activity | 19 (67.9) | 9 (32.1) | 28 | 1.22 | 0.43 | 3.45 | |||||
| Intense activity | 3 (42.9) | 4 (57.1) | 7 | 3.44 | 0.67 | 17.73 | |||||
| Sex, n (%) | 0.111 | ||||||||||
| Male | 25 (78.1) | 7 (21.9) | 32 | 1.00 | 1.00 | ||||||
| Female | 68 (63) | 40 (37) | 108 | 2.10 | 0.83 | 5.30 | 2.10 | 0.51 | 8.55 | 0.303 | |
| Race, n (%) | 0.036# | ||||||||||
| White | 60 (68.2) | 28 (31.8) | 88 | 1.00 | 1.00 | ||||||
| Mixed race of African descent | 22 (73.3) | 8 (26.7) | 30 | 0.78 | 0.31 | 1.97 | 0.98 | 0.37 | 2.62 | 0.966 | |
| Black | 7 (41.2) | 10 (58.8) | 17 | 3.06 | 1.06 | 8.88 | 4.76 | 1.35 | 16.76 | 0.015 | |
| Asian | 4 (100) | 0 (0) | 4 | & | & | ||||||
| Rhiz, n (%) | 0.336 | ||||||||||
| No arthritis | 26 (72.2) | 10 (27.8) | 36 | 1.00 | 1.00 | ||||||
| Unilateral arthritis | 10 (52.6) | 9 (47.4) | 19 | 2.34 | 0.73 | 7.46 | 3.11 | 0.80 | 12.16 | 0.103 | |
| Bilateral arthritis | 57 (67.1) | 28 (32.9) | 85 | 1.28 | 0.54 | 3.01 | 1.79 | 0.65 | 4.94 | 0.260 | |
| Minutes per week | 1.002 | 1.000 | 1.005 | 0.160* | 1.003 | 1.000 | 1.006 | 0.058 | |||
| Mean (SD) | 104.7 (113.6) | 144.8 (163.8) | 118.2 (133.3) | ||||||||
| Median (min; max) | 90 (0; 480) | 120 (0; 840) | 90 (0; 840) | ||||||||
| Age (years) | 1.019 | 0.980 | 1.059 | 0.353 | |||||||
| Mean (SD) | 68.6 (9.3) | 70.1 (8.6) | 69.1 (9.1) | ||||||||
| Median (min; max) | 69 (48; 89) | 71 (50; 86) | 69 (48; 89) | ||||||||
| Study Time (years) | 0.950 | 0.841 | 1.072 | 0.260* | |||||||
| Mean (SD) | 8.2 (2.7) | 7.8 (3.4) | 8.1 (3) | ||||||||
| Median (min; max) | 8 (1; 15) | 8 (1; 15) | 8 (1; 15) | ||||||||
| BMI (kg/m2) | 1.037 | 0.974 | 1.104 | 0.261 | |||||||
| Mean (SD) | 30.7 (5.6) | 31.8 (5.7) | 31.1 (5.6) | ||||||||
| Median (min; max) | 29.8 (20.8; 48) | 31 (19.8; 49.9) | 30.5 (19.8; 49.9) | ||||||||
| % Body Fat (PBF) | 1.030 | 0.986 | 1.076 | 0.185 | 1.004 | 0.940 | 1.073 | 0.897 | |||
| Mean (SD) | 37.2 (8.5) | 39.3 (9.1) | 37.9 (8.7) | ||||||||
| Median (min; max) | 39.7 (14.1; 48.7) | 41.3 (10.1; 49.1) | 40.4 (10.1; 49.1) | ||||||||
| BMI Variation (kg/m2) | 1.027 | 0.838 | 1.259 | 0.799 | |||||||
| Mean (SD) | -0.08 (1.8) | 0.01 (1.68) | -0.05 (1.76) | ||||||||
| Median (min; max) | -0.01 (-7.82; 4.42) | -0.02 (-3.21; 4.44) | -0.01 (-7.82; 4.44) | ||||||||
| Variation % Body Fat | 0.977 | 0.917 | 1.041 | 0.479 | |||||||
| Mean (SD) | -1.43 (5) | -2.19 (7.38) | -1.7 (5.93) | ||||||||
| Median (min; max) | -1.54 (-16.72; 14.62) | -2.14 (-17.88; 35.72) | -1.79 (-17.88; 35.72) | ||||||||
Chi-squared test; # Likelihood ratio test; * Mann-Whitney test; ** Student's t-test; OR: Odds Ratio; CI: Confidence interval; Logistic regression results
Table 2. Improvement in the mental component of the SF-36 (MCS) according to qualitative characteristics and the results of the statistical tests.
| Variable | Improvement in Mental Component of the SF-36 (MCS) | Total | OR not adjusted | 95% CI | p | OR adjusted | 95% CI | p | |||
|---|---|---|---|---|---|---|---|---|---|---|---|
| No | Yes | Below | Above | Below | Above | ||||||
| Type of physical activity, n (%) | 0.303 | ||||||||||
| None | 29 (70.7) | 12 (29.3) | 41 | 1.00 | |||||||
| Class text/Stretching | 23 (71.9) | 9 (28.1) | 32 | 0.95 | 0.34 | 2.63 | |||||
| Walking/Gymnastics/Water aerobics | 28 (54.9) | 23 (45.1) | 51 | 1.99 | 0.83 | 4.74 | |||||
| Swimming/Cycling/Lifting Weights | 11 (68.8) | 5 (31.2) | 16 | 1.10 | 0.31 | 3.85 | |||||
| Intensity of physical activity, n (%) | 0.522# | ||||||||||
| None | 29 (67.4) | 14 (32.6) | 43 | 1.00 | |||||||
| Light Activity | 38 (62.3) | 23 (37.7) | 61 | 1.25 | 0.55 | 2.85 | |||||
| Moderate Activity | 20 (71.4) | 8 (28.6) | 28 | 0.83 | 0.29 | 2.34 | |||||
| Intense activity | 3 (42.9) | 4 (57.1) | 7 | 2.76 | 0.54 | 14.06 | |||||
| Sex, n (%) | 0.353 | ||||||||||
| Male | 23 (71.9) | 9 (28.1) | 32 | 1.00 | |||||||
| Female | 68 (63) | 40 (37) | 108 | 1.50 | 0.63 | 3.57 | |||||
| Race, n (%) | 0.195# | ||||||||||
| White | 55 (62.5) | 33 (37.5) | 88 | 1.00 | 1.00 | ||||||
| Mixed race of African descent | 24 (80) | 6 (20) | 30 | 0.42 | 0.15 | 1.13 | 0.50 | 0.17 | 1.46 | 0.202 | |
| Black | 9 (52.9) | 8 (47.1) | 17 | 1.48 | 0.52 | 4.22 | 1.56 | 0.47 | 5.24 | 0.468 | |
| Asian | 3 (75) | 1 (25) | 4 | 0.56 | 0.06 | 5.56 | 0.99 | 0.08 | 12.70 | 0.993 | |
| Rhiz, n (%) | 0.808 | ||||||||||
| No arthritis | 22 (61.1) | 14 (38.9) | 36 | 1.00 | 1.00 | ||||||
| Unilateral arthritis | 12 (63.2) | 7 (36.8) | 19 | 0.92 | 0.29 | 2.89 | 1.02 | 0.27 | 3.90 | 0.978 | |
| Bilateral arthritis | 57 (67.1) | 28 (32.9) | 85 | 0.77 | 0.34 | 1.73 | 1.07 | 0.41 | 2.80 | 0.893 | |
| Minutes per week | 1.000 | 0.997 | 1.002 | 0.754* | |||||||
| Mean (SD) | 119.5 (141.9) | 115.7 (117.1) | 118.2 (133.3) | ||||||||
| Median (min; max) | 90 (0; 840) | 120 (0; 600) | 90 (0; 840) | ||||||||
| Age (years) | 0.966 | 0.929 | 1.005 | 0.086** | 0.973 | 0.931 | 1.017 | 0.222 | |||
| Mean (SD) | 70 (8.4) | 67.3 (10) | 69.1 (9.1) | ||||||||
| Median (min; max) | 70 (50; 86) | 67 (48; 89) | 69 (48; 89) | ||||||||
| Study Time (years) | 1.152 | 1.018 | 1.303 | 0.042* | 1.117 | 0.973 | 1.282 | 0.115 | |||
| Mean (SD) | 7.6 (2.9) | 8.8 (3) | 8.1 (3) | ||||||||
| Median (min; max) | 8 (1; 15) | 8 (2; 15) | 8 (1; 15) | ||||||||
| BMI (kg/m2) | 1.031 | 0.969 | 1.098 | 0.336** | 1.010 | 0.943 | 1.082 | 0.773 | |||
| Mean (SD) | 30.7 (6) | 31.7 (4.7) | 31.1 (5.6) | ||||||||
| Median (min; max) | 29.8 (19.8; 49.9) | 31.2 (24; 45.8) | 30.5 (19.8; 49.9) | ||||||||
| % Body Fat (PBF) | 1.022 | 0.979 | 1.067 | 0.313** | |||||||
| Mean (SD) | 37.4 (9.1) | 39 (7.9) | 37.9 (8.7) | ||||||||
| Median (min; max) | 40.3 (12; 49.1) | 40.4 (10.1; 48.5) | 40.4 (10.1; 49.1) | ||||||||
| BMI Variation (kg/m2) | 1.225 | 0.985 | 1.525 | 0.065** | |||||||
| Mean (SD) | -0.25 (1.6) | 0.34 (1.96) | -0.05 (1.76) | ||||||||
| Median (min; max) | -0.15 (-7.82; 4.42) | 0.22 (-4.35; 4.44) | -0.01 (-7.82; 4.44) | ||||||||
| Variation % Body Fat | 1.031 | 0.970 | 1.095 | 0.323** | |||||||
| Mean (SD) | -2.06 (5.2) | -0.99 (7.14) | -1.7 (5.93) | ||||||||
| Median (min; max) | -1.79 (-17.88; 14.62) | -2 (-16.29; 35.72) | -1.79 (-17.88; 35.72) | ||||||||
Chi-squared test; # Likelihood ratio test; * Mann-Whitney test; ** Student’s t-test; OR: Odds Ratio; CI: Confidence interval; Logistic regression results
Table 3. Improvement in the DASH according to qualitative characteristics and the results of the statistical tests.
| Variable | DASH improvement | Total | OR not adjusted | 95% CI | p | OR adjusted | 95% CI | p | |||
|---|---|---|---|---|---|---|---|---|---|---|---|
| No | Yes | Below | Above | Below | Above | ||||||
| Type of physical activity, n (%) | 0.896 | ||||||||||
| None | 19 (54.3) | 16 (45.7) | 35 | 1.00 | |||||||
| Class text/Stretching | 14 (45.2) | 17 (54.8) | 31 | 1.44 | 0.55 | 3.81 | |||||
| Walking/Gymnastics/Water aerobics | 23 (47.9) | 25 (52.1) | 48 | 1.29 | 0.54 | 3.09 | |||||
| Swimming/Cycling/Lifting Weights | 8 (50) | 8 (50) | 16 | 1.19 | 0.36 | 3.88 | |||||
| Intensity of physical activity, n (%) | 0.656# | ||||||||||
| None | 21 (56.8) | 16 (43.2) | 37 | 1.00 | |||||||
| Light Activity | 25 (43.9) | 32 (56.1) | 57 | 1.68 | 0.73 | 3.87 | |||||
| Moderate Activity | 14 (50) | 14 (50) | 28 | 1.31 | 0.49 | 3.52 | |||||
| Intense activity | 3 (42.9) | 4 (57.1) | 7 | 1.75 | 0.34 | 8.95 | |||||
| Sex, n (%) | 0.251 | ||||||||||
| Male | 17 (58.6) | 12 (41.4) | 29 | 1.00 | |||||||
| Female | 47 (46.5) | 54 (53.5) | 101 | 1.63 | 0.71 | 3.76 | |||||
| Race, n (%) | 0.568# | ||||||||||
| White | 37 (45.7) | 44 (54.3) | 81 | 1.00 | |||||||
| Mixed race of African descent | 16 (55.2) | 13 (44.8) | 29 | 0.68 | 0.29 | 1.60 | |||||
| Black | 8 (53.3) | 7 (46.7) | 15 | 0.74 | 0.24 | 2.22 | |||||
| Asian | 3 (75) | 1 (25) | 4 | 0.28 | 0.03 | 2.81 | |||||
| Rhiz, n (%) | 0.202 | ||||||||||
| No arthritis | 21 (61.8) | 13 (38.2) | 34 | 1.00 | 1.00 | ||||||
| Unilateral arthritis | 7 (38.9) | 11 (61.1) | 18 | 2.54 | 0.79 | 8.21 | 2.61 | 0.79 | 8.58 | 0.114 | |
| Bilateral arthritis | 36 (46.2) | 42 (53.8) | 78 | 1.89 | 0.83 | 4.29 | 2.03 | 0.87 | 4.73 | 0.100 | |
| Minutes per week | 1.000 | 0.997 | 1.002 | 0.841* | |||||||
| Mean (SD) | 127 (153.6) | 118.6 (113.6) | 122.7 (134.3) | ||||||||
| Median (min; max) | 95 (0; 840) | 102.5 (0; 480) | 100 (0; 840) | ||||||||
| Age (years) | 0.980 | 0.943 | 1.019 | 0.307** | |||||||
| Mean (SD) | 70.2 (8.3) | 68.6 (9.6) | 69.4 (9) | ||||||||
| Median (min; max) | 69 (54; 89) | 69 (48; 89) | 69 (48; 89) | ||||||||
| Study Time (years) | 0.956 | 0.849 | 1.076 | 0.306* | |||||||
| Mean (SD) | 8.1 (3.1) | 7.7 (2.7) | 7.9 (2.9) | ||||||||
| Median (min; max) | 8 (1; 15) | 8 (2; 15) | 8 (1; 15) | ||||||||
| BMI (kg/m2) | 1.008 | 0.948 | 1.072 | 0.802** | |||||||
| Mean (SD) | 31 (5.2) | 31.2 (6.1) | 31.1 (5.6) | ||||||||
| Median (min; max) | 30.5 (22.4; 46.8) | 30.6 (19.8; 49.9) | 30.6 (19.8; 49.9) | ||||||||
| % Body Fat (PBF) | 1.027 | 0.986 | 1.070 | 0.200** | 1.027 | 0.984 | 1.071 | 0.220 | |||
| Mean (SD) | 37.1 (9.2) | 39.1 (8) | 38.1 (8.7) | ||||||||
| Median (min; max) | 40.4 (10.1; 48.7) | 40.8 (12; 49.1) | 40.4 (10.1; 49.1) | ||||||||
| BMI Variation (kg/m2) | 1.110 | 0.904 | 1.364 | 0.318** | |||||||
| Mean (SD) | -0.19 (1.8) | 0.12 (1.63) | -0.04 (1.74) | ||||||||
| Median (min; max) | -0.11 (-7.82; 4.44) | 0.29 (-4.35; 4.02) | 0.05 (-7.82; 4.44) | ||||||||
| Variation % Body Fat | 0.972 | 0.915 | 1.033 | 0.358** | |||||||
| Mean (SD) | -1.28 (7.1) | -2.26 (4.7) | -1.77 (6.01) | ||||||||
| Median (min; max) | -1.07 (-17.88; 35.72) | -2.46 (-16.29; 9.09) | -1.86 (-17.88; 35.72) | ||||||||
Chi-squared test; # Likelihood ratio test; * Mann-Whitney test; ** Student’s t-test; OR: Odds Ratio; CI: Confidence interval; Logistic regression results
Table 4. Improvement in the HAQ according to qualitative characteristics and the results of the statistical tests.
| Variable | HAQ improvement | Total | OR not adjusted | 95% CI | p | OR adjusted | 95% CI | p | |||
|---|---|---|---|---|---|---|---|---|---|---|---|
| No | Yes | Below | Above | Below | Above | ||||||
| Type of physical activity, n (%) | 0.168 | ||||||||||
| None | 21 (58.3) | 15 (41.7) | 36 | 1.00 | 1.00 | ||||||
| Class text/Stretching | 11 (35.5) | 20 (64.5) | 31 | 2.55 | 0.95 | 6.85 | 0.77 | 0.04 | 14.00 | 0.857 | |
| Walking/Gymnastics/Water aerobics | 23 (47.9) | 25 (52.1) | 48 | 1.52 | 0.64 | 3.64 | 0.44 | 0.02 | 9.04 | 0.597 | |
| Swimming/Cycling/Lifting Weights | 5 (31.2) | 11 (68.8) | 16 | 3.08 | 0.89 | 10.73 | 0.61 | 0.02 | 17.66 | 0.776 | |
| Intensity of physical activity, n (%) | 0.134# | ||||||||||
| None | 23 (60.5) | 15 (39.5) | 38 | 1.00 | 1.00 | ||||||
| Light Activity | 25 (43.9) | 32 (56.1) | 57 | 1.96 | 0.85 | 4.52 | 3.75 | 0.21 | 68.54 | 0.373 | |
| Moderate Activity | 9 (32.1) | 19 (67.9) | 28 | 3.24 | 1.16 | 9.03 | 7.38 | 0.36 | 151.88 | 0.195 | |
| Intense activity | 3 (42.9) | 4 (57.1) | 7 | 2.04 | 0.40 | 10.46 | 2.96 | 0.09 | 99.47 | 0.545 | |
| Sex, n (%) | 0.070 | ||||||||||
| Male | 9 (31) | 20 (69) | 29 | 1.00 | 1.00 | ||||||
| Female | 51 (50) | 51 (50) | 102 | 0.45 | 0.19 | 1.08 | 0.21 | 0.05 | 0.91 | 0.037 | |
| Race, n (%) | 0.648# | ||||||||||
| White | 38 (46.3) | 44 (53.7) | 82 | 1.00 | |||||||
| Mixed race of African descent | 12 (41.4) | 17 (58.6) | 29 | 1.22 | 0.52 | 2.88 | |||||
| Black | 7 (46.7) | 8 (53.3) | 15 | 0.99 | 0.33 | 2.98 | |||||
| Asian | 3 (75) | 1 (25) | 4 | 0.29 | 0.03 | 2.88 | |||||
| Rhiz, n (%) | 0.518# | ||||||||||
| No arthritis | 16 (47.1) | 18 (52.9) | 34 | 1.00 | 1.00 | ||||||
| Unilateral arthritis | 6 (33.3) | 12 (66.7) | 18 | 1.78 | 0.54 | 5.84 | 3.75 | 0.95 | 14.72 | 0.058 | |
| Bilateral arthritis | 38 (48.1) | 41 (51.9) | 79 | 0.96 | 0.43 | 2.15 | 1.15 | 0.44 | 3.03 | 0.773 | |
| Minutes per week | 1.00 | 0.999 | 1.005 | 0.318* | |||||||
| Mean (SD) | 103 (103.7) | 137.7 (154.4) | 121.8 (134.2) | ||||||||
| Median (min; max) | 95 (0; 350) | 100 (0; 840) | 100 (0; 840) | ||||||||
| Age (years) | 0.973 | 0.935 | 1.012 | 0.166** | 0.967 | 0.922 | 1.015 | 0.177 | |||
| Mean (SD) | 70.6 (7.6) | 68.4 (9.9) | 69.4 (8.9) | ||||||||
| Median (min; max) | 70 (55; 86) | 69 (48; 89) | 69 (48; 89) | ||||||||
| Study Time (years) | 0.924 | 0.819 | 1.042 | 0.198* | 0.903 | 0.784 | 1.040 | 0.158 | |||
| Mean (SD) | 8.3 (2.8) | 7.6 (3) | 7.9 (2.9) | ||||||||
| Median (min; max) | 8 (1; 15) | 8 (1; 15) | 8 (1; 15) | ||||||||
| BMI (kg/m2) | 0.986 | 0.927 | 1.049 | 0.653** | |||||||
| Mean (SD) | 31.3 (6) | 30.9 (5.3) | 31.1 (5.6) | ||||||||
| Median (min; max) | 30.4 (19.8; 48) | 30.7 (20.8; 49.9) | 30.6 (19.8; 49.9) | ||||||||
| % Body Fat (PBF) | 0.970 | 0.931 | 1.012 | 0.159** | 1.046 | 0.971 | 1.127 | 0.234 | |||
| Mean (SD) | 39.3 (8.1) | 37.1 (9) | 38.1 (8.6) | ||||||||
| Median (min; max) | 41.2 (12; 48.7) | 39.9 (10.1; 49.1) | 40.4 (10.1; 49.1) | ||||||||
| BMI Variation (kg/m2) | 1.105 | 0.905 | 1.349 | 0.329** | |||||||
| Mean (SD) | -0.17 (1.9) | 0.14 (1.62) | 0 (1.78) | ||||||||
| Median (min; max) | 0.03 (-7.82; 4.42) | 0.2 (-4.35; 4.44) | 0.08 (-7.82; 4.44) | ||||||||
| Variation % Body Fat | 1.058 | 0.990 | 1.130 | 0.090** | 1.092 | 1.005 | 1.186 | 0.038 | |||
| Mean (SD) | -2.67 (5.4) | -0.87 (6.45) | -1.71 (6.03) | ||||||||
| Median (min; max) | -1.86 (-17.88; 8.04) | -1.79 (-12.45; 35.72) | -1.79 (-17.88; 35.72) | ||||||||
Chi-squared test; # Likelihood ratio test; * Mann-Whitney test; ** Student’s t-test; OR: Odds Ratio; CI: Confidence interval; Logistic regression results
In the analysis of the data for strength, age and the presence of rhizarthritis both separately and jointly influenced improved grip strength (p<0.05). After adjustment, the chance of improved grip in patients with unilateral rhizarthritis was 5.30 times the chance of improvement than in patients without rhizarthritis (p=0.015), and for each additional year of patient age the chance of improved grip decreased 6.8% (p=0.004). (Table 5) For pulp to pulp pinch strength, the only factor which influenced improvement was sex (p<0.05), and after adjustment, female patients had a 2.95 greater chance of improvement than male patients (p=0.018). (Table 6) With regard to the evaluation of key (lateral) pinch or tripod pinch strength, none of the evaluated characteristics influenced improvement, alone or after adjustment (p>0.05).
Table 5. Improvement in palmar strength according to qualitative characteristics and the results of the statistical tests.
| Variable | Improvement in Palmar Grip | Total | OR not adjusted | 95% CI | p | OR adjusted | 95% CI | p | |||
|---|---|---|---|---|---|---|---|---|---|---|---|
| No | Yes | Below | Above | Below | Above | ||||||
| Type of physical activity, n (%) | 0.676 | ||||||||||
| None | 23 (65.7) | 12 (34.3) | 35 | 1.00 | |||||||
| Class text/Stretching | 19 (61.3) | 12 (38.7) | 31 | 1.21 | 0.44 | 3.31 | |||||
| Walking/Gymnastics/Water aerobics | 28 (60.9) | 18 (39.1) | 46 | 1.23 | 0.49 | 3.08 | |||||
| Swimming/Cycling/Lifting Weights | 6 (46.2) | 7 (53.8) | 13 | 2.24 | 0.61 | 8.16 | |||||
| Intensity of physical activity, n (%) | 0.890# | ||||||||||
| None | 24 (64.9) | 13 (35.1) | 37 | 1.00 | |||||||
| Light Activity | 33 (58.9) | 23 (41.1) | 56 | 1.29 | 0.55 | 3.04 | |||||
| Moderate Activity | 15 (60) | 10 (40) | 25 | 1.23 | 0.43 | 3.51 | |||||
| Intense activity | 3 (50) | 3 (50) | 6 | 1.85 | 0.33 | 10.49 | |||||
| Sex, n (%) | 0.111 | ||||||||||
| Male | 20 (74.1) | 7 (25.9) | 27 | 1.00 | 1.00 | ||||||
| Female | 56 (57.1) | 42 (42.9) | 98 | 2.14 | 0.83 | 5.54 | 1.79 | 0.44 | 7.21 | 0.414 | |
| Race, n (%) | 0.412# | ||||||||||
| White | 52 (65.8) | 27 (34.2) | 79 | 1.00 | |||||||
| Mixed race of African descent | 13 (48.1) | 14 (51.9) | 27 | 2.07 | 0.86 | 5.03 | |||||
| Black | 9 (64.3) | 5 (35.7) | 14 | 1.07 | 0.33 | 3.51 | |||||
| Asian | 2 (50) | 2 (50) | 4 | 1.93 | 0.26 | 14.44 | |||||
| Rhiz, n (%) | 0.033 | ||||||||||
| No arthritis | 20 (62.5) | 12 (37.5) | 32 | 1.00 | 1.00 | ||||||
| Unilateral arthritis | 6 (33.3) | 12 (66.7) | 18 | 3.33 | 0.99 | 11.22 | 5.30 | 1.38 | 20.28 | 0.015 | |
| Bilateral arthritis | 50 (66.7) | 25 (33.3) | 75 | 0.83 | 0.35 | 1.97 | 1.51 | 0.58 | 3.97 | 0.403 | |
| Minutes per week | 1.000 | 0.997 | 1.003 | 0.567* | |||||||
| Mean (SD) | 119.4 (145.3) | 120 (117) | 119.6 (134.4) | ||||||||
| Median (min; max) | 95 (0; 840) | 90 (0; 480) | 90 (0; 840) | ||||||||
| Age (years) | 0.939 | 0.899 | 0.980 | 0.003** | 0.932 | 0.888 | 0.977 | 0.004 | |||
| Mean (SD) | 71.4 (9.2) | 66.6 (8) | 69.5 (9) | ||||||||
| Median (min; max) | 71.5 (48; 89) | 64 (54; 89) | 69 (48; 89) | ||||||||
| Study Time (years) | 1.086 | 0.960 | 1.229 | 0.553* | |||||||
| Mean (SD) | 7.7 (2.6) | 8.4 (3.5) | 8 (3) | ||||||||
| Median (min; max) | 8 (1; 15) | 8 (1; 15) | 8 (1; 15) | ||||||||
| BMI (kg/m2) | 1.032 | 0.967 | 1.101 | 0.344** | |||||||
| Mean (SD) | 30.6 (5.6) | 31.6 (5.5) | 31 (5.6) | ||||||||
| Median (min; max) | 30.4 (19.8; 49.9) | 30.6 (23; 46.8) | 30.5 (19.8; 49.9) | ||||||||
| % Body Fat (PBF) | 1.031 | 0.986 | 1.078 | 0.182** | 1.007 | 0.945 | 1.073 | 0.833 | |||
| Mean (SD) | 37.2 (9.4) | 39.4 (7.2) | 38.1 (8.6) | ||||||||
| Median (min; max) | 40.4 (10.1; 49.1) | 40.6 (17.6; 49) | 40.4 (10.1; 49.1) | ||||||||
| BMI Variation (kg/m2) | 0.985 | 0.804 | 1.207 | 0.885** | |||||||
| Mean (SD) | -0.03 (1.7) | -0.08 (1.99) | -0.05 (1.79) | ||||||||
| Median (min; max) | -0.01 (-4.35; 4.44) | 0.13 (-7.82; 4.02) | 0.01 (-7.82; 4.44) | ||||||||
| Variation % Body Fat | 0.999 | 0.942 | 1.061 | 0.982** | |||||||
| Mean (SD) | -1.65 (6.5) | -1.68 (5.53) | -1.66 (6.12) | ||||||||
| Median (min; max) | -1.79 (-17.88; 35.72) | -1.98 (-16.72; 14.62) | -1.79 (-17.88; 35.72) | ||||||||
Chi-squared test; # Likelihood ratio test; * Mann-Whitney test; ** Student’s t-test; OR: Odds Ratio; CI: Confidence interval; Logistic regression results
Table 6. Improvement in pulp pinch strength according to qualitative characteristics and the results of the statistical tests.
| Variable | Pulp Pinch Grip Improvement | Total | OR not adjusted | 95% CI | p | OR adjusted | 95% CI | p | |||
|---|---|---|---|---|---|---|---|---|---|---|---|
| No | Yes | Below | Above | Below | Above | ||||||
| Type of physical activity, n (%) | 0.788# | ||||||||||
| None | 10 (29.4) | 24 (70.6) | 34 | 1.00 | |||||||
| Class text/Stretching | 8 (25.8) | 23 (74.2) | 31 | 1.20 | 0.40 | 3.57 | |||||
| Walking/Gymnastics/Water aerobics | 17 (36.2) | 30 (63.8) | 47 | 0.74 | 0.29 | 1.90 | |||||
| Swimming/Cycling/Lifting Weights | 4 (28.6) | 10 (71.4) | 14 | 1.04 | 0.26 | 4.12 | |||||
| Intensity of physical activity, n (%) | 0.435# | ||||||||||
| None | 12 (33.3) | 24 (66.7) | 36 | 1.00 | |||||||
| Light Activity | 14 (24.6) | 43 (75.4) | 57 | 1.54 | 0.61 | 3.85 | |||||
| Moderate Activity | 11 (42.3) | 15 (57.7) | 26 | 0.68 | 0.24 | 1.93 | |||||
| Intense activity | 2 (33.3) | 4 (66.7) | 6 | 1.00 | 0.16 | 6.26 | |||||
| Sex, n (%) | 0.013 | ||||||||||
| Male | 14 (50) | 14 (50) | 28 | 1.00 | 1.00 | ||||||
| Female | 25 (25.5) | 73 (74.5) | 98 | 2.92 | 1.23 | 6.96 | 2.95 | 1.21 | 7.19 | 0.018 | |
| Race, n (%) | 0.211# | ||||||||||
| White | 24 (30.4) | 55 (69.6) | 79 | 1.00 | |||||||
| Mixed race of African descent | 6 (21.4) | 22 (78.6) | 28 | 1.60 | 0.58 | 4.45 | |||||
| Black | 8 (53.3) | 7 (46.7) | 15 | 0.38 | 0.12 | 1.17 | |||||
| Asian | 1 (33.3) | 2 (66.7) | 3 | 0.87 | 0.08 | 10.09 | |||||
| Rhiz, n (%) | 0.400 | ||||||||||
| No arthritis | 13 (39.4) | 20 (60.6) | 33 | 1.00 | 1.00 | ||||||
| Unilateral arthritis | 4 (22.2) | 14 (77.8) | 18 | 2.28 | 0.61 | 8.45 | 1.93 | 0.51 | 7.33 | 0.335 | |
| Bilateral arthritis | 22 (29.3) | 53 (70.7) | 75 | 1.57 | 0.67 | 3.69 | 1.71 | 0.71 | 4.15 | 0.234 | |
| Minutes per week | 0.999 | 0.996 | 1.002 | 0.632* | |||||||
| Mean (SD) | 133.2 (135.5) | 116.7 (133.6) | 121.8 (133.9) | ||||||||
| Median (min; max) | 120 (0; 480) | 90 (0; 840) | 95 (0; 840) | ||||||||
| Age (years) | 1.008 | 0.967 | 1.051 | 0.714** | |||||||
| Mean (SD) | 69.1 (8.6) | 69.8 (9.3) | 69.6 (9.1) | ||||||||
| Median (min; max) | 69 (50; 89) | 70 (48; 89) | 69.5 (48; 89) | ||||||||
| Study Time (years) | 0.956 | 0.841 | 1.085 | 0.287* | |||||||
| Mean (SD) | 8.2 (2.8) | 7.8 (3.1) | 7.9 (3) | ||||||||
| Median (min; max) | 8 (1; 15) | 8 (1; 15) | 8 (1; 15) | ||||||||
| BMI (kg/m2) | 0.982 | 0.918 | 1.050 | 0.599** | |||||||
| Mean (SD) | 31.5 (6.8) | 30.9 (5) | 31.1 (5.6) | ||||||||
| Median (min; max) | 30.7 (19.8; 49.9) | 30.4 (22.4; 48) | 30.6 (19.8; 49.9) | ||||||||
| % Body Fat (PBF) | 1.008 | 0.965 | 1.053 | 0.715** | |||||||
| Mean (SD) | 37.7 (9.8) | 38.3 (8.1) | 38.1 (8.6) | ||||||||
| Median (min; max) | 40.4 (12; 49.1) | 40.4 (10.1; 49) | 40.4 (10.1; 49.1) | ||||||||
| BMI Variation (kg/m2) | 1.055 | 0.852 | 1.306 | 0.625** | |||||||
| Mean (SD) | -0.14 (1.6) | 0.04 (1.86) | -0.02 (1.79) | ||||||||
| Median (min; max) | 0.13 (-3.75; 3.36) | 0.01 (-7.82; 4.44) | 0.05 (-7.82; 4.44) | ||||||||
| Variation % Body Fat | 0.987 | 0.928 | 1.050 | 0.683** | |||||||
| Mean (SD) | -1.29 (4.7) | -1.78 (6.68) | -1.62 (6.1) | ||||||||
| Median (min; max) | -0.46 (-17.88; 8.04) | -2.14 (-16.72; 35.72) | -1.79 (-17.88; 35.72) | ||||||||
Chi-squared test; # Likelihood ratio test; * Mann-Whitney test; ** Student’s t-test; OR: Odds Ratio; CI: Confidence interval; Logistic regression results
No relationship was found (using the chi-square test) between the presence of rhizarthritis and improved quality of life or arm functionality by scores on the SF-36 (p>0.05), DASH (p=0.089), or HAQ (p=0.864).
There was also no relation between the presence of rhizarthritis and improved palmar grip strength (p=0.819), pulp to pulp pinch strength (p=0.222), or key (lateral) pinch strength (p=0.411) measured by dynamometry. Improvements in tripod pinch strength were more likely in patients with rhizarthritis than in patients without the disease (p=0.036).
Stratification according to the Eaton classification 16 showed no relationship between the degree of rhizarthritis and improvements in palmar grip strength (p=0.055), pulp to pulp pinch strength (p=0.470), key (lateral) pinch strength (p=0.815), or tripod pinch strength (p=0.463), measured by dynamometry.
DISCUSSION
Although this study is retrospective, it is part of a thematic project called PARQVE. 11 , 13 , 15 The main objective of this project was to offer multiple-modality treatment for patients with OA of the knee. Seven teams (orthopedic doctors, physiotherapists, a dietitian, physical educators, occupational therapists, social workers, and psychologists) joined forces to develop a two-day educational program explaining the disease and its treatment. Each team developed subprojects evaluating objective and subjective parameters within its area.
At inclusion, the prevalence of OA was similar to that described in the literature (23.7%), 1 , 8 , 12 but after one year prevalence of symptomatic OA of the hands was 47.4%, alerting us to the need to evaluate how effective the program was for OA of the hands.
Since at least one fourth of our patients obtained examinations outside of our institution, we were unable to recover the electronic file images from 49 of these patients, who were excluded. (Figure 1) Consequently, of the 146 patients with clinical and radiological assessments of the hands, 108 had rhizarthritis in at least one of their hands (74%). The prevalence of OA of the hand is known to be higher in women, and increases with age and obesity. 1 , 8 Our sample contains 76% obese women (obesity I, on average) with a mean age of 69 years, extending to 89. Of the 108 patients with rhizarthritis, 83 had bilateral involvement.
Intense physical activity, weight lifting, and frequent physical activity exceeding 180 minutes per week were factors that positively impacted the function of patients with knee OA, 13 , 14 but this was not the case with OA of the hand. One explanation could be that rhizarthritis exercises aim to relax the thenar region and strengthen the thumb extensor and abductor muscles to stabilize the trapeziometacarpal joint, while gym exercises develop palmar grip on equipment. 17
Black participants were 4.8 times more likely to improve their physical quality of life than white participants, and the presence of rhizarthritis did not affect improvement in the physical component of the SF-36. (Table 1) Time seemed to affect improvement in the mental component of the SF-36, but no variable influenced this improvement. (Table 2) We questioned the accuracy of the findings from the SF-36 because patients may have had difficulty understanding the questionnaire, considering that they had an average of 8 years of schooling. Similarly, none of the variables influenced improvement according to the DASH questionnaire. (Table 3) Women showed 79% less chance of improvement than men in the HAQ (p=0.037), and each decrease of 1% in body fat percentage increased the chance of improvement in the HAQ by 9.2% (p=0.038). (Table 4) We already knew that patients who lose weight improve their overall muscular strength (as assessed by the HAQ), 12 but even though few participants lost weight, this result was constant at each annual evaluation.
As expected, age and the presence of rhizarthritis influenced grip strength. 1 , 8 (Table 5). Patients with unilateral rhizarthritis are 5.3 times more likely to improve than patients without rhizarthritis, because these patients were expected to be worse and after treatment their grip may have improved. Here we should recall that all patients received diacerein for knee OA, and that patients who had hand symptoms were fitted for orthotics by the occupational therapists. Patients with unilateral rhizarthritis could (data not analyzed) have milder degrees of OA than patients with bilateral rhizarthritis. As expected, and like the functional results for the knees, age had a negative impact on grip strength, 14 , 15 probably because of sarcopenia. 8 Sex influenced pulp to pulp pinch strength, with females 2.95 times more likely to improve their pulp to pulp pinch strength than men (p=0.018). The simple explanation may be that they were more affected than men in this area and that treatment offered more significant improvement in women than in men. Tripod pinch strength improved more in patients with rhizarthritis than in patients without this disease. The degree of rhizarthritis did not influence strength improvement to the same extent as other joints with OA. 8 , 14 , 15
CONCLUSION
Patients with multiple arthritis and rhizarthritis improved their quality of life and grip strength through clinical treatment, an educational program, and fat loss.
Footnotes
Work conducted at the Osteometabolic Diseases Group, Instituto de Ortopedia e Traumatologia, Hospital das Clinicas HCFMUSP, Faculdade de Medicina, Universidade de São Paulo, São Paulo, SP, Brazil.
REFERENCES
- 1.Lawrence RC, Felson DT, Helmick CG, Arnold LM, Choi H, Deyo RA. Estimates of the prevalence of arthritis and other rheumatic conditions in the United States Part II. Arthritis Rheum. 2008;58(1):26–35. doi: 10.1002/art.23176. [DOI] [PMC free article] [PubMed] [Google Scholar]
- 2.Mathers C. World Health Organization . The Global Burden of Disease: 2004 Update. World Health Organization; 2008. [Google Scholar]
- 3.Arden N, Nevitt MC. Osteoarthritis epidemiology. Best Pract Res Clin Rheumatol. 2006;20(1):3–25. doi: 10.1016/j.berh.2005.09.007. [DOI] [PubMed] [Google Scholar]
- 4.Brandt KD, Radin EL, Dieppe PA, van de Putte L. Yet more evidence that osteoarthritis is not a cartilage disease. Ann Rheum Dis. 2006;65(10):1261–1264. doi: 10.1136/ard.2006.058347. [DOI] [PMC free article] [PubMed] [Google Scholar]
- 5.Brandt KD, Dieppe P, Radin EL. Etiopathogenesis of osteoarthritis. Rheum Dis Clin North Am. 2008;34(3):531–559. doi: 10.1016/j.rdc.2008.05.011. [DOI] [PubMed] [Google Scholar]
- 6.Lane NE, Brandt K, Hawker G, Peeva E, Schreyer E, Tsuji W. OARSI-FDA initiative defining the disease state of osteoarthritis. Osteoarthritis Cartilage. 2011;19(5):478–482. doi: 10.1016/j.joca.2010.09.013. [DOI] [PubMed] [Google Scholar]
- 7.Martel-Pelletier J, Boileau C, Pelletier J-P, Roughley PJ. Cartilage in normal and osteoarthritis conditions. Best Pract Res Clin Rheumatol. 2008;22(2):351–384. doi: 10.1016/j.berh.2008.02.001. [DOI] [PubMed] [Google Scholar]
- 8.Litwic A, Edwards MH, Dennison EM, Cooper C. Epidemiology and burden of osteoarthritis. Br Med Bull. 2013;105:185–199. doi: 10.1093/bmb/lds038. [DOI] [PMC free article] [PubMed] [Google Scholar]
- 9.Jamshidi AR. Clinical Hand Osteoarthritis in Tehran Prevalence, Signs, Symptoms, and Pattern - COPCORD Stage I, Iran Study. J Rheumatol. 2008;35(7):1467–1468. [PubMed] [Google Scholar]
- 10.Zeng QY, Chen R, Darmawan J, Xiao ZY, Chen SB, Wigley R. Rheumatic diseases in China. Arthritis Res Ther. 2008;10(1):R17–R17. doi: 10.1186/ar2368. [DOI] [PMC free article] [PubMed] [Google Scholar]
- 11.Rezende MU, Campos GC, Pailo AF, Frucchi R, Pasqualin T, Camargo OP. PARQVE - Project Arthritis Recovering Quality of Life by means of Education short-term outcome in a randomized clinical trial. J Arthritis. 2013;2:2–2. [Google Scholar]
- 12.Kuhn VC, Scarcella DS, Suzuki RM, Almeida LC, Brito NL, Rezende MU. Prevalence and incidence of hand osteoarthritis and upper limb complaints in patients with knee osteoarthritis Correlations among functionality grip strength, changes in body mass index and symptoms among patients in an educational osteoarthritis program. Open J Orthop. 2016;6:1–9. [Google Scholar]
- 13.Rezende MU, Hissadomi MI, Campos GC, Frucchi R, Pailo AF, Pasqualin T. One-year results of on educational program on osteoarthritis a prospective randomized controlled trial in Brazil. Geriatr Orthop Surg Rehabil. 2016;7(2):86–94. doi: 10.1177/2151458516645634. [DOI] [PMC free article] [PubMed] [Google Scholar]
- 14.Kirihara RA, Catelan FB, Farias FE, Silva CA, Cernigoy CH, Rezende MU. Intensidade, duração e tipo de atividade física para melhora da função na gonartrite. Acta Ortop Bras. 2017;25(1):25–29. doi: 10.1590/1413-785220172501166212. [DOI] [PMC free article] [PubMed] [Google Scholar]
- 15.Rezende MU, Frucchi R, Pailo AF, Campos GC, Pasqualin T, Hissadomi MI. PARQVE projeto artrose recuperando qualidade de vida pela educação: resultados em dois anos. Acta Ortop Bras. 2017;25(1):18–24. doi: 10.1590/1413-785220172501165604. [DOI] [PMC free article] [PubMed] [Google Scholar]
- 16.Eaton RG, Lane LB, Littler JW, Keyser JJ. Ligament reconstruction for the painful thumb carpometacarpal joint A long-term assessment. J Hand Surg Am. 1984;9:692–699. doi: 10.1016/s0363-5023(84)80015-5. [DOI] [PubMed] [Google Scholar]
- 17.Rezende MU, Pailo AF, Strutz CG, Cernigoy CHA, Silva CAC, Scarcella DS. Tratamento multiprofissional da artrose. Rio de Janeiro: Revinter; 2015. [Google Scholar]
- 18.Ciconelli RM, Ferraz MB, Santos W, Meinão I, Quaresma MR. Tradução para a língua portuguesa e validação do questionário genérico de ava- liação de qualidade de vida SF-36 (Brasil SF-36) Rev Bras Reumatol. 1999;39(3):143–150. [Google Scholar]
- 19.Orfale AG, Araújo PM, Ferraz MB, Natour J. Translation into Brazilian Portuguese, cultural adaptation and evaluation of the reliability of the Disabilities of the Arm, Shoulder and Hand Questionnaire. Braz J Med Biol Res. 2005;38(2):293–302. doi: 10.1590/s0100-879x2005000200018. [DOI] [PubMed] [Google Scholar]
- 20.Hudak PL, Amadio PC, Bombardier C. Development of an upper extremity outcome measure the DASH (disabilities of the arm, shoulder and hand) [corrected]. The Upper Extremity Collaborative Group (UECG) Am J Ind Med. 1996;29(6):602–608. doi: 10.1002/(SICI)1097-0274(199606)29:6<602::AID-AJIM4>3.0.CO;2-L. [DOI] [PubMed] [Google Scholar]