

Abstract
Goal
Develop and test an MRI-compatible hydrodynamic simulator of cerebrospinal fluid (CSF) motion in the cervical spinal subarachnoid space. Four anatomically realistic subject-specific models were created based on a 22-year-old healthy volunteer and a five-year-old patient diagnosed with Chiari I malformation.
Methods
The in vitro models were based on manual segmentation of high-resolution T2-weighted MRI of the cervical spine. Anatomically realistic dorsal and ventral spinal cord nerve rootlets (NR) were added. Models were 3D-printed by stereolithography with 50 μm layer thickness. A computer controlled pump system was used to replicate the shape of the subject specific in vivo CSF flow measured by phase-contrast MRI. Each model was then scanned by T2-weighted and four-dimensional phase contrast MRI (4D flow).
Results
Cross-sectional area, wetted perimeter and hydraulic diameter were quantified for each model. The oscillatory CSF velocity field (flow jets near NR, velocity profile shape and magnitude) had similar characteristics to previously reported studies in the literature measured by in vivo MRI.
Conclusion
This study describes the first MRI-compatible hydrodynamic simulator of CSF motion in the cervical spine with anatomically realistic NR. NR were found to impact CSF velocity profiles to a great degree.
Significance
CSF hydrodynamics are thought to be altered in craniospinal disorders such as Chiari I malformation. MRI scanning techniques and protocols can be used to quantify CSF flow alterations in disease states. The provided in vitro models can be used to test the reliability of these protocols across MRI scanner manufacturers and machines.
Index Terms: Cerebrospinal fluid, Spinal subarachnoid space, in vitro model, MRI, 4D Flow, spinal cord, 3D-printing, Chiari malformation
I. Introduction
Cerebrospinal fluid (CSF) dynamics are considered an important factor to help understand the pathophysiology of craniospinal disorders such as Chiari I malformation (CMI), hydrocephalus and intracranial hypertension [1, 2]. However, at present, assessment of CSF dynamics is not a standard clinical practice and optimization of MR protocols for CSF dynamics measurement is lacking. This has made it difficult to understand and identify the key alterations to CSF dynamics that take place in disease states. For example, it remains unclear if CSF flow velocities are high or low in CMI patients in comparison to healthy subjects [3–5] and if CSF flow improvement is an indicator of surgical success [6]. In addition, several numerical modeling studies have suggested a possible important role of relatively small anatomical structures such as spinal cord nerve rootlets on CSF dynamics and intrathecal solute transport [7–13]. MRI techniques, such as 4D Flow, may provide detailed spatial information on the CSF flow field that could lead to definitive biomarkers for disease states. An MR compatible in vitro experimental platform would be useful to simulate different flow conditions that are representative of normal and disease states and to assess the reliability of flow-sensitive MR protocols in the measurement of CSF dynamics, across multiple MRI machines and manufacturers. In vitro models have previously played an important role to help establish MR protocols for clinical cardiovascular blood flow analysis [14–16].
In vitro models have several desirable characteristics and advantages that make them well suited for characterization of MR measurement reliability. Well-defined subject specific geometries of the spinal subarachnoid space (SSS) can be constructed with a high level of detail using state of the art 3D printing techniques. When connected to computer controlled flow systems, in vitro models can be used to mimic subject-specific CSF flow waveforms and provide a consistent velocity field within the model. In vivo experiments are often expensive and difficult to replicate for consistency studies as in vivo CSF dynamics are impacted by physiological factors such as partial pressure levels of oxygen and carbon dioxide within the blood [17], valsalva maneuvers such as coughing [18] and respiration [19, 20]. In vitro models can also enable measurements that are otherwise difficult to make in vivo. For example, pressure measurements can be made easily by inserting catheters into the in vitro model [21, 22]. Also, bench-top experiments using in vitro models can utilize techniques such as laser Doppler anemometry, particle image velocimetry and laser vibrometry to quantify the flow field in greater spatial and temporal detail than MR-based techniques.
A number of previous researchers have constructed in vitro models of CSF dynamics. One of the first in vitro models of the CSF space was built by Williams [23] to demonstrate the mechanism of filling in syringomyelia. Since then, several others have built in vitro models of varying levels of anatomical complexity to help understand craniospinal and arterial flow disorders and for validating various imaging techniques [24–26]. An in vitro model built by Bouzerar et al. [27] consisted of a rigid cranial compartment and a compliant spinal compartment to look at blood-CSF interaction. Bottan et al. [28] used in vivo MR measurements to create a CSF model focused on the ventricles of the brain that included mechanical properties and compliance based on published data. Martin et al. [29] used in vivo MR data to create an in vitro compliant model of the spinal canal to study the impact of spinal stenosis on CSF dynamics in syringomyelia. Another in vitro study by Martin et al. examined the effect of coughing [22] and normal cardiac-related CSF oscillations [21] on the SSS pressure environment.
Although some of these studies have helped improve the understanding of CSF dynamics, these models lacked anatomically realistic geometry and/or were not MRI compatible. The aim of the present study was to a) design and construct MR-compatible and anatomically detailed in vitro models capable of simulating a variety of CSF flow conditions within the cervical SSS and b) use MR imaging to characterize the CSF flow and geometry within the models and compare the CSF dynamics to in vivo measurements in the literature.
II. Methods
In order to simulate a variety of CSF flow conditions, four in vitro models of the SSS geometry were constructed based on a: 1) healthy volunteer (HV), 2) healthy volunteer with nerve rootlets (HV-NR), 3) CMI patient (CM), 4) CMI patient with nerve rootlets (CM-NR).
A. In Vivo MR Imaging
The in vitro model spinal cord and dura matter geometries were designed based on anatomic MR images obtained from a 22-year-old/male healthy volunteer (HV) and a 5-year-old/male CMI patient with 6.8 mm cerebellar tonsillar herniation inferior to the foramen magnum. The healthy volunteer and CMI patient were scanned as part of a previously published work by Yiallourou et al. [30] (‘Healthy Volunteer b’ and ‘CM 4’). In brief, to define the in vivo CSF space geometry, a high-resolution T2-weighted 3D, turbo spin-echo sequence (VISTA) was collected with an isotropic spatial resolution of 0.8 mm [1]. Scan coverage extended from the craniovertebral junction to ~5 cm below the C7 vertebrae.
B. In Vivo Segmentation and Smoothing
A three dimensional geometry of the dura mater and the spinal cord for the healthy volunteer and CMI patient was manually segmented using ITKSnap (version 2.2.0, University of Pennsylvania, Philadelphia, PA) [31]. These geometries were exported from ITK-snap as an STL file and then smoothed using the Laplacian surface preserving algorithm in Meshlab (version 1.3.0, Rome, Italy). Pixelation artifacts and holes were corrected as described in Yiallourou et al. [32]. A repeatability study was previously conducted to assess the operator impact on the resulting geometry using the above methodology and found that hydraulic diameter and wetted perimeter varied by 11% and 13%, respectively among four trained operators [30].
C. Addition of Idealized Spinal Cord Nerve Rootlets
Although the spinal cord and dura mater were visible in the MR images, smaller anatomical structures such as the denticulate ligaments, blood vessels, and nerve rootlets (NR) were not. Thus, idealized dorsal and ventral spinal cord NR were manually added to the geometries above using Autodesk Maya (version 2012, Autodesk Inc., California, San Rafael, CA) [33] based on anatomical measurements from cadaveric studies [34–36] (Figure 1). To allow consistent 3D printing, the NR in Pahlavian et al. were modified to have a minimum thickness of 1 mm. Cadaveric measurements in the literature indicate that NR diameters range from ~0.5 to 1.0 mm in the cervical spine [37]. Anatomical structures below this size, such as the denticulate ligaments, dorsal septum and dorsolateral septa [38], were excluded from the final geometry.
Figure 1.

3D visualization of our model with spinal cord nerve rootlets within the dorsal spinal subarachnoid space.
D. Flow Extension and 3D Printing Adaptation
An overall model geometry with flow extensions and 3D printing adaptations is shown in Figure 2. To account for entrance length effects, 15 mm flow extensions were added to both ends of each model. A 6 mm hollow extension and hole (6.25 mm diameter and 15mm length) were also included on both ends for flow connection. Several step cuts were added to reduce 3D printing material cost (See Figure 2 top, 10 mm wide, 5 mm tall cuts).
Figure 2.

(Top) Overview of dimensions for the HV model with NR included. (Bottom) 3D Printed Model (HV-NR)
E. Material and 3D Printer Specs
The flow models were 3D printed on a VIPER si2 Stereolithography system (3D Systems Corporation, SC, USA) with a layer thickness of 50 μm and 0.25 mm minimum feature size. The material selected for the model printing was WaterShed XC 11122, which is optically clear (refraction index = 1.514). The total cost for 3D printing of the CM-NR and CM in vitro models was $1100 each with a build dimension of 182 x 49 x 86 mm and material volumes of 538.5 cm3 and 537.5 cm3, respectively. The HV-NR and HV models cost $1300 each with build dimensions of 255 x 45 x 70 mm and material volumes of 638.8 cm3 and 637 cm3, respectively. The inlet flow extension was 3D printed separately and added to each model by drilling and tapping holes in the flow model body (Figure 2). A rubber gasket was fabricated to seal the extension/model interface. Nylon screws were used to secure the flow extension in place. National pipe thread (NPT) taps were also added to the flow inlet and outlet to allow for a ½” NPT pipe connection (Watts Water Technologies Part No. PL-3036 Quick Connect Adapter). A clear acrylic outlet pipe, with a vertical column of water, was added to each model (0.5 and 0.375 inch outer and inner diameter, respectively with a water height of ~ 15 cm).
F. Pulsatile CSF Flow Pump
The approach was to construct a CSF flow pump that could mimic a variety of pulsatile CSF flow waveforms measured in the literature. A custom designed computer controlled CSF flow pump (Figure 3) was constructed with a linear tubular motor for controlling the position of a precision glass syringe that delivered CSF flow to the models [22]. Rigid plastic tubing (0.375 and 0.250 inch outer and inner diameter respectively, 7.6 m long, Watts Water Technologies Part No. HSPGE25) was used to deliver the CSF flow to the models during the MR experiments. Similar to our previous studies, water was used to represent CSF and was degassed before conducting experiments. Tubing was needed as the pump could not be placed directly in the MRI scanning room due to magnetic components. For the HV and HV-NR model experiments, a similar CSF waveform as that measured by Yiallourou et al. [32] was used. Pump motion was tracked using a quadrature encoder. A custom Matlab (version R2014a, Mathworks Corp, Natick, MA) code was written to post-process the recorded pump quadrature signal and calculate the flow rate waveform at the pump outlet. Flow waveform shape and amplitude was adjustable via a Matlab interface. Experiments were conducted to characterize the pump position reliability. The pump was equipped with a linear encoder (RG24 Digital Read Model #RGH24X30A00A, Renishaw, Hoffman Estates, IL) to track real-time position of the syringe with 1 μm resolution. Syringe position was used in combination with precision-bore 3 mL syringe (model 5340, Popper and Sons, New Hyde Park, NY) inner diameter to obtain unsteady flow waveforms [39].
Figure 3.

Schematic for the construction and MR testing of the subject specific in vitro models.
G. In Vitro MR Imaging
An MRI protocol was implemented to characterize the CSF flow and geometry within each in vitro model. For the MRI experiments, we used a subject-specific CSF flow waveform that was scaled to be ~2.5X larger in amplitude than reported in vivo. This waveform was used to produce peak CSF velocities that were in the range of those reported in CMI patients thereby resulting in a similar signal-to-noise in the MRI flow measurements. 4D phase contrast MRI scans (4D Flow) were obtained with imaging parameters similar to Bunck et al. [40]. In brief, images were collected in the sagittal orientation on a 3T Philips Achieva scanner (Philips Healthcare, Best, Netherlands) with 3D velocity encoding (VENC = 15 cm/s), prospective gating, 16 phases per cardiac cycle with 30 ms time-steps, TR=6.6 ms, TE=4.5 ms, Flip Angle=15°, x*y*z resolution=1*1*8 mm and slice thickness=8 mm. The total 4D Flow imaging time was approximately 15 minutes per model. In addition, a high-resolution T2-weighted MRI was collected with full geometry coverage. The T2-weighted sequence used TR=2000 ms, TE=120 ms, Flip Angle=90°, isotropic resolution= 0.8 mm. Saline bags were placed near the flow models to aid in eddy current correction (see below).
H. Geometry analysis
Analysis was performed to compare the T2-weighted MRI-based segmentation (in vitro segmentation) with the STL file used to create the in vitro model (STL). Ideally, the in vitro segmentation and STL geometries would be identical. In vitro segmentations were completed using methods identical to that used for the in vivo MR data (Section B). Geometries were compared in terms of the axial distribution of wetted perimeter, P, cross-sectional area, A, and hydraulic diameter, , measured at 1 mm intervals along each model. Values of A and P were determined for axial slices oriented parallel to the model inlet face. A qualitative comparison was made between the in vitro segmentation and STL by visualization of the spinal cord and dura at ten representative axial slices for each model with 2 cm spacing (Figure 5).
Figure 5.

a) 3D representation of HV-NR in vitro model; b) Visualization of ten axial locations where CSF flow was analyzed; T2-weighted MRI overlaid with the STL (red) and in vitro segmentation (green); c) Thru-plane velocity contours at peak systole.
I. MRI post-processing for Velocity and Flow
4D Flow post-processing was completed using GTFlow software (version 2.2.4, Gyrotools Inc, Switzerland) [32]. An anatomy filter was applied to the 3D flow field to isolate the 3D printed polymer material from the fluid. Correction for eddy current induced phase offsets was applied within GTFlow software, using a linear interpolation based on the static saline bags. Anti-aliasing correction was manually performed if necessary. Three-directional velocity information at the ten axial slices was then exported from GTFlow and analyzed in MATLAB using a custom code. The following flow-based parameters were quantified: a) thru-plane peak systolic velocity contours, b) peak CSF velocity at peak systolic and diastolic flow, and c) unsteady CSF flow computed from the axial 4D flow images.
J. Reynolds, Womersley number calculation
The axial distribution of Reynolds number, Re, based on peak flow within a tube, was computed for the STL and in vitro segmentations with and without NR. Reynolds number was defined as Re = ρV̄Dh/μ, where ρ is the density of water at room temperature (20°C), V̄ is the mean thru-plane CSF velocity at the axial cross-section at peak systole, μ is the dynamic viscosity of water (0.001 Pa-s) and Dh is the hydraulic diameter. V̄ was determined with the peak CSF flow, Q̄peak estimated based on the average CSF flow waveform obtained by 4D Flow at all ten axial locations. Reynolds number was then computed at 1 mm intervals along the model. Womersley number was calculated as , where ω is the angular frequency of the pulsatile flow.
III. Results
Four in vitro geometries were constructed and tested by MRI. Due to space limitation, detailed results are provided herein for the HV-NR model only. To demonstrate the impact of spinal cord NR, geometry measurements of the HV model are also included alongside those of the HV-NR model.
A. Geometry
Inclusion of NR had a relatively small impact on the axial distribution of A compared to Dh, Pw, Re and α (Figure 4). Geometric parameter agreement was better between the HV (STL) and HV (in vitro segmentation) compared to the HV-NR (STL) and HV-NR (in vitro segmentation). Total segmented CSF volume from 0 to 18.1 cm was 33.9, 35.9, 38.9, and 40.1 ml for the HV-NR (STL), HV (STL), HV-NR (in vitro segmentation), HV (in vitro segmentation) model.
Figure 4.

Axial distribution of cross-sectional area, wetted perimeter, hydraulic radius, Reynold’s number (Re) and Womersley number (α) for the HV-NR and HV geometries obtained based on the STL file and in vitro segmentation. Note: Reynold’s number is at the highest range of values expected in vivo as the CSF flow waveform used for this study was ~2.5X larger than that typically observed in vivo.
Figure 5a shows a 3D representation of the HV-NR model with depiction of the cerebellar tonsil location, spinal cord and eight pairs of dorsal and ventral spinal cord NR. The dotted lines indicate the ten representative axial locations along the HV-NR model for qualitative comparison of geometry and velocity contours. Figure 5b shows the high resolution T2-weighted MRI scan overlaid with the HV-NR (STL) and HV-NR (in vitro segmentation).
B. Velocity and Flow Measurements using 4D Flow
Figure 5c shows the thru-plane velocity contours at the ten axial slices along HV-NR, measured at peak systole. Figure 6 shows a comparison of peak systolic and diastolic CSF velocities at the ten axial locations. Peak systolic CSF velocities were found to range from 6.2 cm/s at the level of foramen magnum, to 16.8 cm/s near the C4 vertebrae location.
Figure 6.
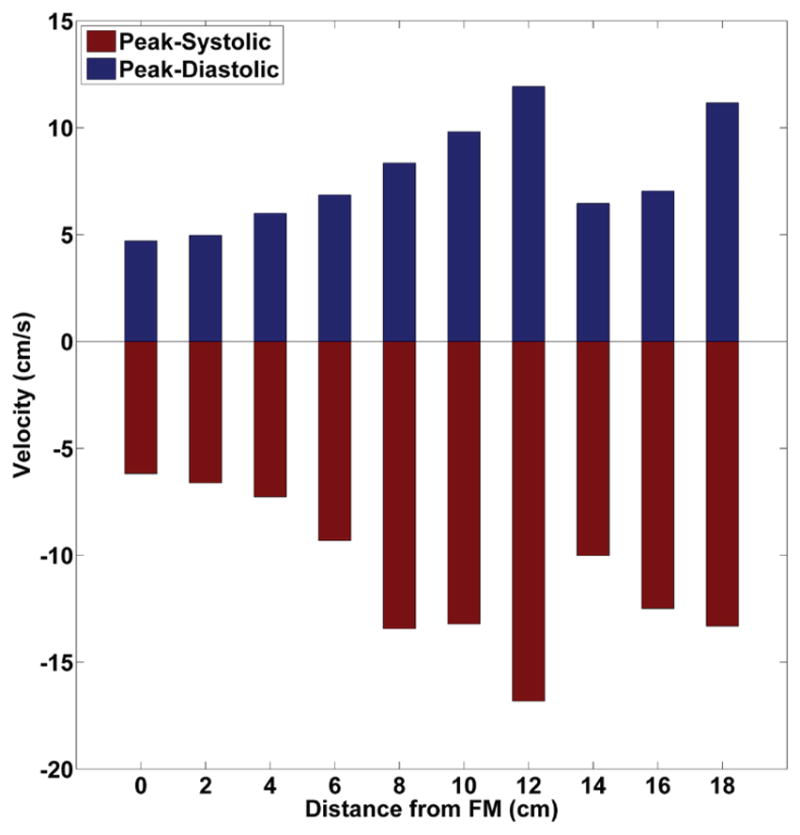
Peak Systolic and diastolic velocities at the ten axial locations along the HV-NR in vitro model (negative values are toward feet).
CSF flow waveforms at the ten axial slices had a mean amplitude of 19.6 ± 1.5 ml/s (mean ± standard deviation, Figure 7). Mean CSF flow rate measured at peak systole was 12 ± 1.25 ml/s. These flow waveforms were compared to the waveform measured at the computer-controlled pump.
Figure 7.
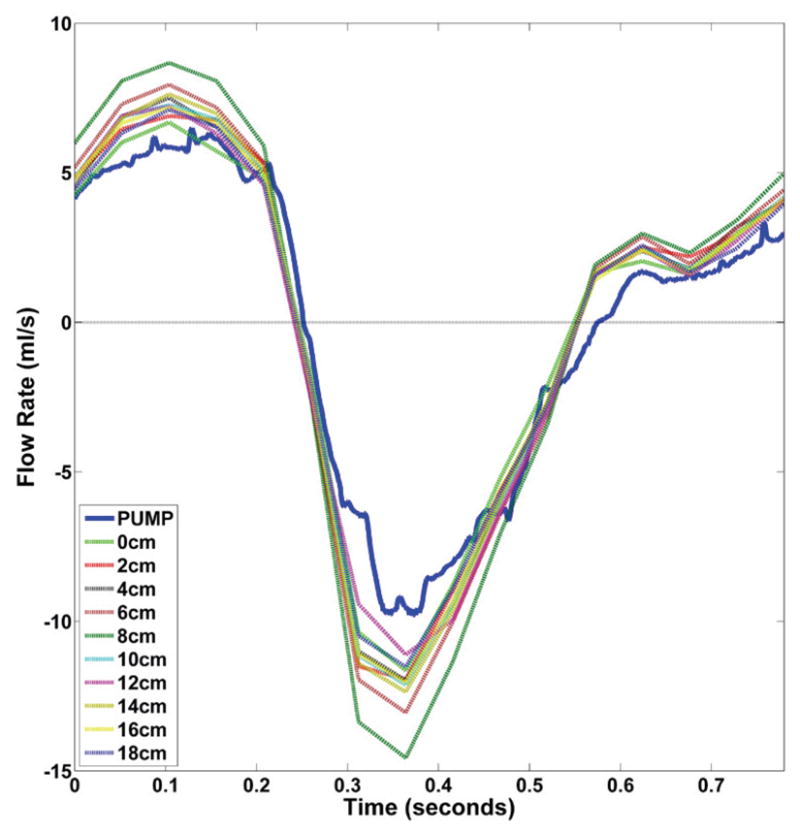
Axial distribution of CSF flow rate waveforms measured by 4D Flow for the HV-NR and comparison to the pump waveform (blue). Note: this waveform is ~2.5X larger than typically observed in vivo.
To demonstrate the impact of spinal cord NR on velocity distributions, thru-plane CSF velocity contours at identical axial locations on the HV-NR (left) and HV in vitro models at peak systolic flow, using identical input flow waveforms were compared in Figure 8.
Figure 8.
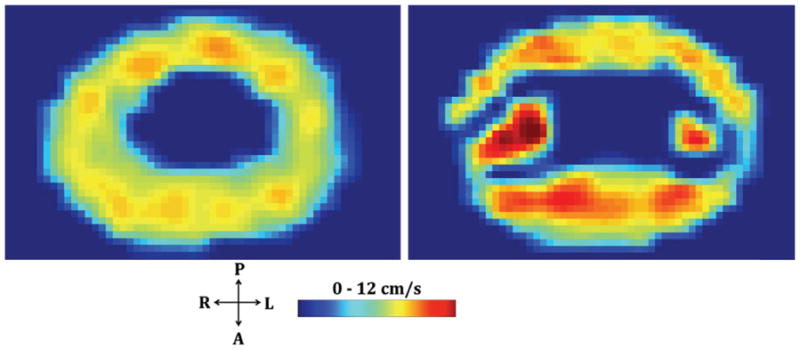
Peak systolic thru-plane velocity contours at identical axial locations along the HV-NR (right) and HV (left) in vitro models. Spinal cord NR can be seen to impact the CSF velocity distribution including the formation of lateral CSF flow jets between the dorsal and ventral NR
C. Flow Pump Reliability and Operation
Encoder signal measurements revealed that maximum position error was less than 50 μm. Flow waveforms were found to be highly repeatable with less than 2% variability measured in the flow amplitude at the syringe, with all of the plastic tubing connected. The experimental setup allowed pump positioning outside of the scanner room and delivery of the CSF pulsation to the system via a waveguide tube. The model set-up was designed to allow transport by air within standard airline baggage size.
IV. Discussion
This study details the design, construction and MRI testing of subject specific 3D-printed in vitro models of CSF flow in the cervical spine. The four flow models had CSF dynamics that were similar to previously published in vivo studies [[41]] in terms of presence of flow jets near NR, shape of velocity profiles and velocity magnitudes.
Spinal cord NR impact CSF velocity distribution
The presence of spinal cord NR led to slight anterior dominance of flow and formation of CSF flow jets at their location, which would otherwise be devoid of these features as can be seen in Figure 8. These relatively fine structures impact CSF hydrodynamics in the SSS to a great degree and are likely to be a necessary geometric feature to include in both in vitro experiments and computational fluid dynamics (CFD) simulations.
Presence of spinal cord NR alters SSS geometry and decreases Reynold’s number
Segmentation of T2-weighted MR images revealed that it was not possible to accurately detect the spinal cord NR (Figure 4 and 5). These small structures were comparable to the MR image acquisition resolution (0.8 mm isotropic) and therefore difficult to differentiate. The presence of NR had a relatively small impact on the SSS cross-sectional area (19%) but a large impact on the wetted perimeter (60%), and hydraulic diameter (49%). Reynold’s number, being inversely proportional to the wetted perimeter, decreased by 37% on average at NR locations (Figure 4) and remained in the laminar regime throughout the cycle (<800). It has been shown by Pahlavian et al. [33], Sweetman et al. [42], and Stockman et al. [43] that NR increase CSF mixing within the spine, which is not expected for a decrease in Reynolds number. Thus, Reynolds number interpretation in the SSS should be taken with caution since wetted perimeter changes with NR can artificially reduce Reynolds number when based on a hydraulic diameter. As described in the methods, the CSF flow waveform magnitude in our study (Figure 7) was ~2.5X larger than typically observed in vivo in healthy subjects. All Reynold’s number results in this study should be interpreted as a maximum range of what is possible to occur in vivo.
Overestimation of SSS cross-sectional areas based on T2-weighted MRI
The in vitro segmentation areas were found to be larger than the STL file used to create the model (Figure 4). The original STL file was based on in vivo data and thus any differences in the in vitro segmentation can be viewed also as differences from the in vivo-derived geometry. In specific, the in vitro segmentation dura mater was consistently larger whereas the spinal cord and NR were consistently smaller compared to the STL file. The cumulative effect of these alterations was that the MR-derived areas were larger than the STL file. The stereolithography technique that was used to construct these models are not prone to printing errors that would alter the geometry and have been found to have high degrees of accuracy in the reproduction of anatomical geometries [44, 45]. The difference in spinal NR areas may be attributed to limitations in the MR resolution. However, the same could not be said for the dura mater and spinal cord surface location. We hypothesize that the contrast-based image post-processing method used for image segmentation, partial volume effects and/or the T2-weighted MR sequence used to obtain the geometry systemically enlarged the SSS areas along the spine. It should also be noted that the segmentations were performed manually and therefore introduced operator error. Automated segmentation techniques may reduce segmentation error and allow improved interpretation of our geometry results [46].
Implication of an enlarged CSF space
Our finding that the CSF space is enlarged by the MR-image acquisition and subsequent post-processing methodology is important because a number of studies in the literature have found that CSF velocity predictions using simulations of the spine are lower than those measured by PCMRI and 4D Flow [32, 47]. Our findings support that the lower CSF velocities in CFD results may be, at least partially, attributed to a systematic error in SSS geometry detection and/or re-construction. It should be noted that in another study [30], we found that the segmentation of the CSF space was highly consistent among trained operators. Thus, while the method applied to segment the SSS was consistent, it may provide consistently incorrect results. Further study should be focused on improving the MR imaging and reconstruction methods used for CFD and in vitro models.
Similarity of CSF velocities to in vivo
The purpose of the in vitro model was to provide a platform to measure a range of velocities using different techniques. Previous studies [1, 32, 40] that used PCMRI have reported peak systolic CSF velocities that range from 1.5 cm/s in healthy controls to over 20 cm/s found in CMI patients. The CSF flow waveform produced by the computer controlled pump in the present study (Figure 7) resulted in peak systolic CSF velocities that were between 6 and 15 cm/s which is greater than healthy volunteers but comparable to CMI patients in previous studies [32, 40]. It should also be noted that our model mimicked cardiac related CSF flow waveform shape, but it was of a larger magnitude than that typically observed in healthy subjects. Recent studies have shown that, in addition to the cardiac related CSF flow movement, there is also a significant effect of respiration on CSF flow dynamics [48–50].
Visual inspection of velocity profiles at peak systole in the HV-NR model revealed inhomogeneous CSF flow with a small degree of anterior flow dominance. Albeit, the in vivo studies reported a greater degree of anterior flow dominance [3, 4] compared to the present study. Similar to in vivo and CFD studies, lateral CSF flow jets were observed between dorsal and ventral NR (Figure 5c). The presence of NR was also found to diminish CSF velocities in their proximity.
CSF flow waveform consistency
CSF flow waveforms were expected to be consistent throughout the length of each model due to model rigidity. However, quantifiable differences were observed in the axial distribution of CSF flow waveforms (Figure 7). During peak systole and diastole, flow rates had an overall standard deviation of 8%. This variability can be attributed to sources of error impacting the 4D Flow measurement technique. Studies employing 4D Flow to make measurements in vivo should expect a similar or larger magnitude of inaccuracy while computing CSF flows or stroke volumes. Studies have previously reported high degree of variability in CSF stroke volumes and flow waveforms measured from in vivo phase contrast MRI [32, 51].
V. Limitations
Due to limitations in the printer capabilities, the in vitro model was made completely rigid unlike the compliant nature of the SSS. A recent study by Pahlavian et al.[52] showed that the motion of the cerebellar tonsils and spinal cord during the cardiac cycle can impact CSF dynamics within the SSS. The rigid nature of the in vitro model disregards any effect of these tissue motions that may be an important factor in CMI. The dorsal and ventral NR were modified in accordance with minimum feature size of the 3D printing technique. This restriction also required leaving out several smaller anatomical structures like arachnoid trabeculae, dorsal septum and dorsolateral septa.
On average, the 4D Flow measured flows were found to be 20% greater in amplitude than that measured at the pump. This increase in amplitude may be due to compliance in the tubing that connects the pump and the in vitro models or 4D Flow inaccuracy. The actual flow waveform at the location of the phantom is likely different than the commanded waveform at the pump. However, tubing was necessary as the pump had magnetic components and could not be placed in the MRI scanner room. Particle image velocimetry (PIV) or laser Doppler anemometry (LDA) could be used to establish a “gold standard” in vitro flow waveform. However, these measurement techniques require an optically clear model. Unfortunately, the SLA printing material required to print the subject specific anatomical features was not optically clear. Future studies may address this aspect by construction of an idealized and optically clear model.
VI. Conclusion
An MRI-compatible hydrodynamic simulator of CSF motion within the human cervical spine was constructed and tested. Multiple models were created with varying levels of anatomical complexity and representing both healthy and diseased (CMI) CSF flow dynamics. MRI testing and analysis of flow and geometry indicated that the models had similar CSF hydrodynamic characteristics to in vivo. NR were found to have an impact on the CSF flow field. These models can be used to help assess MRI measurement reliability, CSF dynamics in healthy and disease states, and intrathecal solute transport.
Supplementary Material
Acknowledgments
This project is funded by a grant from the American Syringomyelia and Chiari Alliance Project, Chiari and Syringomyelia Patient Education Foundation, the Swiss National Science Foundation, International Co-operation Short Visit Award (Grant No. IZK0Z2_152766), The University of Idaho Vandal Ideas Project and the National Institute of General Medical Sciences of the National Institutes of Health grants: 5U54GM104944 and P20GM103408 and National Institute of Mental Health grant: 1R44MH112210-01A1.
Footnotes
STL files for the four in vitro models as well as an excel file with the values reporting variation of the different geometric parameters are available for download and may be used under the Attribution-ShareAlike 4.0 International Creative Commons License (CC BY-SA 4.0). Also included is a video showing CSF velocity contours at various axial slices along the HV-NR in vitro model, measured over the cardiac cycle.
Contributor Information
Suraj Thyagaraj, University of Akron, OH, USA.
Soroush H. Pahlavian, University of Akron, OH, USA
Lucas R. Sass, Department of Biological Engineering at the University of Idaho, Moscow, ID, USA
Francis Loth, University of Akron, OH, USA.
Morteza Vatani, University of Akron, OH, USA.
Jae-Won Choi, University of Akron, OH, USA.
R. Shane Tubbs, Seattle Science Foundation, Seattle, WA, USA.
Daniel Giese, University Hospital, Cologne, Germany.
Jan-Robert Kroger, University Hospital, Cologne, Germany.
Alexander C. Bunck, University Hospital, Cologne, Germany
Bryn A. Martin, Department of Biological Engineering at the University of Idaho, Moscow, ID, USA.
VIII. References
- 1.Bunck AC, Kroger JR, Juttner A, et al. Magnetic resonance 4D flow characteristics of cerebrospinal fluid at the craniocervical junction and the cervical spinal canal. Eur Radiol. 2011 Aug;21(8):1788–96. doi: 10.1007/s00330-011-2105-7. [DOI] [PubMed] [Google Scholar]
- 2.Shaffer N, Martin B, Loth F. Cerebrospinal fluid hydrodynamics in type I Chiari malformation. Neurol Res. 2011 Apr;33(3):247–60. doi: 10.1179/016164111X12962202723805. [DOI] [PubMed] [Google Scholar]
- 3.Haughton VM, Korosec FR, Medow JE, et al. Peak systolic and diastolic CSF velocity in the foramen magnum in adult patients with Chiari I malformations and in normal control participants. American Journal of Neuroradiology. 2003 Feb;24(2):169–176. [PMC free article] [PubMed] [Google Scholar]
- 4.Quigley MF, Iskandar B, Quigley ME, et al. Cerebrospinal fluid flow in foramen magnum: temporal and spatial patterns at MR imaging in volunteers and in patients with Chiari I malformation. Radiology. 2004 Jul;232(1):229–36. doi: 10.1148/radiol.2321030666. [DOI] [PubMed] [Google Scholar]
- 5.Sakas DE, Korfias SI, Wayte SC, et al. Chiari malformation: CSF flow dynamics in the craniocervical junction and syrinx. Acta Neurochir (Wien) 2005 Dec;147(12):1223–33. doi: 10.1007/s00701-005-0645-9. [DOI] [PubMed] [Google Scholar]
- 6.McGirt MJ, Atiba A, Attenello FJ, et al. Correlation of hindbrain CSF flow and outcome after surgical decompression for Chiari I malformation. Childs Nerv Syst. 2008 Jul;24(7):833–40. doi: 10.1007/s00381-007-0569-1. [DOI] [PubMed] [Google Scholar]
- 7.Heidari Pahlavian S, Bunck AC, Thyagaraj S, et al. Accuracy of 4D Flow Measurement of Cerebrospinal Fluid Dynamics in the Cervical Spine: An In Vitro Verification Against Numerical Simulation. Ann Biomed Eng. 2016 Nov;44(11):3202–3214. doi: 10.1007/s10439-016-1602-x. [DOI] [PMC free article] [PubMed] [Google Scholar]
- 8.Heidari Pahlavian S, Bunck AC, Loth F, et al. Characterization of the discrepancies between four-dimensional phase-contrast magnetic resonance imaging and in-silico simulations of cerebrospinal fluid dynamics. J Biomech Eng. 2015 May;137(5):051002. doi: 10.1115/1.4029699. [DOI] [PMC free article] [PubMed] [Google Scholar]
- 9.Heidari Pahlavian S, Yiallourou T, Tubbs RS, et al. The impact of spinal cord nerve roots and denticulate ligaments on cerebrospinal fluid dynamics in the cervical spine. PLoS One. 2014;9(4):e91888. doi: 10.1371/journal.pone.0091888. [DOI] [PMC free article] [PubMed] [Google Scholar]
- 10.Stockman HW. Effect of anatomical fine structure on the flow of cerebrospinal fluid in the spinal subarachnoid space. J Biomech Eng. 2006 Feb;128(1):106–14. doi: 10.1115/1.2132372. [DOI] [PubMed] [Google Scholar]
- 11.Jain K, Ringstad G, Eide PK, et al. Direct numerical simulation of transitional hydrodynamics of the cerebrospinal fluid in Chiari I malformation: The role of cranio-vertebral junction. Int J Numer Method Biomed Eng. 2016 Nov 10;e2853:1–15. doi: 10.1002/cnm.2853. [DOI] [PubMed] [Google Scholar]
- 12.Haga PT, Pizzichelli G, Mortensen M, et al. A numerical investigation of intrathecal isobaric drug dispersion within the cervical subarachnoid space. PLoS One. 2017;12(3):e0173680. doi: 10.1371/journal.pone.0173680. [DOI] [PMC free article] [PubMed] [Google Scholar]
- 13.Tangen KM, Hsu Y, Zhu DC, et al. CNS wide simulation of flow resistance and drug transport due to spinal microanatomy. J Biomech. 2015 Jul 16;48(10):2144–54. doi: 10.1016/j.jbiomech.2015.02.018. [DOI] [PubMed] [Google Scholar]
- 14.Barker AJ, Markl M, Burk J, et al. Bicuspid Aortic Valve Is Associated With Altered Wall Shear Stress in the Ascending Aorta. Circulation-Cardiovascular Imaging. 2012 Jul;5(4):457–466. doi: 10.1161/CIRCIMAGING.112.973370. [DOI] [PubMed] [Google Scholar]
- 15.Firmin DN, Gatehouse PD, Konrad JP, et al. Rapid 7-Dimensional Imaging of Pulsatile Flow. Computers in Cardiology 1993, Proceedings. 1993:353–356. [Google Scholar]
- 16.Geiger J, Markl M, Jung B, et al. 4D-MR flow analysis in patients after repair for tetralogy of Fallot. Eur Radiol. 2011 Aug;21(8):1651–1657. doi: 10.1007/s00330-011-2108-4. [DOI] [PubMed] [Google Scholar]
- 17.Yiallourou T, Schmid Daners M, Kurtcuoglu V, et al. Continuous positive airway pressure alters cranial blood flow and cerebrospinal fluid dynamics at the craniovertebral junction. Interdisciplinary Neurosurgery: Advanced Techniques and Case Management. 2015;2:152–159. [Google Scholar]
- 18.Bhadelia RA, Madan N, Zhao Y, et al. Physiology-based MR imaging assessment of CSF flow at the foramen magnum with a valsalva maneuver. AJNR Am J Neuroradiol. 2013 Sep;34(9):1857–62. doi: 10.3174/ajnr.A3509. [DOI] [PMC free article] [PubMed] [Google Scholar]
- 19.Chen L, Beckett A, Verma A, et al. Dynamics of respiratory and cardiac CSF motion revealed with real-time simultaneous multi-slice EPI velocity phase contrast imaging. NeuroImage. 2015;122:281–287. doi: 10.1016/j.neuroimage.2015.07.073. [DOI] [PMC free article] [PubMed] [Google Scholar]
- 20.Dreha-Kulaczewski S, Joseph AA, Merboldt KD, et al. Inspiration is the major regulator of human CSF flow. The Journal of Neuroscience. 2015;35(6):2485–2491. doi: 10.1523/JNEUROSCI.3246-14.2015. [DOI] [PMC free article] [PubMed] [Google Scholar]
- 21.Martin BA, Labuda R, Royston TJ, et al. Pathological Biomechanics of Cerebrospinal Fluid Pressure in Syringomyelia: Fluid Structure Interaction of an in Vitro Coaxial Elastic Tube System. Proceedings of the Asme Summer Bioengineering Conference - 2009, Pt a and B. 2009:941–942. [Google Scholar]
- 22.Martin BA, Loth F. The Influence of Coughing on Cerebrospinal Fluid Pressure in an in Vitro Syringomyelia Model with Spinal Canal Stenosis. Proceedings of the Asme Summer Bioengineering Conference - 2009, Pt a and B. 2009:893–894. doi: 10.1186/1743-8454-6-17. [DOI] [PMC free article] [PubMed] [Google Scholar]
- 23.Williams B. Demonstration Analog for Ventricular and Intraspinal Dynamics (David) Journal of the Neurological Sciences. 1974;23(3):445–461. doi: 10.1016/0022-510x(74)90161-0. [DOI] [PubMed] [Google Scholar]
- 24.Fahrig R, Nikolov H, Fox AJ, et al. A three-dimensional cerebrovascular flow phantom. Medical Physics. 1999 Aug;26(8):1589–1599. doi: 10.1118/1.598672. [DOI] [PubMed] [Google Scholar]
- 25.Salm LP, Schuijf JD, Lamb HJ, et al. Validation of a high-resolution, phase contrast cardiovascular magnetic resonance sequence for evaluation of flow in coronary artery bypass grafts. Journal of Cardiovascular Magnetic Resonance. 2007 May;9(3):557–563. doi: 10.1080/10976640601015243. [DOI] [PubMed] [Google Scholar]
- 26.Driscoll B, Keller H, Coolens C. Development of a dynamic flow imaging phantom for dynamic contrast-enhanced CT. Medical Physics. 2011 Aug;38(8):4866–4880. doi: 10.1118/1.3615058. [DOI] [PubMed] [Google Scholar]
- 27.Bouzerar R, Czosnyka M, Czosnyka Z, et al. Physical Phantom of Craniospinal Hydrodynamics. Hydrocephalus. 2012;113:65–69. doi: 10.1007/978-3-7091-0923-6_14. [DOI] [PubMed] [Google Scholar]
- 28.Bottan S, Poulikakos D, Kurtcuoglu V. Phantom model of physiologic intracranial pressure and cerebrospinal fluid dynamics. IEEE Trans Biomed Eng. 2012 Jun;59(6):1532–8. doi: 10.1109/TBME.2012.2187448. [DOI] [PubMed] [Google Scholar]
- 29.Martin BA, Kalata W, Loth F, et al. Syringomyelia hydrodynamics: An in vitro study based on in vivo measurements. Journal of Biomechanical Engineering-Transactions of the Asme. 2005 Dec;127(7):1110–1120. doi: 10.1115/1.2073687. [DOI] [PubMed] [Google Scholar]
- 30.Martin BA, Yiallourou TI, Pahlavian SH, et al. Inter-operator Reliability of Magnetic Resonance Image-Based Computational Fluid Dynamics Prediction of Cerebrospinal Fluid Motion in the Cervical Spine. Ann Biomed Eng. 2015 Oct 7; doi: 10.1007/s10439-015-1449-6. [DOI] [PMC free article] [PubMed] [Google Scholar]
- 31.Yushkevich PA, Piven J, Hazlett HC, et al. User-guided 3D active contour segmentation of anatomical structures: significantly improved efficiency and reliability. Neuroimage. 2006 Jul 01;31(3):1116–28. doi: 10.1016/j.neuroimage.2006.01.015. [DOI] [PubMed] [Google Scholar]
- 32.Yiallourou TI, Kroger JR, Stergiopulos N, et al. Comparison of 4D phase-contrast MRI flow measurements to computational fluid dynamics simulations of cerebrospinal fluid motion in the cervical spine. PLoS One. 2012;7(12):e52284. doi: 10.1371/journal.pone.0052284. [DOI] [PMC free article] [PubMed] [Google Scholar]
- 33.Pahlavian SH, Yiallourou T, Tubbs RS, et al. The Impact of Spinal Cord Nerve Roots and Denticulate Ligaments on Cerebrospinal Fluid Dynamics in the Cervical Spine. PLoS One. 2014 Apr 7;9(4) doi: 10.1371/journal.pone.0091888. [DOI] [PMC free article] [PubMed] [Google Scholar]
- 34.Tubbs RS, Bailey M, Barrow WC, et al. Morphometric analysis of the craniocervical juncture in children with Chiari I malformation and concomitant syringobulbia. Childs Nerv Syst. 2009 Jun;25(6):689–92. doi: 10.1007/s00381-009-0810-1. [DOI] [PubMed] [Google Scholar]
- 35.Tubbs RS, Elton S, Grabb P, et al. Analysis of the posterior fossa in children with the Chiari 0 malformation. Neurosurgery. 2001 May;48(5):1050–4. doi: 10.1097/00006123-200105000-00016. discussion 1054–5. [DOI] [PubMed] [Google Scholar]
- 36.Tubbs RS, Salter G, Grabb PA, et al. The denticulate ligament: anatomy and functional significance. Journal of Neurosurgery. 2001 Apr;94(2):271–275. doi: 10.3171/spi.2001.94.2.0271. [DOI] [PubMed] [Google Scholar]
- 37.Lang J. Clinical Anatomy of the Cervical Spine. G. Thieme Verlag; 1993. [Google Scholar]
- 38.Nauta HJ, Dolan E, Yasargil MG. Microsurgical anatomy of spinal subarachnoid space. Surgical Neurology. 1983 May;19(5):431–7. doi: 10.1016/0090-3019(83)90141-6. [DOI] [PubMed] [Google Scholar]
- 39.Martin BA, Labuda R, Royston TJ, et al. Spinal Subarachnoid Space Pressure Measurements in an In Vitro Spinal Stenosis Model: Implications on Syringomyelia Theories. Journal of Biomechanical Engineering-Transactions of the Asme. 2010 Nov;132(11) doi: 10.1115/1.4000089. [DOI] [PubMed] [Google Scholar]
- 40.Bunck AC, Kroeger JR, Juettner A, et al. Magnetic resonance 4D flow analysis of cerebrospinal fluid dynamics in Chiari I malformation with and without syringomyelia. Eur Radiol. 2012 Sep;22(9):1860–70. doi: 10.1007/s00330-012-2457-7. [DOI] [PubMed] [Google Scholar]
- 41.Pahlavian SH, Bunck AC, Thyagaraj S, et al. Accuracy of 4D Flow Measurement of Cerebrospinal Fluid Dynamics in the Cervical Spine: An In Vitro Verification Against Numerical Simulation. Annals of biomedical engineering. 2016:1–13. doi: 10.1007/s10439-016-1602-x. [DOI] [PMC free article] [PubMed] [Google Scholar]
- 42.Sweetman B, Xenos M, Zitella L, et al. Three-dimensional computational prediction of cerebrospinal fluid flow in the human brain. Comput Biol Med. 2011 Feb;41(2):67–75. doi: 10.1016/j.compbiomed.2010.12.001. [DOI] [PMC free article] [PubMed] [Google Scholar]
- 43.Stockman HW. Effect of anatomical fine structure on the flow of cerebrospinal fluid in the spinal subarachnoid space. Journal of Biomechanical Engineering-Transactions of the Asme. 2006 Feb;128(1):106–114. doi: 10.1115/1.2132372. [DOI] [PubMed] [Google Scholar]
- 44.Barker TM, Earwaker WJ, Lisle DA. Accuracy of stereolithographic models of human anatomy. Australas Radiol. 1994 May;38(2):106–11. doi: 10.1111/j.1440-1673.1994.tb00146.x. [DOI] [PubMed] [Google Scholar]
- 45.Bouyssie JF, Bouyssie S, Sharrock P, et al. Stereolithographic models derived from x-ray computed tomography. Reproduction accuracy. Surg Radiol Anat. 1997;19(3):193–9. [PubMed] [Google Scholar]
- 46.Levi Chazen J, Dyke JP, Holt RW, et al. Automated segmentation of MR imaging to determine normative central nervous system cerebrospinal fluid volumes in healthy volunteers. Clin Imaging. 2017 May-Jun;43:132–135. doi: 10.1016/j.clinimag.2017.02.007. [DOI] [PubMed] [Google Scholar]
- 47.Pahlavian SHBAC, Tubbs RS, Yiallourou T, Loth F, Kroeger JR, Heindel W, Martin BA. Hydrodynamic characterization of cervical cerebrospinal fluid motion by 4D phase-contrast MRI and comparison to 3D computational fluid dynamics simulation. 2014 Under review. [Google Scholar]
- 48.Chen L, Beckett A, Verma A, et al. Dynamics of respiratory and cardiac CSF motion revealed with real-time simultaneous multi-slice EPI velocity phase contrast imaging. Neuroimage. 2015 Nov 15;122:281–7. doi: 10.1016/j.neuroimage.2015.07.073. [DOI] [PMC free article] [PubMed] [Google Scholar]
- 49.Yildiz S, Thyagaraj S, Jin N, et al. Quantifying the influence of respiration and cardiac pulsations on cerebrospinal fluid dynamics using real-time phase-contrast MRI. J Magn Reson Imaging. 2017 Feb 02; doi: 10.1002/jmri.25591. [DOI] [PubMed] [Google Scholar]
- 50.Yamada S, Miyazaki M, Yamashita Y, et al. Influence of respiration on cerebrospinal fluid movement using magnetic resonance spin labeling. Fluids Barriers CNS. 2013 Dec 27;10(1):36. doi: 10.1186/2045-8118-10-36. [DOI] [PMC free article] [PubMed] [Google Scholar]
- 51.Baledent O, Henry-Feugeas MC, Idy-Peretti I. Cerebrospinal fluid dynamics and relation with blood flow: a magnetic resonance study with semiautomated cerebrospinal fluid segmentation. Invest Radiol. 2001 Jul;36(7):368–77. doi: 10.1097/00004424-200107000-00003. [DOI] [PubMed] [Google Scholar]
- 52.Pahlavian SH, Loth F, Luciano M, et al. Neural Tissue Motion Impacts Cerebrospinal Fluid Dynamics at the Cervical Medullary Junction: A Patient-Specific Moving-Boundary Computational Model. Ann Biomed Eng. 2015 Dec;43(12):2911–23. doi: 10.1007/s10439-015-1355-y. [DOI] [PMC free article] [PubMed] [Google Scholar]
Associated Data
This section collects any data citations, data availability statements, or supplementary materials included in this article.