

Abstract
Jumonji D3 (JMJD3) histone demethylase epigenetically regulates development and differentiation, immunity, and tumorigenesis by demethylating a gene repression histone mark, H3K27-me3, but a role for JMJD3 in metabolic regulation has not been described. SIRT1 deacetylase maintains energy balance during fasting by directly activating both hepatic gluconeogenic and mitochondrial fatty acid β-oxidation genes, but the underlying epigenetic and gene-specific mechanisms remain unclear. In this study, JMJD3 was identified unexpectedly as a gene-specific transcriptional partner of SIRT1 and epigenetically activated mitochondrial β-oxidation, but not gluconeogenic, genes during fasting. Mechanistically, JMJD3, together with SIRT1 and the nuclear receptor PPARα, formed a positive autoregulatory loop upon fasting-activated PKA signaling and epigenetically activated β-oxidation–promoting genes, including Fgf21, Cpt1a, and Mcad. Liver-specific downregulation of JMJD3 resulted in intrinsic defects in β-oxidation, which contributed to hepatosteatosis as well as glucose and insulin intolerance. Remarkably, the lipid-lowering effects by JMJD3 or SIRT1 in diet-induced obese mice were mutually interdependent. JMJD3 histone demethylase may serve as an epigenetic drug target for obesity, hepatosteatosis, and type 2 diabetes that allows selective lowering of lipid levels without increasing glucose levels.
Keywords: Cell Biology, Metabolism
Keywords: Epigenetics, Fatty acid oxidation, Obesity
Introduction
In mammals, the liver plays a central role in maintaining energy balance in response to nutrient deprivation by activating lipid and glucose metabolic pathways. During early fasting, the liver stimulates glycogen breakdown to increase glucose levels, but when fasting progresses and glycogen storage is depleted, the liver activates mitochondrial fatty acid β-oxidation to provide both energy for gluconeogenesis and substrate for ketogenesis (1). The hepatic response to fasting is regulated mainly through complicated transcriptional networks controlled by numerous transcriptional factors, including CREB, FOXO1, FOXA2, and the nuclear receptor PPARα (2–5), and transcriptional coregulators, such as CRTC2, PGC-1α, and SIRT1 (2, 6–8).
As a key cellular energy sensor, the NAD+-dependent SIRT1 deacetylase plays a critical role in mediating hepatic fasting responses (8–10). SIRT1 is a transcriptional silencer through deacetylation of histones at target genes (11, 12), but it also directly activates some genes, such as gluconeogenic and β-oxidation genes, in part by deacetylation and activation of PGC-1α (6, 7, 13). However, the mechanisms of direct gene activation by SIRT1 remain poorly understood, particularly with regard to epigenetic regulation in response to nutrient deprivations and whether the regulation of gluconeogenic and β-oxidation genes involves distinct gene-specific mechanisms.
Epigenetic modifications play a critical role in linking environmental signals, such as changes in nutrient and hormonal levels and the circadian rhythm, to regulate genes to maintain homeostasis (11, 14–16). Epigenetics is particularly relevant to metabolic regulation, because the activity of epigenetic enzymes is modulated by the levels of cofactors, such as NAD+, acetyl-CoA, and α-ketoglutarate, which fluctuate depending on the metabolic status (11, 17). Recent studies have demonstrated a critical role for histone-modifying proteins in the epigenetic control of hepatic lipid metabolism. Intriguingly, genome-wide recruitment of HDAC3 histone deacetylase largely directed by the circadian nuclear receptor Rev-erbα plays a critical role in hepatic lipogenesis, and deletion of hepatic HDAC3 or Rev-erbα leads to severe hepatosteatosis (15, 16). In addition, LSD1 histone demethylase interacts with the orphan nuclear receptor SHP and epigenetically regulates bile acid metabolism, 1 carbon metabolism, and autophagy-mediated lipid catabolism in response to the postprandial hormone FGF19 in the late fed state (18–20).
Jumonji D3 (JMJD3, also known as KDM6B) is a JmjC domain–containing histone lysine demethylase that, together with UTX and UTY, belongs to the KDM6 family (21, 22). JMJD3 mediates epigenetic activation of genes by catalyzing the demethylation of a gene repression histone mark, histone H3, trimethylated at K27 (H3K27-me3). JMJD3 has known epigenetic functions in development and differentiation, immunity, and tumorigenesis (21, 23) and was recently shown to have a role in the epigenetic activation of brown fat development and white fat plasticity (24). Further, an intriguing role for JMJD3 in extending lifespan in response to mild mitochondrial stress has been demonstrated (25). However, metabolic functions of JMJD3 have not been reported.
Here, we show that JMJD3 has what we believe to be a novel metabolic role and epigenetically regulates mitochondrial β-oxidation. In response to fasting, the interaction of JMJD3 with both SIRT1 and PPARα is induced, which leads to epigenetic activation of their own genes and of β-oxidation network genes. Further, downregulation of hepatic JMJD3 leads to intrinsic defects in β-oxidation, which results in liver steatosis as well as glucose and insulin intolerance. Remarkably, amelioration of metabolic symptoms by exogenous expression of JMJD3 or SIRT1 in dietary obese mice is mutually interdependent.
Results
JMJD3 is a SIRT1-interacting protein in the livers of fasted mice.
To identify SIRT1-interacting proteins that may affect hepatic SIRT1 functions during fasting, proteins bound to flag-SIRT1 were identified by proteomic analysis in HepG2 cells treated with forskolin (Fsk) to mimic fasting. Known SIRT1-interacting proteins, such as PGC-1α, PPARα, NcoR, and NF-κB (6, 8), as well as previously unknown proteins, including JMJD3 histone demethylase (Figure 1A), were detected in the flag-SIRT1 complex. JMJD3 was particularly unexpected, since JMJD3 epigenetically activates genes (21, 23), while SIRT1 generally inhibits gene expression by deacetylation of histones (11, 12), although SIRT1 also directly activates gluconeogenic and β-oxidation genes (6, 7, 13). In glycerol gradient centrifugation of SIRT1-bound proteins from liver extracts from fasted mice, JMJD3 cosedimented with 2 known gene activators, PPARα and PGC-1α, that drive fasting responses at a rate different from that of a known SIRT1-interacting corepressor, LSD1 (ref. 12 and Figure 1B), suggestive of distinct gene activation and repression SIRT1 complexes.
Figure 1. JMJD3 is a SIRT1-interacting protein.

(A) Proteins in HepG2 cells associated with exogenously expressed flag-SIRT1 (f-SIRT1) were analyzed by LC-MS, and the spectrum identifying a JMJD3 peptide is shown. IB shows interaction of the indicated proteins with flag-SIRT1 detected by co-IP. Ad, adenovirus. (B) Adenovirally expressed flag-SIRT1 was isolated by binding the M2 agarose from liver extracts pooled from 3 mice and analyzed by glycerol gradient (10%–50%) centrifugation. The indicated proteins were detected by IB. (C) Mice (n = 3) were fasted for 16 hours. SIRT1 or JMJD3 was immunoprecipitated from whole-cell extracts, and the levels of JMJD3 or SIRT1 in the immunoprecipitates were determined by IB. (D) JMJD3 and SIRT1 levels in nuclear and cytoplasmic fractions of liver extracts from mice re-fed for 6 hours after fasting and mice fasted for 16 hours. (E) Detection of JMJD3 and SIRT1 by immunofluorescence in liver sections from mice re-fed for 6 hours after fasting and mice fasted for 16 hours. Scale bars: 100 μm (white bars) and 20 μm (yellow bars). Original magnification ×2.5. (F) GST-JMJD3 and GST-SIRT1 constructs are shown. SIRT1 or JMJD3, synthesized in vitro by TNT, was incubated with the GST fusion proteins, and proteins bound to the GST fusion proteins were detected by IB. FL, full length. fd, mice re-fed for 6 hours after fasting; fs, mice fasted for 16 hours.
Fasting resulted in increased interaction between endogenous JMJD3 and SIRT1 in mouse liver extracts (Figure 1C), and, notably, we found that nuclear levels of these proteins were increased in fasted mice, while cytoplasmic levels decreased (Figure 1D). Fasting also increased the nuclear colocalization of JMJD3 and SIRT1 in mouse liver (Figure 1E). Further, treatment with Fsk increased the interaction of exogenously overexpressed Myc-JMJD3 with SIRT1 (Supplemental Figure 1A; supplemental material available online with this article; https://doi.org/10.1172/JCI97736DS1) and increased nuclear colocalization of these 2 proteins in Hepa1c1c7 cells (Supplemental Figure 1B). In glutathione S-transferase (GST) pulldown assays, the C-terminal region of JMJD3 interacted with SIRT1 (Figure 1F, top), and SIRT1 interacted with JMJD3 through its N-terminal region (Figure 1F, bottom). These results demonstrate that JMJD3 is a SIRT1-interacting protein in the liver and that the interaction is increased by fasting. The results suggest that JMJD3, together with SIRT1, may mediate fasting transcriptional responses.
Downregulation of JMJD3 results in decreased expression of hepatic genes involved in mitochondrial functions, including β-oxidation.
To explore global hepatic functions of JMJD3, mRNA levels in control and JMJD3-downregulated hepatocytes were compared by RNA-sequencing (RNA-seq) analysis. We found that the expression of 2,772 and 2,143 genes was significantly decreased and increased, respectively, by over 1.5-fold, with downregulation of JMJD3 (Figure 2A). In gene ontology (GO) analysis, genes downregulated with the highest significance were those involved in mitochondrial functions, particularly oxidation and reduction, the respiratory chain, and fatty acid β-oxidation, whereas genes involved in cell proliferation, the cytoskeleton, and apoptosis were upregulated (Table 1). In contrast, we did not detect differences in gluconeogenic genes, which is potentially significant, since this suggests that JMJD3 may partner with SIRT1 to selectively regulate SIRT1-targeted β-oxidation genes, but not gluconeogenic genes.
Figure 2. JMJD3 is a gene-specific transcriptional partner of SIRT1 and epigenetically activates mitochondrial β-oxidation–promoting genes.

(A and B) Primary mouse hepatocytes were infected with lentivirus expressing JMJD3 shRNA or control shRNA, and the cells were treated with Fsk for 6 hours. (A) JMJD3 and actin detected by IB in cells infected with lenti-Ctl or lenti-shJMJD3 (left). Volcano plot indicates down- or upregulated genes as determined by RNA-seq. (B) mRNA levels of selected genes were determined by qRT-PCR. (C–E) Mice were fasted for 16 hours or re-fed for 6 hours after fasting. (C) Occupancy of JMJD3 and SIRT1 at the indicated genes was determined by ChIP. (D) Re-ChIP: Liver chromatin was immunoprecipitated with SIRT1 antibody, eluted, and reprecipitated with SIRT1 or JMJD3 antibody. (E) Ratios of methylated H3K27-me3 and H3K4-me3 to total histone H3 at the indicated genes were determined by ChIP. (F) Ratios of methylated H3K27-me3 to total H3 at the indicated genes were determined by ChIP in hepatocytes that were infected with lenti-shRNA for JMJD3 or control shRNA and treated with Fsk for 3 hours. n = 6 (B), n = 3 mice/group (C–E), and n = 3 (F). Data represent the mean ± SEM. *P < 0.05 and **P < 0.01, by Student’s t test (B), Mann-Whitney U test (C–E), and 2-way ANOVA with the FDR text (F). Gluconeo, gluconeogenesis.
Table 1. Biological pathways altered by downregulation of JMJD3 in primary mouse hepatocytes identified by GO analysis.

To confirm the RNA-seq data, we examined the effects of downregulation of JMJD3 on the mRNA levels of β-oxidation and gluconeogenic genes in Fsk-treated hepatocytes. We found that expression of all the β-oxidation–promoting genes tested, including the hepatokine, Fgf21, which promotes β-oxidation and ketogenesis (26, 27), and mitochondrial proteins involved in β-oxidation and ketogenesis, including Cpt1a, Mcad, and Hmgcs2, was inhibited by downregulation of JMJD3, whereas expression of the gluconeogenic genes was unchanged (Figure 2B). These results indicate that JMJD3 upregulates direct SIRT1-targeted hepatic genes involved in fatty acid β-oxidation, but not gluconeogenesis, in Fsk-treated hepatocytes.
JMJD3 mediates epigenetic activation of direct SIRT1-targeted β-oxidation–promoting genes, but not gluconeogenic genes.
To determine whether JMJD3 selectively activates direct SIRT1-targeted β-oxidation genes, we examined the effect of fasting on the occupancy of JMJD3 and SIRT1 at the β-oxidation genes Fgf21, Cpt1a, and Mcad and the gluconeogenic genes G-6-Pase and Pepck. In liver ChIP assays, the occupancy of SIRT1 was increased by fasting in both groups of genes, while the occupancy of JMJD3 was increased only at the β-oxidation genes (Figure 2C). In re-ChIP assays, fasting increased JMJD3 occupancy at SIRT1-bound β-oxidation genes but not at gluconeogenic genes (Figure 2D), indicating co-occupancy of JMJD3 and SIRT1 at β-oxidation genes.
JMJD3 epigenetically activates genes by demethylating a gene repression mark, H3K27-me3 (21, 22). Some genes have bivalent histone modifications harboring both a gene repression mark, H3K27-me3, and a gene activation mark, H3K4-me3, within the same chromatin domain, which maintains low basal expression of these genes but allows timely activation in response to environmental cues (21, 23, 28). To determine whether the fasting-induced occupancy of JMJD3 at β-oxidation genes results in epigenetic activation, we examined the effect of fasting on the levels of H3K27-me3 and H3K4-me3 at both β-oxidation and gluconeogenic genes. The H3K27-me3 levels were decreased by fasting at β-oxidation genes but not at gluconeogenic genes, whereas the levels of H3K4-me3 were increased at both groups of genes (Figure 2E). Likewise, treatment of hepatocytes with Fsk resulted in decreased levels of H3K27-me3 only at β-oxidation genes (Figure 2F) and in increased levels of H3K4-me3 (Supplemental Figure 2), and these Fsk-mediated effects on histone modifications were abolished by downregulation of JMJD3. These results indicate that under nutrient-deprived conditions, H3K27-me3 levels are gene-selectively reduced in a JMJD3-dependent manner, resulting in epigenetic activation of β-oxidation, but not gluconeogenic, genes. Notably, hepatic genes involved in β-oxidation appear to be regulated bivalently by H3K4-me3 and H3K27-me3 histone modifications.
Both SIRT1 and PPARα are necessary for the selective recruitment of JMJD3 to β-oxidation genes.
An important question is what determines the selective recruitment of JMJD3 to the SIRT1-bound β-oxidation genes. Since PPARα, CREB, and FOXO1 are important transcriptional factors driving hepatic fasting responses (2–5), we examined the effects of downregulation of each of these factors on the expression of β-oxidation and gluconeogenic genes in Fsk-treated hepatocytes. We found that downregulation of PPARα markedly inhibited the expression of β-oxidation genes, with little effect on gluconeogenic genes, whereas downregulation of CREB or FOXO1 inhibited gluconeogenic genes, with little effect on β-oxidation genes (Supplemental Figure 3A), suggesting that PPARα may recruit JMJD3 to β-oxidation genes.
To test this idea, we first determined the effects of fasting on the interaction of JMJD3 with these factors by co-IP assays. In fasted mice, the interaction of endogenous JMJD3 with SIRT1 or PPARα (Figure 3A), but not with CREB or FOXO1 (Supplemental Figure 3B), was increased. Similarly, treatment of hepatocytes with the fasting stimulus glucagon, Fsk, or the nonhydrolyzable cAMP analog 8-bromo-cAMP, increased the interaction of JMJD3 with SIRT1 and PPARα, but not with CREB or FOXO1 (Supplemental Figure 3C). In ChIP assays, the occupancy of PPARα was increased after fasting at Fgf21, Cpt1a, and Mcad, but not at gluconeogenic genes, whereas the occupancy of CREB and FOXO1 was not increased at β-oxidation genes (Supplemental Figure 3D). Interestingly, the occupancy of PGC-1α was increased at both groups of genes by fasting. These results suggest that PPARα recruits JMJD3 to target genes and that fasting-activated PKA signaling is important for the interaction of JMJD3 with PPARα and SIRT1.
Figure 3. Fasting-induced interaction of JMJD3 with SIRT1 and PPARα is important for recruitment of JMJD3 to β-oxidation genes.

(A) Mice were fasted for 16 hours or re-fed for 6 hours after fasting (n = 3), and co-IP assays were performed using liver whole-cell extracts. (B) Schematic diagrams of PPARα domains (top). JMJD3 and SIRT1 bound to GST-PPARα proteins were detected by IB (bottom). (C) Chromatin from livers of fasted mice was immunoprecipitated with PPARα antibody, eluted, and reprecipitated with SIRT1 or JMJD3 antibody (n = 3). (D) Hepa1c1c7 cells were transfected with the indicated plasmids and infected with shRNA and then treated with the PPARα ligand WY14643 overnight, followed by treatment with Fsk for 6 hours. Relative luciferase activity was normalized to β-gal activity. (E) Hepatocytes were infected with Ad-shSIRT1 or Ad-shCtl for 48 hours or transfected with siPPARα or control siRNA for 48 hours and treated with Fsk for 3 hours. Occupancy of JMJD3 at the indicated genes was determined by ChIP assay (n = 3). (F) C57BL6 and PPARα-KO mice were fasted for 24 hours or re-fed for 24 hours after fasting. Occupancy of JMJD3 at the indicated genes was determined by ChIP assay (n = 5). Data represent the mean ± SEM. **P < 0.01, by Mann-Whitney U test (C) or 2-way ANOVA with the FDR test (E and F).
In GST pulldown assays, PPARα directly interacted with JMJD3 and SIRT1 through different domains (Figure 3B and Supplemental Figure 4), which suggests that PPARα may simultaneously interact with both JMJD3 and SIRT1. Supporting this idea, the occupancy of both JMJD3 and SIRT1 was increased in PPARα-bound chromatin at β-oxidation genes upon fasting (Figure 3C). Further, in cell-based reporter assays, expression of SIRT1 or JMJD3 in Hepa1c1c7 cells increased Fgf21 promoter–luciferase activity, and the increase was blocked by downregulation of JMJD3 or SIRT1 or by mutation of the peroxisome proliferator–activated receptor response element (PPRE) in the promoter (Figure 3D). These results, together, strongly suggest that PPARα is involved in the selective recruitment of JMJD3 to β-oxidation genes.
We next determined whether JMJD3 recruitment to β-oxidation genes is dependent on PPARα and/or SIRT1. In primary mouse hepatocytes, Fsk treatment resulted in increased occupancy of JMJD3 (Figure 3E) and decreased histone H3K27-me3 levels (Supplemental Figure 5) at Fgf21, Cpt1a, and Mcad genes, and these effects were diminished by downregulation of either SIRT1 or PPARα. In liver ChIP assays, fasting increased JMJD3 occupancy at these genes in control mice, but not in PPARα-KO mice (Figure 3F). These results indicate that recruitment of JMJD3 to β-oxidation genes is largely dependent on both SIRT1 and PPARα.
A fasting-induced JMJD3-SIRT1-PPARα complex autoinduces the expression of its own genes.
Treatment of hepatocytes with glucagon, Fsk, or 8-bromo-cAMP, or fasting of mice increased both mRNA (Figure 4A) and protein (Supplemental Figure 6 and Supplemental Figure 3C) levels of Jmjd3, Sirt1, and Pparα. These results suggest that PPARα, together with JMJD3 and SIRT1, may induce their own genes upon nutrient deprivations. Consistent with this idea, fasting increased the occupancy of PPARα, SIRT1, JMJD3, and PGC-1α, but not that of CREB, CRTC2, or FOXO1 at Jmjd3, Sirt1, and Pparα genes (Figure 4B and Supplemental Figure 7), which was associated with decreased histone H3K27-me3 levels and increased H3K4-me3 levels (Figure 4C). Intriguingly, occupancy of SIRT1 and JMJD3 in PPARα-bound chromatin at these genes was increased by fasting (Figure 4D). These results suggest that a transcriptional complex of JMJD3, SIRT1, and PPARα, autoinduces its own genes upon fasting. In support of this idea, Fsk induction of SIRT1 and PPARα was attenuated by JMJD3 downregulation in hepatocytes (Figure 4E, left). Further, Fsk induction of JMJD3 and SIRT1 was also blunted by PPARα downregulation (Figure 4E, right), and fasting-induced increases in protein levels of JMJD3 and SIRT1 were blunted in PPARα-KO mice (Supplemental Figure 8). These results suggest that JMJD3, SIRT1, and PPARα form a positive autoregulatory loop under nutrient-deprived conditions.
Figure 4. JMJD3, SIRT1, and PPARα, together, form a positive autoregulatory loop upon fasting.

(A) Hepatocytes were treated with glucagon (Gln), Fsk, or 8-bromo cAMP (8-bro) for 6 hours, or mice were fasted for 16 hours or re-fed for 6 hours after fasting, and mRNA levels were determined by qRT-PCR (n = 6). (B and C) Mice were fasted for 16 hours or re-fed for 6 hours after fasting. Occupancy of the indicated proteins (B) and the ratios of methylated H3K27-me3 and H3K4-me3 to total histone H3 (C) were determined at the indicated genes by ChIP assay (n = 3). (D) Chromatin from fasted mouse livers was immunoprecipitated with PPARα antibody, eluted, and reprecipitated with JMJD3 or SIRT1 antibody (n = 3). (E) Hepatocytes were infected with lenti-shJMJD3 or transfected with siPPARα for 48 hours, and then cells were treated with Fsk for 6 hours. mRNA levels were determined by qRT-PCR (n = 5). (F) Venn diagram of hepatic genes inhibited by JMJD3 downregulation in hepatocytes (Figure 2A), downregulated genes in PPARα-KO mice (29), and downregulated genes in SIRT1-LKO mice (30). Data represent the mean ± SEM. *P < 0.05 and **P < 0.01, by 1-way ANOVA with the FDR test (A, left), Student’s t test (A, right), Mann-Whitney U test (B–D), or 2-way ANOVA with the FDR test (E).
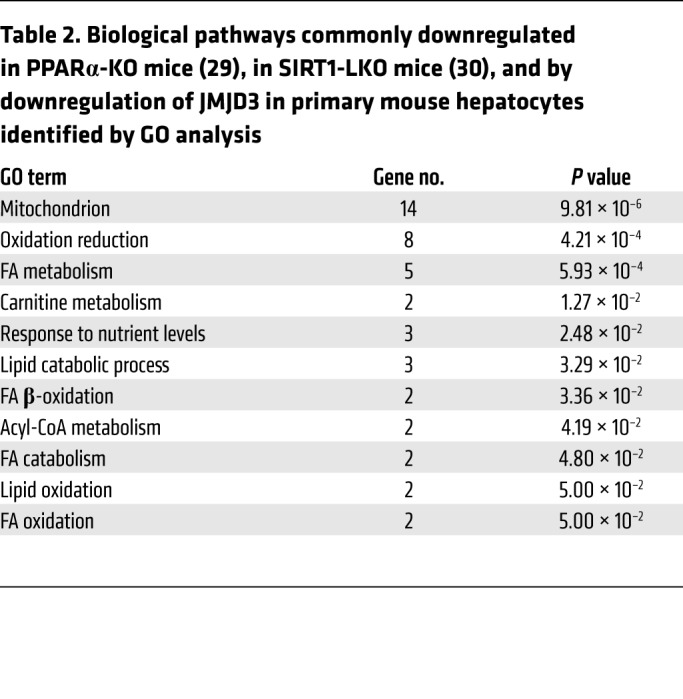
To further examine the global significance of a functional JMJD3-SIRT1-PPARα complex, we compared RNA-seq data from JMJD3-downregulated hepatocytes (Figure 2A) with microarray data from livers of fasted PPARα-KO mice (29) and SIRT1 liver-specific–KO (SIRT1-LKO) mice (30). In bioinformatics analyses, 207 genes were downregulated in both JMJD3-depleted hepatocytes and SIRT1-LKO mice, 393 genes were downregulated in both JMJD3-depleted hepatocytes and PPARα-KO mice, and 46 genes were commonly downregulated in JMJD3-depleted hepatocytes and PPARα-KO and SIRT1-LKO mice (Figure 4F). In GO analysis, hepatic genes potentially regulated by all 3 factors include genes involved in mitochondrial oxidation-reduction and fatty acid metabolic processes (Table 2 and Supplemental Tables 1–3).
Table 2. Biological pathways commonly downregulated in PPARα-KO mice (29), in SIRT1-LKO mice (30), and by downregulation of JMJD3 in primary mouse hepatocytes identified by GO analysis.
PKA-induced phosphorylation of SIRT1 at Ser 434 is important for its interaction with JMJD3 and PPARα.
SIRT1 activity is increased when cellular NAD+ levels are increased (9, 10), but SIRT1 activity is also acutely increased, independently of changes in NAD+ levels, through PKA-induced phosphorylation at Ser 434 in mouse embryonic fibroblasts (MEFs) (13). We thus asked whether SIRT1 is also phosphorylated at Ser 434 in hepatocytes upon PKA signaling and whether SIRT1 (Ser434) phosphorylation is important for its functional interaction with JMJD3 and PPARα in regulating mitochondrial β-oxidation.
Treatment of hepatocytes with Fsk for 30 minutes increased phosphorylated Ser SIRT1 (p-SIRT1 [Ser434]) levels of exogenously expressed WT SIRT1 (Figure 5A, lanes 1–4), but the Ser phosphorylation of SIRT1 was abolished by mutation of Ser434A (Figure 5A, lanes 5 and 6), indicating that PKA activation leads to phosphorylation of SIRT1 at Ser434 in hepatocytes. In co-IP assays, Fsk increased the interaction of SIRT1 with JMJD3, PPARα, and CREB (Figure 5B, lanes 1–4), and, intriguingly, the S434A-SIRT1 mutation selectively abolished the interaction of SIRT1 with JMJD3 and PPARα, while the SIRT1 interaction with CREB was not changed (Figure 5B, lanes 5, 6). We observed similar results in co-IP studies of hepatocytes treated with Fsk for a longer period, 3 hours (Supplemental Figure 9, A and B). Importantly, we found that Fsk-mediated upregulation of Jmjd3, Sirt1 and Pparα and of the β-oxidation genes Cpt1a and Mcad was enhanced by expression of WT SIRT1, but not S434A-SIRT1, and we detected Fsk-mediated increases in mRNA levels of the gluconeogenic genes Pepck and G-6-Pase with both WT SIRT and S434A-SIRT1 (Figure 5C and Supplemental Figure 9C). Consistent with these results, Fsk treatment increased the occupancy of endogenous SIRT1 in hepatocytes at Jmjd3 and Cpt1a, and the increases were enhanced by expression of WT SIRT1, but not by S434A-SIRT1, while the SIRT1 occupancy at G-6-Pase was increased by expression of both WT SIRT1 and S434A-SIRT1 (Figure 5D). These results suggest that PKA-induced SIRT1 (Ser434) phosphorylation is important for its interaction with JMJD3 and PPARα in inducing their own genes as well as β-oxidation genes, but not gluconeogenic genes (model in Figure 5E).
Figure 5. PKA-induced SIRT1 (Ser434) phosphorylation is important for its functional interaction with JMJD3 and PPARα.

Hepatocytes were transfected with WT SIRT1 or S434A-SIRT1 expression plasmids for 24 hours and treated with 10 μM Fsk for 30 minutes (A and B), 3 hours (D), or 6 hours (C). (A) p-SIRT1 (Ser434) levels were determined by IP and IB. (B) SIRT1 was immunoprecipitated from whole-cell extracts and JMJD3, PPARα, and CREB levels in the anti-SIRT1 immunoprecipitates from whole-cell lysates were detected by IB. In A and B, consistent results from 2 independent assays were observed. (C) mRNA levels of the indicated genes (n = 6). (D) Occupancy of SIRT1 at the indicated genes (n = 3). (E) Model: Fasting triggers activation of cAMP/PKA signaling, resulting in phosphorylation of SIRT1 at Ser434 and, consequently, the formation of a JMJD3-SIRT1-PPARα complex in hepatocytes, which autoinduces expression of its own genes and epigenetically activates direct SIRT1-targeted β-oxidation, but not gluconeogenic, genes. Epigenetic activation of β-oxidation by the JMJD3-SIRT1-PPARα complex, thus, maintains liver energy balance during fasting. Data represent the mean ± SEM. (C and D) *P < 0.05 and **P < 0.01, by 2-way ANOVA with the FDR test. E, empty.
Liver-specific downregulation of JMJD3 leads to defective β-oxidation, which contributes to liver steatosis.
To investigate whether hepatic JMJD3 has a role in metabolic regulation, JMJD3 was downregulated specifically in the liver by infection of JMJD3-floxed mice with AAV-TBG-Cre for 3 months (Figure 6A). The thyroxine-binding globulin (TBG) promoter drives hepatocyte-specific expression (31). We found that expression of JMJD3 was decreased by more than 90% in the liver by infection with AAV-TBG-Cre, but was not decreased in brown or white adipose tissue (BAT or WAT) (Figure 6A). Liver-specific downregulation of JMJD3 led to increased body weight and adiposity (Figure 6B), without significant changes in food intake (Supplemental Figure 10A). Notably, liver size (Figure 6B) and liver weight/body weight ratios (Supplemental Figure 10B) were increased, and the levels of neutral lipids (Figure 6C) and triglycerides (TG) (Figure 6D) in the liver were elevated. Consistent with increased liver TG levels and adiposity, the levels of serum TG (Supplemental Figure 10C) and nonesterified fatty acids (NEFAs) (Figure 6D) were also increased, and glucose (Figure 6E) and insulin (Supplemental Figure 10D) tolerances were decreased. These results are suggestive of fatty liver development when JMJD3 was downregulated in mice.
Figure 6. Liver-specific downregulation of JMJD3 leads to impaired β-oxidation and fatty liver symptoms.

(A–J) JMJD3-floxed mice were infected with AAV-TBG-Cre or control AAV-TBG-GFP for 3 months. (A) Experimental outline. Blot shows protein levels of JMJD3 in liver, BAT, subcutaneous WAT (sWAT), and gonadal WAT (gWAT) in pooled samples from 6 mice. (B) Body weight (BW) and image of adipose and liver tissues. rWAT, retroperitoneal WAT. (C) Liver sections were stained with H&E and oil red O. Scale bar: 100 μm. (D) Hepatic TG and serum NEFA levels. (E) Blood glucose levels were determined by glucose tolerance test (GTT). (F) mRNA levels of the indicated hepatic genes. (G) Ratios of H3K27-me3 to total histone H3 at the indicated genes were determined by ChIP. (H) Palmitate oxidation rates in liver extracts. (I) Levels of liver acylcarnitines and serum β-hydroxybutyrate. (J) O2 consumption and CO2 production rates were measured by indirect calorimetry. (K and L) Primary mouse hepatocytes were infected with lentivirus expressing JMJD3 shRNA or control shRNA, and (K) the palmitate oxidation rate and glucose production were determined. (L) p-AKT and AKT levels were measured by IB in hepatocytes treated with insulin for 10 minutes. n = 6–8 mice/group (B and D–J); n = 3 independent assays (K). Data represent the mean ± SEM. *P < 0.05 and **P < 0.01, by Student’s t test. The P values in (J) were determined by the Student’s t test for the average values measured over the times indicated.
The mRNA levels of β-oxidation and ketogenic genes were decreased in JMJD3-downregulated mice, with dramatic decreases in mRNA expression of Fgf21, Cpt1a, and Mcad (Figure 6F), while mRNA expression of lipogenic genes was increased (Supplemental Figure 10E). Further, hepatic expression of SIRT1 and PPARα was also markedly decreased by JMJD3 downregulation in the livers of fasted mice (Supplemental Figure 10F). Consistent with the epigenetic role of JMJD3 in promoting β-oxidation, in ChIP assays, we observed that histone H3K27-me3 levels were significantly increased at Fgf21, Cpt1a, and Mcad genes, but not at Pepck or G-6-Pase genes, by downregulation of JMJD3 (Figure 6G). These results are in agreement with the findings above (Figures 2 and 3) that JMJD3 epigenetically induced β-oxidation genes. Further, we found that the rate of palmitate oxidation was decreased in liver extracts (Figure 6H). Consistent with decreased hepatic β-oxidation, hepatic levels of long-chain acylcarnitine species, an indicator of defective fatty acid β-oxidation, were increased (Figure 6I and Supplemental Figure 10G), and serum levels of a ketone body, β-hydroxybutyrate, were decreased (Figure 6I) in the JMJD3-downregulated mice. Further, O2 consumption and CO2 production were significantly decreased, indicating decreased energy expenditure (Figure 6J).
In primary hepatocytes, we observed that downregulation of JMJD3 resulted in a decreased rate of palmitate oxidation, while glucose production was not changed (Figure 6K). Importantly, hepatic insulin sensitivity assessed by phosphorylated AKT (p-AKT) levels in hepatocytes after insulin treatment was also decreased (Figure 6L). Together, these results demonstrate that liver-specific downregulation of JMJD3 leads to impaired mitochondrial β-oxidation, liver steatosis, and glucose and insulin intolerance in mice fed normal chow.
Liver-specific downregulation of JMJD3 leads to intrinsic defects in hepatic β-oxidation.
Liver-specific downregulation of JMJD3 for 3 months (Figure 6, A–J) led to increases in body weight, adiposity, and liver steatosis. These results raised an important question of whether hepatosteatosis in the JMJD3-downregulated mice is primarily due to dysregulation of intrinsic hepatic lipid metabolism, particularly mitochondrial fatty acid β-oxidation, or secondarily to increased adiposity through liver-adipose interactions.
To address this issue, JMJD3 was downregulated as before, but only for 1 month (Figure 7A), which had little effect on body weight (Figure 6B) or adiposity (Figure 7B). In these mice, the liver weight/body weight ratio (Figure 7C), liver neutral lipid levels, and liver TG levels (Figure 7D) were markedly increased. Serum NEFA levels were not significantly changed (Figure 7E), but the rate of palmitate oxidation in liver extracts was reduced by more than 40% (Figure 7F). Serum levels of the ketone body β-hydroxybutyrate were decreased (Figure 7G). We observed similar results when JMJD3 was downregulated in mice by infection with lentiviral shRNA for 1 month (Supplemental Figure 11). Further, mRNA levels of β-oxidation genes were decreased, and histone H3K27-me3 levels at Fgf21, Cpt1a, and Mcad were increased by downregulation of JMJD3 for 1 month (Figure 7, H and I). These results demonstrate that liver-specific downregulation of JMJD3 causes defects in the intrinsic hepatic β-oxidation that contributes to hepatosteatosis prior to the development of adiposity.
Figure 7. Liver-specific downregulation of JMJD3 leads to defects in intrinsic hepatic β-oxidation and hepatosteatosis prior to increased adiposity.

JMJD3-floxed mice were infected with AAV-TBG-Cre or AAV-TBG-GFP for 1 month. (A) Hepatic protein levels of JMJD3. (B) Image of adipose tissue. (C) Liver weight/body weight ratios. (D) Liver sections were stained as indicated, and hepatic TG levels were determined. Scale bar: 100 μm. (E) Serum NEFA levels. (F) Palmitate oxidation rates were determined in liver extracts. (G) Serum β-hydroxybutyrate levels. (H) Hepatic mRNA levels of the indicated genes. (I) Ratios of H3K27-me3 to total histone H3 at the indicated genes were determined by ChIP. Data represent the mean ± SEM. n = 5–6 mice/group. **P < 0.01, by Student’s t test (C–I).
JMJD3-mediated lipid-lowering effects in obese mice are largely dependent on SIRT1.
Fasting-induced hepatic expression of JMJD3 is markedly impaired in high-fat diet–fed (HFD-fed) obese mice (Figure 8A). We thus asked whether restoring JMJD3 levels in obese mice to normal fasting levels would ameliorate metabolic symptoms and whether SIRT1 is necessary for the JMJD3-mediated lipid-lowering effects (Figure 8B). Remarkably, adenovirus-mediated hepatic expression of JMJD3 in HFD-fed obese mice (Figure 8B) led to substantial decreases in neutral lipid levels (Figure 8C) and TG levels (Figure 8D) in liver. Fatty liver in diet-induced obesity is associated with hepatic inflammation and insulin resistance (32). Indeed, the infiltration of macrophages, a hallmark of local inflammation, was markedly decreased (Figure 8C, bottom row), and glucose tolerance was notably improved (Figure 8E), while insulin tolerance was slightly, but significantly, improved (Supplemental Figure 12A) by JMJD3 expression. Remarkably, all of these beneficial effects conferred by JMJD3 expression in HFD-fed obese mice were markedly attenuated with the downregulation of SIRT1 (Figure 8, C–E).
Figure 8. JMJD3-mediated lipid-lowering effects in HFD obese mice are attenuated by downregulation of SIRT1.

(A) Mice that had been fed a HFD or normal diet (ND) for 12 weeks were fasted for 16 hours or re-fed for 6 hours after fasting. Hepatic JMJD3 levels were determined by IB (n = 3). (B–I) Mice were fed a HFD for 12 weeks or ND and injected with the indicated viruses for 4 weeks. (B) Experimental outline and hepatic JMJD3 and SIRT1 levels. (C) Liver sections were stained as indicated. Scale bar: 100 μm. (D) Liver TG levels. (E) Blood glucose levels were determined by GTT. (F) mRNA levels of the indicated genes. (G) Palmitate oxidation rates were determined in liver extracts. (H) Liver acylcarnitine levels. (I) Serum β-hydroxybutyrate levels. Data represent the mean ± SEM. n = 5–6. *P < 0.05 and **P < 0.01, by 1-way ANOVA with the FDR test (D–I). E, empty.
Consistent with these results, we found that expression of JMJD3 resulted in increased mRNA levels of Cpt1a and Mcad, decreased mRNA levels of proinflammatory genes (Figure 8F), increased palmitate oxidation in liver extracts (Figure 8G), decreased long-chain acylcarnitine levels (Figure 8H), and increased serum β-hydroxybutyrate levels (Figure 8I). All of these JMJD3-mediated effects were blunted by SIRT1 downregulation (Figure 8, C–I). These results indicate that restoration of JMJD3 to normal levels in HFD-fed obese mice leads to improved fatty acid β-oxidation and ameliorates metabolic symptoms of obesity and that these beneficial effects are largely dependent on SIRT1.
Lipid-lowering effects by expression of SIRT1 in dietary obese mice are dependent on JMJD3.
SIRT1 functions are aberrantly low in obese mice (33–35). Transgenic moderate overexpression of SIRT1 (36) or adenovirus-mediated expression of SIRT1 (35) resulted in decreased hepatic lipid levels and improved glucose and insulin tolerance upon HFD challenge. Since JMJD3 is an essential partner of SIRT1 for induction of β-oxidation genes, we tested whether JMJD3 is required for the SIRT1-mediated, lipid-lowering effects in HFD-fed obese mice by downregulation of JMJD3 combined with expression of SIRT1 (Figure 9A).
Figure 9. Lipid-lowering effects mediated by expression of SIRT1 in HFD-fed obese mice are dependent on hepatic JMJD3.

(A–I) Mice were fed a HFD for 3 weeks, infected with the indicated viruses for 5 weeks, and then fasted for 16 hours. (A) Experimental outline and hepatic JMJD3 and SIRT1 levels were determined by IB. (B) Liver weight/body weight ratios. (C) Liver sections were stained as indicated. Scale bar: 100 μm. (D) Liver TG levels. (E) Blood glucose levels were determined by GTT. (F) Hepatic mRNA expression of the indicated genes. (G) Palmitate oxidation rates were determined in liver extracts. (H) Liver acylcarnitine levels. (I) Serum β-hydroxybutyrate levels. Data represent the mean ± SEM. n = 5~7. *P < 0.05 and **P < 0.01, by 1-way ANOVA with the FDR test (B and D–I).
Adenovirus-mediated hepatic expression of SIRT1 resulted in reduced liver/body weight ratios (Figure 9B) and levels of neutral lipids (Figure 9C) and TG (Figure 9D) in liver, decreased macrophage infiltration (Figure 9C, bottom row), improved glucose tolerance (Figure 9E) and a slight, but significant, improvement in insulin tolerance (Supplemental Figure 12B), increased expression of Cpt1a and Mcad, and decreased expression of pro-inflammatory genes (Figure 9F). SIRT1 increases hepatic expression of gluconeogenic genes during fasting under physiological conditions (6, 7), however, in obese mice, overexpression of SIRT1 or treatment with SIRT1 activators did not activate, but instead inhibited, gluconeogenic gene expression, possibly via improved insulin sensitivity (37, 38). Indeed, we observed that hepatic expression of SIRT1 in HFD-fed obese mice resulted in decreased expression of Pepck and G-6-Pase (Figure 9F) and also an increased rate of palmitate oxidation (Figure 9G), decreased long-chain acylcarnitine levels (Figure 9H), and increased serum β-hydroxybutyrate levels (Figure 9I). Remarkably, nearly all these SIRT1-mediated effects were abolished by liver-specific downregulation of JMJD3 (Figure 9, B–I), indicating that SIRT1-mediated, lipid-lowering effects are dependent on JMJD3. These results, together, demonstrate that the beneficial effects conferred by expression of either SIRT1 or JMJD3 in diet-induced obese mice are mutually interdependent.
Discussion
In this study, we demonstrate that fasting-induced JMJD3 is, unexpectedly, a gene-specific transcriptional partner of SIRT1 and activates mitochondrial β-oxidation genes, but not gluconeogenic genes. Upon fasting, JMJD3 forms a transcriptional complex with SIRT1 and PPARα and epigenetically activates expression of β-oxidation genes. Intriguingly, the JMJD3-SIRT1-PPARα complex autoinduces expression of its own genes, forming a fasting-induced feedforward positive autoregulatory loop. The regulation of β-oxidation by this complex, thus, maintains liver energy balance during fasting.
A role for JMJD3 in the physiological regulation of metabolism has not been reported previously. In this study, the expression of genes involved in mitochondrial functions, in particular, oxidation-reduction, FA catabolism, and ketogenesis, were prominently decreased by downregulation of JMJD3. The substantial effect on expression of Fgf21 is particularly intriguing, because FGF21 is a fasting-induced hepatokine that promotes β-oxidation and ketogenesis, and, pharmacologically, FGF21 has received great attention because of its lipid-lowering and insulin-sensitizing effects (26, 27). Further, liver-specific downregulation of JMJD3 led to defective β-oxidation, hepatosteatosis, and glucose and insulin intolerance, independently of adiposity, indicating that JMJD3 promotes intrinsic hepatic β-oxidation. In addition to effects on β-oxidation, which is the focus of this study, the effects on other JMJD3-regulated metabolic pathways, such as lipogenesis, that were identified in our RNA-seq analysis may also contribute to the regulation of liver TG levels.
JMJD3 was shown to regulate development and differentiation programs by activating genes containing bivalent histone marks (21, 23). In this study, selective epigenetic activation of β-oxidation genes by JMJD3 is mediated by decreased levels of the repression histone mark H3K27-me3 at β-oxidation genes but not gluconeogenic genes, while levels of the gene-activating mark H3K4-me3 were increased at both β-oxidation and gluconeogenic genes in fasted mice (Figure 2E). Downregulation of JMJD3 blocked both the decrease in levels of its target, H3K27-me3, and the increase in H3K4-me3 levels at β-oxidation genes (Supplemental Figure 2), which suggests that the methylation at H3K4 is influenced by the demethylation at H3K27. This JMJD3-mediated epigenetic activation of β-oxidation genes by bivalent histone modifications allows for low basal expression of these genes in fed animals and a timely induction in response to fasting. In addition to JMJD3-mediated effects on histone modifications, SIRT1 also represses its target genes by deacetylating histone H4K16-Ac and H3K9/14-Ac (11, 12). We observed that levels of these gene-activating histone modifications were not decreased at either β-oxidation or gluconeogenic genes upon fasting (Supplemental Figure 13), which is consistent with activation, rather than repression, of these genes.
The critical role of SIRT1 in transcriptional activation of both gluconeogenesis and FA β-oxidation has been established (6, 7, 13). We now show that the regulatory mechanisms for these 2 pathways are distinct and, in particular, that selective activation of β-oxidation genes by SIRT1 is dependent on its gene-specific transcriptional partner, JMJD3. While occupancy of SIRT1 is increased by fasting at both β-oxidation and gluconeogenic genes, JMJD3 and PPARα occupancy is increased only at the promoter regions of the β-oxidation genes we examined. Indeed, comparative bioinformatics analyses from RNA-seq data (Figure 2A) and microarray data in fasted SIRT1-LKO (30) and PPARα-KO (29) mice provide evidence for the global importance of SIRT1 and PPARα in their functional interaction with JMJD3 to regulate mitochondrial β-oxidation (Figure 4F). Other factors, such as FOXA2, are also involved in the activation of β-oxidation in the liver (4), but the present study establishes a new function for the fasting-induced JMJD3-SIRT1-PPARα complex in the selective epigenetic activation of β-oxidation genes.
PKA-induced phosphorylation of SIRT1 at Ser434 rapidly increased SIRT1 activity independently of cellular NAD+ levels in MEF cells, which results in increased β-oxidation in part by SIRT1-mediated deacetylation of PGC-1α (13). In this study, the SIRT1 (Ser434) phosphorylation was also increased in hepatocytes upon PKA signaling, which enhanced the interaction of SIRT1 selectively with JMJD3 and PPARα, resulting in induction of their own and β-oxidation genes, but not gluconeogenic genes (model in Figure 5E). Further, occupancy of WT SIRT1 was increased at both β-oxidation and gluconeogenic genes in Fsk-treated hepatocytes (Figure 5D), while occupancy of phosphorylation-defective S434A-SIRT1 was increased at gluconeogenic genes but not at β-oxidation genes (Figure 5D), which demonstrates the key role of Ser434A phosphorylation in gene-selective actions of SIRT1. It will thus be interesting to see whether deacetylation of PGC-1α mediated by SIRT1 (Ser434) phosphorylation (13) facilitates formation of the JMJD3-SIRT1-PPARα complex at β-oxidation genes. In addition, phosphorylation of PGC-1α by S6K1 was shown to inhibit its ability to induce gluconeogenic, but not β-oxidation, genes (39), and small molecules have been identified that selectively inhibit PGC-1α–dependent gluconeogenic activity by increasing the acetylation of PGC-1α (40). Thus, fasting-induced expression of gluconeogenic or β-oxidation genes can be selectively activated by posttranslational modifications of key gene regulators, such as PGC-1α and SIRT1.
The beneficial lipid-lowering effects and amelioration of metabolic syndromes by expression of SIRT1 or treatment with SIRT1-activating compounds or dietary supplements in obese animals have been intensively studied (9, 10, 41). In the present study, JMJD3 was required for the beneficial effects mediated by expression of SIRT1 in obese mice and vice versa. The beneficial effects of restoring JMJD3 levels in obese mice were dramatic, and thus it is tempting to speculate that lipid-lowering effects by activators of SIRT1 or PPARα might also be dependent on JMJD3. The interdependence of the beneficial effects of these factors implies that decreased levels of the SIRT1-JMJD3-PPARα complex, possibly due to decreased expression of these proteins or impaired functional interactions among these proteins in obese animals, contribute to the development of fatty liver and glucose and insulin intolerance. We have shown that the expression and deacetylase activity of SIRT1 are decreased by microRNA-34a in obesity (34, 42, 43) and that nuclear localization and deacetylase activity of SIRT1 are also inhibited by obesity-related phosphorylation of SIRT1 (33). Thus, diminished SIRT1 functions in obesity may underlie the decreased levels of the JMJD3-SIRT1-PPARα complex.
A recent study reported intriguing findings that mild mitochondrial stress can increase longevity and that JMJD3 expands the lifespan of organisms and maintains mitochondrial proteostasis through epigenetic regulation (25). We observed that the biological pathways most highly regulated by JMJD3 include those involved in mitochondrial functions. Interestingly, lipid catabolism has been strongly implicated in organismal longevity. For example, expression or activation of SIRT1, the mammalian ortholog of the longevity protein yeast Sir2, promotes mitochondrial β-oxidation and extends lifespan in model organisms (8, 38, 44). Activation of PPARα signaling (45) has been associated with increased lifespan in worms. Further, supplementation of α-ketoglutarate, a cofactor that increases the activity of JMJD3, was shown to extend lifespan in worms (46). All these findings suggest that the JMJD3-SIRT1-PPARα complex, through regulation of lipid catabolism, may have a role in increasing organismal longevity.
In conclusion, we demonstrate that JMJD3, together with SIRT1 and PPARα, epigenetically activates β-oxidation genes to maintain energy balance during fasting. Epigenetics has emerged as an exciting area for drug development, because epigenetic enzymes are often aberrantly expressed in human diseases and function as gene-specific regulators, as demonstrated in this report by the gene-selective activation of β-oxidation by JMJD3. Since JMJD3 and SIRT1 function is aberrantly low in obese animals, small molecules that activate JMJD3 and/or promote the interaction of JMJD3 with SIRT1 and/or PPARα may provide novel therapeutic approaches to treat obesity, hepatosteatosis, and type 2 diabetes, which selectively lower lipid levels without increasing glucose levels.
Methods
Materials and reagents.
The antibodies SIRT1 (sc-74465), JMJD3 (sc-130157), PGC1α (sc-13067), NF-κB (sc-372), PPARα (sc-9000), CREB (sc-186), and FOXO1 (sc-11350) were purchased from Santa Cruz Biotechnology; NcoR (ABE251) and H4 (catalog 06-398) fromMilliporeSigma; H3K27me3 (ab6002), H3K4me3 (ab8580), H3 (ab1791), and FOXO1 (ab39670) from Abcam; LSD1 (product no. 2139) and β-actin (product no. 4970L) from Cell Signaling Technology; and siGENOME Mouse Creb1 (M-040959-01-0005), siGENOME mouse PPARα (M-040740-01-0005), and siGENOME mouse Foxo1 (M-041127-00-0005) from Dharmacon. The adenoviral vectors for shSIRT1 and flag-SIRT1 were obtained from Pere Puigserver (Dana-Farber Cancer Institute, Boston, Massachusetts, USA). The Fgf21-luc vector was obtained from Xiaoling Li (National Institute of Environmental Health Sciences, Research Triangle Park, North Carolina, USA)
Animal experiments.
For liver-specific depletion of JMJD3, 8-week-old male JMJD3-floxed mice (47) were injected via the tail vein with 1 × 10¹¹ to 2 × 10¹¹ genome copies/body weight AAV-TBG-Cre or -GFP (31) (Vector Biolabs) for 1 to 3 months and fasted for 16 hours before sacrifice. For hepatic downregulation of JMJD3 and expression of SIRT1 in dietary obese mice, male JMJD3-floxed mice were fed a HFD for 5 weeks and then injected i.v. with AAV-TBG-Cre (2 × 10¹¹ genome copies/body weight) and Ad-GFP or Ad-SIRT1 (0.5 × 10⁹ to 1.0 × 10⁹ active viral particles) and were sacrificed 3 weeks later. Infection of mice with these adenoviral doses does not cause marked inflammation (33, 48, 49). For hepatic expression of JMJD3 in obese mice, male C57BL/6 mice fed a HFD (60% fat; Research Diets) for 12 weeks were injected with Ad-JMJD3, and 4 weeks later, the mice were sacrificed. Glucose and insulin tolerances were analyzed as described previously (33, 34, 48). Briefly, mice were fasted for 6 hours and injected i.p. with 2 g/kg glucose or with 0.25 U insulin/kg (Lilly), respectively, and glucose levels were measured using an Accu-Chek Aviva Glucometer (Roche). PPARα-KO mice (B6;129S4-Pparatm1Gonz, no. 008154) were purchased from The Jackson Laboratory.
Metabolic measurements.
Liver TG levels were measured using the Sigma Kit TR0100 (Sigma-Aldrich), and serum NEFA levels were determined by HR Series NEFA-HR (Wako Diagnostics). Liver acylcarnitine and serum β-hydroxybutyrate levels were measured by gas chromatography–mass spectrometry (GC-MS) and liquid chromatography–MS (LC-MS) at the Metabolomics Center of the University of Illinois Urbana-Champaign (UIUC) (Urbana, Illinois, USA). Oxidation of [1-14C] palmitate acid was determined in liver extracts as previously described (13).
Primary mouse hepatocytes and cell cultures.
Hepatocytes were isolated by collagenase (0.8 mg/ml; Sigma-Aldrich) perfusion through the portal vein of mice anesthetized with isoflurane as previously described (33, 48, 49). The hepatocyte suspension was passed through a 100-μm nylon cell strainer (BD), and the hepatocytes were washed by centrifugation, resuspended in M199 medium (M4530; Sigma-Aldrich), and centrifuged through 45% Percoll (Sigma-Aldrich). Hepa1c1c7 (ATCC CRL 2026) and HepG2 cells (ATCC HB8065) were cultured in DMEM/F12 (1:1) containing 10 % serum. To mimic fasting, cells were incubated in DMEM/F12 (1:1) media containing 5 mM glucose for 24 hours and treated with 10 μM Fsk for 30 minutes, 3 hours, or 6 hours. For lentiviral infection of primary mouse hepatocytes, the lentivirus packaging plasmids pMD2.G and psPAX2 (Addgene) were used to make lenti-shCtl and lenti-shJMJD3. Primary mouse hepatocytes were infected with lentivirus for 48 hours, followed by treatment with 5 mM glucose and 10 μM Fsk for 6 hours to mimic fasting.
RNA-seq analysis.
Primary mouse hepatocytes were pooled from 5 mice and infected with lenti-shJMJD3 or lenti-shCtl for 48 hours and then treated with Fsk for 6 hours. RNA was isolated with the RNeasy Kit (QIAGEN), and the cDNA library was sequenced using an Illumina HiSeq 2000 to produce paired-end 100-bp reads. One library of reads per biological sample was examined for sequencing errors prior to mapping. Trimmomatic, version 0.36, was used to remove sequence adapters and low-quality bases, quality control was checked by FastQC, version 0.11.5, and sequencing alignment was performed using STAR, version 2.5.3a. The differential expression profiles of RNA-seq were analyzed by the edgeR-based R (version 3.4.1) pipeline, and results are presented with volcano blots. For all comparisons, a P value of less than 0.05 was considered significant. Functional GO was analyzed using the Database for Annotation, Visualization, and Integrated Discovery (DAVID) program (50, 51). The RNA-seq data have been deposited in the NCBI’s Gene Expression Omnibus database (GEO GSE113032).
Immunoblot analysis.
For immunoblot (IB) analysis, liver tissues or cells were washed with ice-cold PBS and homogenized in RIPA buffer (50 mM Tris, pH 7.5, 1 mM EDTA, 1% NP40, 1% sodium deoxycholate, 1 mM DTT, and 0.1% SDS). Cell lysates were subjected to electrophoresis, transferred to PVDF membranes, blocked, and incubated with primary antibodies, followed by a secondary HRP-linked antibody. Band densities were quantified using ImageJ (NIH).
Glycerol gradient cosedimentation.
Flag-SIRT1 was adenovirally expressed in mouse liver, and flag-SIRT1–associated proteins were isolated by binding to M2 agarose. The protein complex was eluted and layered on a 10% to 50% glycerol gradient. After centrifugation at 280,000 x g for 16 hours in a Beckman SW 50.1 rotor, 12 fractions were collected, and proteins were concentrated by precipitation with 10% TCA-acetone and detected by IB analysis.
LC-MS analysis.
Flag-mouse SIRT1 was adenovirally expressed in HepG2 cells, and after 48 hours, the cells were cultured in DMEM/F12 (1:1) media with low (5 mM) glucose for 24 hours, followed by treatment with 10 μM Fsk for 6 hours. Cells were lysed in RIPA buffer, and flag-SIRT1 was isolated in RIPA buffer using M2 agarose. Proteins were separated by SDS-PAGE and visualized by colloidal staining, and bands containing flag-SIRT1 were analyzed by LC-MS.
Immunofluorescence.
Mice were fasted for 16 hours or re-fed for 6 hours after fasting, and liver tissues were fixed with 4% formaldehyde. Paraffin-embedded liver sections were incubated with primary antibodies for 2 hours and with a secondary antibody, Alexa Fluor 647 goat anti-mouse IgG or Alexa Fluor 532 anti-rabbit IgG, for 1 hour. Hepa1c1c7 cells were grown on coverslips for 2 days, transferred to serum-free media overnight, and treated with 10 μM Fsk for 6 hours. After fixation with 4% formaldehyde for 15 minutes, cells were permeabilized by incubation in 0.5% Triton-X 100 in PBS for 15 minutes. Cells were incubated with primary antibody (dilution 1:200 in PBS) for 2 hours at room temperature and with a secondary antibody, Alexa Fluor 488 goat anti-mouse or Texas red goat anti-rabbit IgG (dilution 1:500 in PBS), for 1 hour. Nuclei were labeled by Hoechst staining (dilution 1:1,000) for 5 minutes and imaged by confocal microscopy (LSM700; Zeiss).
Histological analysis.
Neutral lipids in frozen liver sections were detected by oil red O staining, and paraffin-embedded sections were stained with H&E. Stained slides were imaged with a NanoZoomer Scanner (Hamamatsu).
Measurement of metabolic rate.
The metabolic rate was measured by indirect calorimetry in open-circuit Oxymax chambers in the Comprehensive Lab Animal Monitoring System (CLAMS) (Columbus Instruments). Mice were housed individually in the chamber, and O2 gas was calibrated before monitoring. The chamber was maintained at 23°C with 12-hour light/12-hour dark cycles, and food and water were available ad libitum. Food and water consumption and O2 consumption with CO2 production were measured directly as continuously accumulated data.
Measurement of hepatic insulin sensitivity and glucose output in hepatocytes.
Hepatocytes were infected with lenti-shJMJD3 or lenti-shCtl as a control. Two days later, the cells were treated with 100 nM insulin for ten minutes, and p-AKT and total AKT levels in cell extracts were detected by IB. Glucose output in hepatocytes was measured 3 hours after replacing media with glucose-free DMEM (pH 7.4) without phenol red, supplemented with 2 mM sodium pyruvate and 20 mM sodium lactate, as previously described (6).
GST pulldown and co-IP.
GST fusion proteins were expressed in E. coli BL21 (DE3), and JMJD3, SIRT1, and PPARα were synthesized in vitro by TNT (Promega). Proteins interacting with GST fusion proteins were detected by IB. For co-IP, mouse liver extracts or cell extracts were prepared in co-IP buffer (50 mM Tris, pH 8.0, 150 mM NaCl, 2 mM EDTA, 0.3% NP40, 10% glycerol). The extracts were incubated overnight with antibodies or control IgG and then with protein G agarose. One hour later, agarose beads were washed with the co-IP buffer, and bound proteins were detected by IB.
ChIP and re-ChIP.
ChIP assays were performed as described previously (18, 19, 48, 52). Briefly, liver tissues or cells were finely minced and washed twice with PBS and then incubated with 1% formaldehyde for 10 minutes at room temperature, and glycine (125 mM) was added for 3 minutes. Cells were resuspended in hypotonic buffer and lysed by homogenization. Nuclei were pelleted and resuspended in sonication buffer (50 mM Tri-HCl, pH 8.0, 2 mM EDTA, 1% SDS) and sonicated 4 times at 10-second intervals using a QSonica XL-2000 instrument at power output setting 8, or using a QSonica 800R2-110 at amplitude setting 70% with a pulse rate of 15 seconds on and 45 seconds off. After centrifugation, the chromatin sample was precleared and immunoprecipitated with 2 μg antibodies overnight at 4°C. The immune complexes were collected by incubation for 1 hour with a protein G–sepharose slurry (Invitrogen, Thermo Fisher Scientific) containing salmon sperm DNA. Next, the beads were extensively washed, incubated in 200 mM NaCl overnight at 65°C to reverse the cross-links, DNA was isolated, and enrichment of sequences of target genes was determined by quantitative PCR (qPCR) using the iCycler iQ (Bio-Rad). For re-ChIP, the immune complex was eluted with 10 mM DTT at 37°C for 30 minutes, diluted 20× with 20 mM Tris-HCl, pH 8.0, 150 mM NaCl, 2 mM EDTA, and 1% Triton X-100 and then reimmunoprecipitated. Primer sequences are listed in Supplemental Table 4.
Luciferase reporter assay.
Hepa1c1c7 cells were infected with lenti-shJMJD3 or Ad-shSIRT1, and 24 hours later, the cells were transfected with expression and reporter plasmids using Lipofectamine 2000 (Thermo Fisher Scientific). After 24 hours, the cells were incubated overnight in serum-free medium containing 15 μM WY14643 and then treated with Fsk for 6 hours. The values for luciferase activity were normalized to β-gal activity.
Quantitative reverse transcription PCR.
Total RNA was isolated using TRIzol (Invitrogen, Thermo Fisher Scientific), cDNA was synthesized, and quantitative reverse transcription PCR (qRT-PCR) was performed with the iCycler iQ. The amount of mRNA for each gene was normalized to that of 36B4 mRNA. The primer sequences are listed in Supplemental Table 5.
Statistics.
Data were analyzed by 2-tailed Student’s t test, a Mann-Whitney U test, or a 1- or 2-way ANOVA, with an FDR test for single or multiple comparisons as appropriate using GraphPad Prism (GraphPad Software). A P value of less than 0.05 was considered statistically significant.
Study approval.
All animal use and biosafety protocols were approved by the IACUC and biosafety committees of the University of Illinois at Urbana-Champaign and were in accordance with NIH guidelines.
Author contributions
SS and JKK designed the research. SS, YCK, SB, and SC performed experiments. ZX performed proteomic analyses. NI provided the JMJD3-floxed mice. YCK, YZ, and JM performed RNA-seq analysis. CW and KG provided key materials for the study. SS, YCK, SB, SC, BK, and JKK analyzed data. SS, BK, and JKK wrote the manuscript.
Supplementary Material
Acknowledgments
We thank Pere Puigserver (Dana-Farber Cancer Institute) for providing adenoviral vectors for shSIRT1 and flag-SIRT1; Xiaoling Li (National Institute of Environmental Health Sciences) for providing the Fgf21-luc construct; and Supriya Prasanth (University of Illinois at Urbana-Champaign, Urbana, Illinois, USA) for advice on the glycerol cosedimentation studies. This study was supported by grants from the NIH (DK62777 and DK95842) and a Basic Science Award from the American Diabetes Association (1-16-IBS-156) to JKK.
Version 1. 06/18/2018
Electronic publication
Version 2. 07/02/2018
Print issue publication
Funding Statement
Regulation of cholesterol catabolism by bile acids
Coordination of gut-liver bile acid signaling by FXR
Gene-specific control of energy metabolism by jmjd3 histone demethylase
Footnotes
Conflict of interest: The authors have declared that no conflict of interest exists
Reference information: J Clin Invest. 2018;128(7):3144–3159.https://doi.org/10.1172/JCI97736.
Contributor Information
Sunmi Seok, Email: smiseok@illinois.edu.
Young-Chae Kim, Email: ychaekim@illinois.edu.
Sangwon Byun, Email: swbyun00@illinois.edu.
Sunge Choi, Email: se777@hanmail.net.
Zhen Xiao, Email: zhenjxiao@yahoo.com.
Naoki Iwamori, Email: iwamori@agr.kyushu-u.ac.jp.
Yang Zhang, Email: yzhan116@illinois.edu.
Chaochen Wang, Email: Chaochen.Wang@nih.gov.
Jian Ma, Email: jianma@cs.cmu.edu.
Kai Ge, Email: kai.ge@nih.gov.
Byron Kemper, Email: byronkem@life.illinois.edu.
References
- 1.Habegger KM, Heppner KM, Geary N, Bartness TJ, DiMarchi R, Tschöp MH. The metabolic actions of glucagon revisited. Nat Rev Endocrinol. 2010;6(12):689–697. doi: 10.1038/nrendo.2010.187. [DOI] [PMC free article] [PubMed] [Google Scholar]
- 2.Altarejos JY, Montminy M. CREB and the CRTC co-activators: sensors for hormonal and metabolic signals. Nat Rev Mol Cell Biol. 2011;12(3):141–151. doi: 10.1038/nrm3072. [DOI] [PMC free article] [PubMed] [Google Scholar]
- 3.Lin HV, Accili D. Hormonal regulation of hepatic glucose production in health and disease. Cell Metab. 2011;14(1):9–19. doi: 10.1016/j.cmet.2011.06.003. [DOI] [PMC free article] [PubMed] [Google Scholar]
- 4.Wolfrum C, Asilmaz E, Luca E, Friedman JM, Stoffel M. Foxa2 regulates lipid metabolism and ketogenesis in the liver during fasting and in diabetes. Nature. 2004;432(7020):1027–1032. doi: 10.1038/nature03047. [DOI] [PubMed] [Google Scholar]
- 5.Kersten S. Integrated physiology and systems biology of PPARα. Mol Metab. 2014;3(4):354–371. doi: 10.1016/j.molmet.2014.02.002. [DOI] [PMC free article] [PubMed] [Google Scholar]
- 6.Rodgers JT, Lerin C, Haas W, Gygi SP, Spiegelman BM, Puigserver P. Nutrient control of glucose homeostasis through a complex of PGC-1alpha and SIRT1. Nature. 2005;434(7029):113–118. doi: 10.1038/nature03354. [DOI] [PubMed] [Google Scholar]
- 7.Rodgers JT, Puigserver P. Fasting-dependent glucose and lipid metabolic response through hepatic sirtuin 1. Proc Natl Acad Sci U S A. 2007;104(31):12861–12866. doi: 10.1073/pnas.0702509104. [DOI] [PMC free article] [PubMed] [Google Scholar]
- 8.Chang HC, Guarente L. SIRT1 and other sirtuins in metabolism. Trends Endocrinol Metab. 2014;25(3):138–145. doi: 10.1016/j.tem.2013.12.001. [DOI] [PMC free article] [PubMed] [Google Scholar]
- 9.Cantó C, Auwerx J. Targeting sirtuin 1 to improve metabolism: all you need is NAD(+)? Pharmacol Rev. 2012;64(1):166–187. doi: 10.1124/pr.110.003905. [DOI] [PMC free article] [PubMed] [Google Scholar]
- 10.Imai S, Guarente L. Ten years of NAD-dependent SIR2 family deacetylases: implications for metabolic diseases. Trends Pharmacol Sci. 2010;31(5):212–220. doi: 10.1016/j.tips.2010.02.003. [DOI] [PMC free article] [PubMed] [Google Scholar]
- 11.Nakahata Y, et al. The NAD+-dependent deacetylase SIRT1 modulates CLOCK-mediated chromatin remodeling and circadian control. Cell. 2008;134(2):329–340. doi: 10.1016/j.cell.2008.07.002. [DOI] [PMC free article] [PubMed] [Google Scholar]
- 12.Mulligan P, et al. A SIRT1-LSD1 corepressor complex regulates Notch target gene expression and development. Mol Cell. 2011;42(5):689–699. doi: 10.1016/j.molcel.2011.04.020. [DOI] [PMC free article] [PubMed] [Google Scholar]
- 13.Gerhart-Hines Z, et al. The cAMP/PKA pathway rapidly activates SIRT1 to promote fatty acid oxidation independently of changes in NAD(+) Mol Cell. 2011;44(6):851–863. doi: 10.1016/j.molcel.2011.12.005. [DOI] [PMC free article] [PubMed] [Google Scholar]
- 14.Lu C, Thompson CB. Metabolic regulation of epigenetics. Cell Metab. 2012;16(1):9–17. doi: 10.1016/j.cmet.2012.06.001. [DOI] [PMC free article] [PubMed] [Google Scholar]
- 15.Feng D, et al. A circadian rhythm orchestrated by histone deacetylase 3 controls hepatic lipid metabolism. Science. 2011;331(6022):1315–1319. doi: 10.1126/science.1198125. [DOI] [PMC free article] [PubMed] [Google Scholar]
- 16.Sun Z, Feng D, Everett LJ, Bugge A, Lazar MA. Circadian epigenomic remodeling and hepatic lipogenesis: lessons from HDAC3. Cold Spring Harb Symp Quant Biol. 2011;76:49–55. doi: 10.1101/sqb.2011.76.011494. [DOI] [PMC free article] [PubMed] [Google Scholar]
- 17.Guarente L. The logic linking protein acetylation and metabolism. Cell Metab. 2011;14(2):151–153. doi: 10.1016/j.cmet.2011.07.007. [DOI] [PubMed] [Google Scholar]
- 18.Kim YC, Fang S, Byun S, Seok S, Kemper B, Kemper JK. FXR-induced lysine-specific histone demethylase, LSD1, reduces hepatic bile acid levels and protects the liver against bile acid toxicity. Hepatology. 2015;62(1):220–231. doi: 10.1002/hep.27677. [DOI] [PMC free article] [PubMed] [Google Scholar]
- 19.Byun S, et al. A postprandial FGF19-SHP-LSD1 regulatory axis mediates epigenetic repression of hepatic autophagy. EMBO J. 2017;36(12):1755–1769. doi: 10.15252/embj.201695500. [DOI] [PMC free article] [PubMed] [Google Scholar]
- 20.Kim YC, et al. AhR and SHP regulate phosphatidylcholine and S-adenosylmethionine levels in the one-carbon cycle. Nat Commun. 2018;9(1):540. doi: 10.1038/s41467-018-03060-y. [DOI] [PMC free article] [PubMed] [Google Scholar]
- 21.Shi Y. Histone lysine demethylases: emerging roles in development, physiology and disease. Nat Rev Genet. 2007;8(11):829–833. doi: 10.1038/nrg2218. [DOI] [PubMed] [Google Scholar]
- 22.Hong S, Cho YW, Yu LR, Yu H, Veenstra TD, Ge K. Identification of JmjC domain-containing UTX and JMJD3 as histone H3 lysine 27 demethylases. Proc Natl Acad Sci U S A. 2007;104(47):18439–18444. doi: 10.1073/pnas.0707292104. [DOI] [PMC free article] [PubMed] [Google Scholar]
- 23.Chen S, et al. The histone H3 Lys 27 demethylase JMJD3 regulates gene expression by impacting transcriptional elongation. Genes Dev. 2012;26(12):1364–1375. doi: 10.1101/gad.186056.111. [DOI] [PMC free article] [PubMed] [Google Scholar]
- 24.Pan D, et al. Jmjd3-mediated H3K27me3 dynamics orchestrate brown fat development and regulate white fat plasticity. Dev Cell. 2015;35(5):568–583. doi: 10.1016/j.devcel.2015.11.002. [DOI] [PMC free article] [PubMed] [Google Scholar]
- 25.Merkwirth C, et al. Two conserved histone demethylases regulate mitochondrial stress-induced longevity. Cell. 2016;165(5):1209–1223. doi: 10.1016/j.cell.2016.04.012. [DOI] [PMC free article] [PubMed] [Google Scholar]
- 26.Kliewer SA, Mangelsdorf DJ. Fibroblast growth factor 21: from pharmacology to physiology. Am J Clin Nutr. 2010;91(1):254S–257S. doi: 10.3945/ajcn.2009.28449B. [DOI] [PMC free article] [PubMed] [Google Scholar]
- 27.Fisher FM, Maratos-Flier E. Understanding the physiology of FGF21. Annu Rev Physiol. 2016;78:223–241. doi: 10.1146/annurev-physiol-021115-105339. [DOI] [PubMed] [Google Scholar]
- 28.Voigt P, Tee WW, Reinberg D. A double take on bivalent promoters. Genes Dev. 2013;27(12):1318–1338. doi: 10.1101/gad.219626.113. [DOI] [PMC free article] [PubMed] [Google Scholar]
- 29.Montagner A, et al. Liver PPARα is crucial for whole-body fatty acid homeostasis and is protective against NAFLD. Gut. 2016;65(7):1202–1214. doi: 10.1136/gutjnl-2015-310798. [DOI] [PMC free article] [PubMed] [Google Scholar]
- 30.Purushotham A, Schug TT, Xu Q, Surapureddi S, Guo X, Li X. Hepatocyte-specific deletion of SIRT1 alters fatty acid metabolism and results in hepatic steatosis and inflammation. Cell Metab. 2009;9(4):327–338. doi: 10.1016/j.cmet.2009.02.006. [DOI] [PMC free article] [PubMed] [Google Scholar]
- 31.Miller RA, et al. Adiponectin suppresses gluconeogenic gene expression in mouse hepatocytes independent of LKB1-AMPK signaling. J Clin Invest. 2011;121(6):2518–2528. doi: 10.1172/JCI45942. [DOI] [PMC free article] [PubMed] [Google Scholar]
- 32.Meex RCR, Watt MJ. Hepatokines: linking nonalcoholic fatty liver disease and insulin resistance. Nat Rev Endocrinol. 2017;13(9):509–520. doi: 10.1038/nrendo.2017.56. [DOI] [PubMed] [Google Scholar]
- 33.Choi SE, et al. Obesity-linked phosphorylation of SIRT1 by casein kinase 2 inhibits its nuclear localization and promotes fatty liver. Mol Cell Biol. 2017;37(15):e00006-17. doi: 10.1128/MCB.00006-17. [DOI] [PMC free article] [PubMed] [Google Scholar]
- 34.Fu T, et al. MicroRNA 34a inhibits beige and brown fat formation in obesity in part by suppressing adipocyte fibroblast growth factor 21 signaling and SIRT1 function. Mol Cell Biol. 2014;34(22):4130–4142. doi: 10.1128/MCB.00596-14. [DOI] [PMC free article] [PubMed] [Google Scholar]
- 35.Ponugoti B, et al. SIRT1 deacetylates and inhibits SREBP-1C activity in regulation of hepatic lipid metabolism. J Biol Chem. 2010;285(44):33959–33970. doi: 10.1074/jbc.M110.122978. [DOI] [PMC free article] [PubMed] [Google Scholar]
- 36.Pfluger PT, Herranz D, Velasco-Miguel S, Serrano M, Tschöp MH. Sirt1 protects against high-fat diet-induced metabolic damage. Proc Natl Acad Sci U S A. 2008;105(28):9793–9798. doi: 10.1073/pnas.0802917105. [DOI] [PMC free article] [PubMed] [Google Scholar]
- 37.Li Y, et al. Hepatic overexpression of SIRT1 in mice attenuates endoplasmic reticulum stress and insulin resistance in the liver. FASEB J. 2011;25(5):1664–1679. doi: 10.1096/fj.10-173492. [DOI] [PMC free article] [PubMed] [Google Scholar]
- 38.Lagouge M, et al. Resveratrol improves mitochondrial function and protects against metabolic disease by activating SIRT1 and PGC-1alpha. Cell. 2006;127(6):1109–1122. doi: 10.1016/j.cell.2006.11.013. [DOI] [PubMed] [Google Scholar]
- 39.Lustig Y, et al. Separation of the gluconeogenic and mitochondrial functions of PGC-1{alpha} through S6 kinase. Genes Dev. 2011;25(12):1232–1244. doi: 10.1101/gad.2054711. [DOI] [PMC free article] [PubMed] [Google Scholar]
- 40.Sharabi K, et al. Selective Chemical Inhibition of PGC-1α Gluconeogenic Activity Ameliorates Type 2 Diabetes. Cell. 2017;169(1):148–160.e15. doi: 10.1016/j.cell.2017.03.001. [DOI] [PMC free article] [PubMed] [Google Scholar]
- 41.Sinclair DA, Guarente L. Small-molecule allosteric activators of sirtuins. Annu Rev Pharmacol Toxicol. 2014;54:363–380. doi: 10.1146/annurev-pharmtox-010611-134657. [DOI] [PMC free article] [PubMed] [Google Scholar]
- 42.Choi SE, et al. Elevated microRNA-34a in obesity reduces NAD+ levels and SIRT1 activity by directly targeting NAMPT. Aging Cell. 2013;12(6):1062–1072. doi: 10.1111/acel.12135. [DOI] [PMC free article] [PubMed] [Google Scholar]
- 43.Lee J, et al. A pathway involving farnesoid X receptor and small heterodimer partner positively regulates hepatic sirtuin 1 levels via microRNA-34a inhibition. J Biol Chem. 2010;285(17):12604–12611. doi: 10.1074/jbc.M109.094524. [DOI] [PMC free article] [PubMed] [Google Scholar]
- 44.Baur JA, et al. Resveratrol improves health and survival of mice on a high-calorie diet. Nature. 2006;444(7117):337–342. doi: 10.1038/nature05354. [DOI] [PMC free article] [PubMed] [Google Scholar]
- 45.Brandstädt S, Schmeisser K, Zarse K, Ristow M. Lipid-lowering fibrates extend C. elegans lifespan in a NHR-49/PPARalpha-dependent manner. Aging (Albany NY) 2013;5(4):270–275. doi: 10.18632/aging.100548. [DOI] [PMC free article] [PubMed] [Google Scholar]
- 46.Chin RM, et al. The metabolite α-ketoglutarate extends lifespan by inhibiting ATP synthase and TOR. Nature. 2014;510(7505):397–401. doi: 10.1038/nature13264. [DOI] [PMC free article] [PubMed] [Google Scholar]
- 47.Iwamori N, Iwamori T, Matzuk MM. H3K27 demethylase, JMJD3, regulates fragmentation of spermatogonial cysts. PLoS One. 2013;8(8):e72689. doi: 10.1371/journal.pone.0072689. [DOI] [PMC free article] [PubMed] [Google Scholar]
- 48.Kim DH, et al. A dysregulated acetyl/SUMO switch of FXR promotes hepatic inflammation in obesity. EMBO J. 2015;34(2):184–199. doi: 10.15252/embj.201489527. [DOI] [PMC free article] [PubMed] [Google Scholar]
- 49.Kim DH, et al. Critical role of RanBP2-mediated SUMOylation of Small Heterodimer Partner in maintaining bile acid homeostasis. Nat Commun. 2016;7:12179. doi: 10.1038/ncomms12179. [DOI] [PMC free article] [PubMed] [Google Scholar]
- 50.Huang da W, Sherman BT, Lempicki RA. Bioinformatics enrichment tools: paths toward the comprehensive functional analysis of large gene lists. Nucleic Acids Res. 2009;37(1):1–13. doi: 10.1093/nar/gkn923. [DOI] [PMC free article] [PubMed] [Google Scholar]
- 51.Huang da W, Sherman BT, Lempicki RA. Systematic and integrative analysis of large gene lists using DAVID bioinformatics resources. Nat Protoc. 2009;4(1):44–57. doi: 10.1038/nprot.2008.211. [DOI] [PubMed] [Google Scholar]
- 52.Seok S, et al. Transcriptional regulation of autophagy by an FXR-CREB axis. Nature. 2014;516(7529):108–111. doi: 10.1038/nature13949. [DOI] [PMC free article] [PubMed] [Google Scholar]
Associated Data
This section collects any data citations, data availability statements, or supplementary materials included in this article.