

Abstract
Objective
Non-alcoholic fatty liver (NAFL) associated with obesity is a major cause of liver diseases which can progress to non-alcoholic steatohepatitis, cirrhosis, and hepatocellular carcinoma (HCC). Fibroblast growth factor 21 (FGF21) plays an important role in liver metabolism and is also a potential marker for NAFL. Here we aimed to test the effect of FGF21 deficiency on liver pathology in mice consuming a conventional high fat, high sucrose (HFHS) obesogenic diet for up to 52 weeks.
Methods
C57BL6 WT and FGF21 KO mice were fed a conventional obesogenic diet and were evaluated at 16 and 52 weeks. Evaluation included metabolic assessment, liver pathology, and transcriptomic analysis.
Results
With consumption of HFHS diet, FGF21 deficient mice (FGF21 KO) develop excess fatty liver within 16 weeks. Hepatic pathology progresses and at 52 weeks FGF21 KO mice show significantly worse fibrosis and 78% of mice develop HCC; in contrast only 6% of WT mice develop HCC. Well differentiated hepatocellular carcinomas in FGF21 KO mice were characterized by expanded hepatic plates, loss of reticulin network, cytologic atypia, and positive immunostaining for glutamine synthetase. Microarray analysis reveals enrichment of several fibroblast growth factor signaling pathways in the tumors.
Conclusions
In addition to attenuating inflammation and fibrosis in mice under a number of dietary challenges, we show here that FGF21 is required to limit the progression from NAFL to HCC in response to prolonged exposure to an obesogenic diet. The induction of hepatic FGF21 in response to the high fat, high sucrose obesogenic diet may play an important role in limiting progression of liver pathology from NAFL to HCC.
Keywords: Fibroblast growth factor 21, Hepatocellular carcinoma, Nonalcoholic fatty liver disease, Nonalcoholic steatohepatitis, High fat high sucrose diet, Liver fibrosis
Highlights
-
•
FGF21 deficiency in the context of a standard high, fat high sucrose, obesogenic diet increases liver pathology with rapid progression to NASH.
-
•
Hepatic pathology in FGF21 KO mice progresses to hepatocellular carcinoma.
-
•
Microarray analysis of the tumors reveals enrichment of several fibroblast growth factor signaling pathways.
-
•
Results noted here are similar to increased rates of progressive NAFLD in obese populations consuming Western style diets.
1. Introduction
Multiple lines of evidence indicate that fibroblast growth factor 21 (FGF21) plays an important role in liver metabolism. FGF21 was originally identified as an endocrine member of the fibroblast growth factor family as it can be released into the circulation [1]. FGF21 was initially assigned a purely metabolic role as infusions led to weight loss and increased glucose clearance through induced expression of the GLUT1 transporter. However, FGF21 biology is now understood to be extremely complex, as FGF21 is expressed in many metabolically active tissues including, liver, white (WAT) and brown adipose tissue (BAT), muscle, and pancreas. Functions of FGF21 are distinct in all these tissues [2].
In mice, multiple manipulations lead to a significant increase in FGF21 levels, including fasting and consumption of a ketogenic diet [3], [4], protein insufficiency, and amino acid deprivation [5]. When mice are fed a high fat diet or a lipotoxic methionine-choline deficient diet, hepatic FGF21 expression rises dramatically and mice lacking FGF21 develop significantly worse hepatotoxicity as assessed by inflammation and fibrosis [6], [7], [8]. Similar liver pathologies are seen with high fructose diets [9], dietary ethanol [10], acetaminophen overdose [11], and after partial hepatectomy and CCl4 administration [12]; hepatic expression of FGF21 rises in wild type mice with these stimuli, and absence of FGF21 leads to significantly worsened pathology while overexpression is protective. Taken together these data suggest that FGF21 has important effects to limit hepatic toxicity in response to a variety of stimuli.
Understanding of integrated FGF21 physiology is complex and challenging. Circulating FGF21 levels rise with obesity and likely reflect increased hepatic lipid accumulation in humans [13], [14], [15], [16]. Regulation of FGF21 expression and levels may differ between rodents and humans. Unlike rodents, in humans, circulating FGF21 is not induced by either short term fasting or consumption of ketogenic diets [17], although two studies of extreme fasting (7–10 days) showed increase in circulating FGF21 in humans [18], [19]. However, acute consumption of both fructose and alcohol markedly increase serum FGF21 levels, with a time course similar in rodents and humans [9], [10], [20]. These data suggest that FGF21 may play a regulatory role in human liver pathology.
The accumulation of excess triglycerides, which characterizes NAFLD, is a common complication of obesity with a prevalence of up to 53% in morbidly obese populations [21], [22]. While in itself benign, fatty liver can progress to non-alcoholic steatohepatitis (NASH) in 10-20% of individuals, which is characterized by apoptosis, inflammation, and fibrosis. Progression to NASH increases the risk of further deterioration to cirrhosis and hepatocellular carcinoma (HCC). However progression is unpredictable in any given individual and no risk factors predisposing to this progression have been identified.
Studies to date suggest that FGF21 plays a protective role in mice challenged with a variety of diets. However, diets studied thus far are not physiologically representative of human diets that lead to NAFL. To evaluate the effects of a diet that mimics the composition of Western diets that contribute to human obesity, and thus to fatty liver, we examined the long-term consequences of consumption of an obesogenic, high fat, high sugar diet (HFHS). We speculated that such a diet would lead to significantly more pathology in mice lacking FGF21 compared to wild type animals. Indeed, mice lacking FGF21 and consuming the HFHS diet developed more severe steatosis at 16 weeks. With ongoing consumption of this diet, NAFL ultimately progressed to HCC in a high percentage of FGF21 deficient, but not wild-type mice. Microarray analysis revealed involvement of aberrant fibroblast growth factor signaling in tumors.
These data reveal for the first time that FGF21 plays a critical role in the progression of liver disease from the early and relatively benign state of lipid accumulation to the development of neoplastic hepatocellular lesions. FGF21 is known to be hepatoprotective in the context of several short term hepatic stresses. Here we show that FGF21 is also required to protect the liver long term. FGF21 has potential as a therapeutic agent against obesity-related progression of NAFLD, and these results suggest it may also provide benefits against more severe complications such as HCC. These potential benefits of FGF21 in liver disease are currently being evaluated in humans [23], [24].
2. Materials and methods
2.1. Animals
All experiments were carried out using male WT and FGF21 deficient (FGF21 KO) mice, originally generated at Lilly Research Laboratories, Indianapolis, Indiana, by a targeted disruption of the FGF21 locus, as previously described [4]. These mice have had more than 10 back-crosses to C57BL/6 mice from Jackson labs. Mice were maintained on a 12:12-hr light–dark cycle and an ambient temperature of 22 °C ± 2 °C. Colonies are maintained as het X het breedings. For chronic high-fat feeding studies, WT and FGF21 KO male mice (age 8–10 weeks) were fed either standard laboratory chow (5008; Lab Diet, St Louis, MO) or a commonly used obesogenic diet (D12451; fat calories 45%, sucrose calories 17%; Research Diets, New Brunswick, NJ). Mice were allowed ad libitum access to food unless otherwise stated. Body weights were recorded weekly. Blood was collected for measurement of glucose and serum analysis at the time of sacrifice at either 16 or 52 weeks. Livers were harvested, weighed, snap-frozen in liquid nitrogen, and stored at −80 °C until further molecular/biochemical analysis and a segment of liver was saved for histology. All procedures were performed in accordance with National Institute of Health Guidelines for the Care and Use of Animals and were approved by the Beth Israel Deaconess Medical Center Institutional Animal Care and Use Committee.
2.2. Histological analysis
Livers were fixed in 10% formalin at 4 °C overnight. Paraffin embedding and sectioning was performed by the Histology Core at Beth Israel Deaconess Medical Center. 5 μM sections were stained with hematoxylin and eosin to assess the liver architecture and histology and Sirius Red to assess fibrosis. Reticulin/Nuclear Fast Red Stain Kit (AR17992-2, Dako, Santa Clara, CA) was used to assess the tumor fiber network. Slides were analyzed by two experienced liver pathologists in a blinded fashion (HGV and IAN). Slides were graded based on the NAFLD Activity Score (NAS) [25], which looks at the degree of steatosis, inflammation, and ballooning, as well as the METAVIR score [26], which assesses the degree of fibrosis.
2.3. Hepatic tissue analysis
Liver triglycerides were extracted using a modified Folch method [27]. Briefly, liver tissues were homogenized in chloroform:methanol (2:1) and incubated overnight at room temperature. 0.9% saline was added and each sample was centrifuged for 10min. The organic phase was removed, vacuum dried, and resuspended in butanol:Triton X:methanol solution. Triglycerides (StanBio Laboratory, Boerne, TX), free cholesterol (StanBio Laboratory, Boerne, TX), and nonesterified fatty acid content (Wako Diagnostics, Richmond, VA) were determined using colorimetric assays and normalized to the weight of the liver.
2.4. Measurement of serum markers
Blood was allowed to clot, and supernatant was collected after centrifugation at 4 °C. Serum FGF21 levels were determined using a Rat/Mouse FGF-21 ELISA kit (R&D Systems, Minneapolis MN), according to the manufacturer's instructions. α-Feto protein/AFP was measured using a mouse Quantikine ELISA Kit (R&D Systems, Minneapolis MN). Alanine aminotransferase (ALT) (Pointe Scientific, Canton MI), aspartate aminotransferase (AST) (Pointe Scientific, Canton MI), triglycerides, total cholesterol (StanBio Laboratory, Boerne, TX) and nonesterified fatty acids (Wako Diagnostics, Richmond, VA) were measured in duplicate using enzyme colorimetric assays as per the directions provided by each manufacturer.
2.5. Immunohistochemical staining
Slides were deparaffinized with xylene and hydrated through an ethanol gradient and rinsed with phosphate-buffered saline (PBS). Antigen was retrieved by citric acid buffer (pH 6.0). Sections were subsequently treated with 0.3% H2O2 and washed by tris-buffered saline containing 1% Tween 20 (TBST) for 15 min followed by a 60 min blocking with normal goat serum (Vector Laboratories, Burlingame, CA). Slides were incubated with glutamine synthetase, primary antibody (1:100) (ab73593, Abcam, Cambridge, MA) overnight at 4 °C. Slides were washed and incubated with a secondary antibody (1:1000, 1 h) at RT, washed again with PBS and were incubated in Avidin–Biotin Complex (ABC) diluted 1:500 (Vectastain Elite ABC kit; Vector Labs) in PBS for 30 min, and rinsed in PBS. The sections were exposed to diaminobenzidine (DAB Peroxidase substrate kit; Vector Labs) for 30 s. The reaction was quenched by submerging the sections in double distilled water after which slides were counterstained with hematoxylin. Stained sections were mounted on SuperFrost Plus slides (Fisher Scientific, Waltham, MA), air-dried, dehydrated in increasing concentrations of ethanol (50%, 70%, 95%, 100%), cleared overnight in xylene, after which cover slips were applied. Slides were mounted and analyzed sections were imaged with an Olympus VS110 slide scanning microscope.
2.6. Microarray hybridization and data analysis protocol
Hybridization, washing, and scanning of Affymetrix GeneChip Mouse Gene 1.1 ST arrays were performed according to standard Affymetrix protocols (Clariom™ D Assay, # 902513). Data obtained from Affymetrix gene chip was evaluated in R/Bioconductor (http://www.r-project.org) using ‘limma’, ‘oligo’ and ‘OneChannelGUI’ packages. The raw data was log2 transformed and Robust Mutliarray Average (RMA) normalized to the intensity data between the samples. The differentially expressed genes were identified on the basis of Benjamini-Hochberg (BH) multiple test adjusted P values (i.e. False Discovery Rate (FDR) < 0.05) and fold changes (less or more than 1.5).
Heat maps were created on the z-score-normalized probe signal using the R/Bioconductor function ‘hclust’ from the ‘heatmap3’ package. PCA was done using the R/Bioconductor function ‘princomp’ also applied to Z-score normalized expression data.
Functional annotations of the differentially expressed genes were performed using MetaCore™ (GeneGo database, Encinitas, CA) to identify the pathways that are significantly affected in different pairwise comparisons (i.e. Tumor vs. KO, and Tumor vs. WT). The knowledge base of this software consists of functions, pathways and network models derived by systematically exploring the peer reviewed scientific literature [28].
2.7. cDNA synthesis and real-time quantitative PCR
Microarray data was validated by real-time quantitative PCR (Q-PCR). Total RNA was isolated using the RNeasy Lipid Tissue Kit (Qiagen); DNA digestion step was included to prevent contamination of genomic DNA. Complementary DNA was synthesized from 0.5 μg of RNA using a mixture of oligo (dT) and random hexamer primers with Quantiscript Reverse Transcriptase (QuantiTect Reverse Transcription Kit; Qiagen). Quantitative polymerase chain reaction was performed using a 7800HT thermal cycler (Applied Biosystems, Foster City, CA) and SYBR green master mix (Applied Biosystems). Primers were designed using Primer3 online software (Open Source) and obtained from Invitrogen (Carlsbad, CA). Primer sequences are available on request.
2.8. Statistical analysis
Data were analyzed with GraphPad Prism (La Jolla, CA) 5.04. Single point measures for two-way studies were analyzed using a two-way ANOVA followed by Bonferroni's post-hoc test for individual comparisons where appropriate. Single point measures for one-way studies were analyzed using a two-tailed unpaired t-test. Significance is designated by asterisks with *P < 0.05, **P < 0.01, ***P < 0.001, ****P < 0.0001, or designated by symbols where means that do not share a common symbol are significantly different from each other at P < 0.01. Data are displayed as the mean ± Standard error of the mean (SEM).
3. Results
3.1. FGF21 KO mice show increased liver pathology when consuming an obesogenic diet for 16 weeks
WT and FGF21 KO mice consuming HFHS diet gain similar body weight and had similar glucose tolerance and insulin sensitivity at 16 weeks [29]. Serum triglycerides and cholesterol levels were also similar between WT and FGF21 KO mice (Table 1). An approximately 10 fold increase in serum FGF21 (Figure 1A, WT-Chow: 236.2 ± 44.3 pg/ml; WT-HFHS: 2055 ± 148 pg/ml; p < 0.0001) and hepatic expression of FGF21 (Figure 1B, WT-Chow: 1 ± 0.33 AU; WT-HFHS: 10.1 ± 1.11 AU; p < 0.0001) was observed in the WT mice fed with HFHS compared to chow fed counterparts (Figure 1A,B).
Table 1.
Circulating Metabolic Parameters of WT and FGF21 KO mice fed with HFHS for 16 weeks and 52 weeks. Data represented as Mean ± SEM; n = 6–8 mice/group (16 weeks), 12–14 mice/group (52 weeks). Significance was determined with a two-tailed unpaired student t-test. Significance is designated by asterisks with *P < 0.05,**P < 0.01,***P < 0.001,****P < 0.0001.
| Metabolite | 16 weeks |
52 weeks |
||
|---|---|---|---|---|
| WT | FGF21KO | WT | FGF21 KO | |
| Triglycerides (mg/dL) | 93.54 ± 5.50 | 89.47 ± 3.54 | 84.14 ± 2.07 | 105.90 ± 18.03 |
| Cholesterol (mg/dL) | 118.20 ± 2.90 | 129.30 ± 6.87 | 125.20 ± 7.50 | 129.60 ± 13.30 |
| Glucose (mg/dL) | 192.30 ± 8.60 | 183.40 ± 15.57 | 175.5 ± 11.40 | 168.80 ± 4.90 |
Figure 1.

High fat high sucrose diet consumption for 16 weeks leads to development of NAFLD in FGF21-KO mice. Serum FGF21 protein (A) and hepatic mRNA (B) is increased in WT mice fed with HFHS for 16 weeks compared to chow fed WT counterparts. Hematoxylin & Eosin staining of liver sections demonstrate relatively normal histology in WT mice consuming the HFHS diet (C i). Significant steatosis is observed in FGF21 KO mice (C ii). Double blind histopathological scoring confirms the excess liver steatosis in FGF21 KO HFHS fed mice, without significant changes in inflammation, ballooning, and fibrosis (D). In addition, FGF21 KO HFHS fed mice have higher liver/body weight ratio compared to all other groups (E). Triglycerides accumulation is also higher in these mice. WT-chow fed mice accumulates least amount of triglycerides in the liver (F). Data represented as Mean ± SEM; n = 6–8 mice/group. Significance in (A), (B), and (D) was determined with a two-tailed unpaired student t-test. Significance in (E) and (F) was determined with a two-way ANOVA and Bonferroni's post-hoc analysis test for individual comparisons. Significance is designated by symbols that do not share a common symbol are significantly different from each other at P < 0.01. Significance is designated by asterisks with *P < 0.05, **P < 0.01, ***P < 0.001, ****P < 0.0001. Scale: 50 μm (C).
Liver sections were evaluated by microscopy for histological features of steatosis, inflammation, ballooning, and fibrosis. WT and FGF21 KO mice fed with chow diet maintained normal liver histology. When fed a HFHS diet, WT mice show significantly less accumulation of hepatic lipids compared to FGF21 KO mice (Figure 1C i-ii) as scored by a pathologist blinded to sample identity (Figure 1D, WT-HFHS: 1 ± 0.25; FGF21 KO-HFHS: 2.7 ± 0.28; p = 0.001). Inflammation, ballooning and fibrosis were not different in WT and FGF21 KO mice fed with HFHS. Liver to body weight ratio was significantly higher in FGF21 KO-HFHS fed mice compared to all other groups (Figure 1E). Quantitative measurement of hepatic lipid accumulation confirmed the histopathological observations by showing highest levels of triglycerides in FGF21 KO mice fed with HFHS (Figure 1F).
3.2. After 52 weeks of consumption of a HFHS, FGF21 KO mice have worse fibrosis than WT animals and also develop hepatocellular carcinoma
At 52 weeks of chow feeding, liver histology of WT mice remained normal with the presence lobular structure. Healthy hepatocytes arranged in plates have very little or no lipid accumulation. The separation between the hepatocytes plates by sinusoidal capillaries is visible (Figure 2A i, B); in contrast FGF21 KO mice showed significantly more liver lipid accumulation (Figure 2 iii, B). Neither chow fed WT nor FGF21 KO animals had any signs of hepatic fibrosis as assessed by Sirius red staining (Figure 2 v, vii, D). Both WT and FGF21 KO mice consuming the HFHS diet had similar body weights (data not shown) at 52 weeks and both had macrovesicular and microvesicular steatosis (Figure 2A ii, iv, B). Increased hepatic fat was confirmed by quantification of hepatic triglyceride and cholesterol (Supplementary Figure 2A and B). Other parameters of the NAFLD activity score (NAS) such as inflammation and ballooning were also similar in WT and FGF21 KO mice fed with HFHS (Figure 2C,D). However, bridging sinusoidal fibrosis, as assessed by Sirius Red staining was significantly higher in FGF21 KO mice compared to the WT mice (Figure 2 vi, viii, E; WT-HFHS: 1.54 ± 0.19; FGF21 KO-HFHS: 2.58 ± 0.23; p = 0.003). At the expression level, profiling of inflammation and fibrosis markers was similar (Supplementary Figure 2C). Comparable serum triglycerides and cholesterol levels noted between WT and FGF21 KO mice are shown in Table 1.
Figure 2.

Chronic consumption of HFHS obesogenic diet for 52 weeks leads to the worse fibrosis in FGF21 KO mice. Liver sections of WT and FGF21 KO mice fed either with chow or HFHS for 52 weeks demonstrate that WT mice consuming chow maintain normal histology and fibrosis (A i, v, B-E). Significantly higher steatosis, ballooning, and fibrosis is observed in WT mice consuming HFHS diet (A ii, vi, B-E). FGF21 KO mice fed with chow also accumulate significant hepatic lipids as shown by steatosis (A iii); however, other parameters of hepatic injury are not elevated (A vii, B-E). FGF21 KO mice fed with HFHS demonstrate severe steatosis and ballooning (A iv), comparable to the WT mice on the same diet (B, D). However, FGF21 KO mice have a worse fibrotic score compared to all other groups (A viii, E). Double blind histopathological scoring confirms the observations. Data represented as Mean ± SEM; n = 12–14 mice/group. Significance in (B), (C), (D), and (E) was determined with a two-way ANOVA and Bonferroni's post-hoc analysis test for individual comparisons. Significance is designated by symbols that do not share a common symbol are significantly different from each other at P < 0.01. Scale: 100 μm (A i-viii).
WT and FGF21 KO mice consuming HFHS diet maintained similar body weights during the entire course of the study (Supplementary Figure 1). Liver to body ratio in FGF21 KO mice was slightly higher in HFHS group compared to other groups (Figure 3A); however, the difference was not statistically significant. Serum FGF21 levels in WT mice consuming HFHS diet remained elevated compared to chow fed animals (Figure 3B; WT-Chow: 439 ± 103 pg/ml; WT-HFHS: 3075 ± 1115 pg/ml; p = 0.03). Serum AFP levels of WT and FGF21 KO mice were similar at 16 and 30 weeks, however a significant elevation was noted in FGF21 KO-HFHS fed mice at 52 weeks (Figure 3C). Serum alanine and aspartate transaminases, very common and reliable markers for liver injury, were also significantly elevated in these mice (Figure 3D,E).
Figure 3.

FGF21 KO mice spontaneously develop HCC with chronic consumption of HFHS for 52 weeks. FGF21 KO mice fed with HFHS diet have slightly higher liver/body weight ratio compared to all other groups (A). FGF21 serum levels are increased in WT mice fed with HFHS compared to chow fed WT counterparts (B). Serum levels of α-feto protein are increased in FGF21 KO HFHS fed mice at 52 weeks (C). Liver function enzymes alanine aminotransferase (ALT) (D) and aspartate aminotransferase (AST) (E) are also elevated in FGF21 KO mice at 52 weeks with HFHS consumption. Representative gross liver images from WT and FGF21 KO mice fed with HFHS demonstrate the presence of tumor nodules in FGF21 deficient mice (F). The tumor incidence is 78% in FGF21 KO mice compared to 6% incidence in WT mice (G). In addition, various histological features of tumors are shown such as solid tumor with a clear margin with a non-tumor area, and absence of fat deposition in tumors can be seen (H i), presence of cystic component in the tumor area (H ii) and cells inside the tumor nodules demonstrate the presence of well differentiated HCC (H iii). Data represented as Mean ± SEM; n = 12–14 mice/group. Significance in (B) and (C) was determined with a two-tailed unpaired student t-test. Significance in (A), (D), and (E) was determined with a two-way ANOVA and Bonferroni's post-hoc analysis test for individual comparisons. Significance is designated by symbols that do not share a common symbol are significantly different from each other at P < 0.01. Significance is designated by asterisks with *P < 0.05, **P < 0.01, ***P < 0.001, ****P < 0.0001. Scale: 500 μm (H i-ii), 100 μm (H iii).
1-3 large liver nodules (>5 mm) were seen in 78% of FGF21 KO (11/14) mice consuming HFHS diet; only 1 of 15 mice WT mice developed a hepatic nodule (Figure 3F,G). None of the chow fed mice developed liver nodules. Histological characterization of nodules revealed the presence of well differentiated hepatocellular carcinoma as seen in several representative images of tumor sections (Figure 3H). There is a clear margin between tumor and non-tumor area (i), cystic component of the tumor area (ii), and tumor cellular architecture (iii). Tumor nodules were almost completely devoid of fat accumulation.
Serum AFP correlated well with the development of HCC. AFP levels were lower in mice that did not develop HCC (3/14 mice). Gross evaluation for presence of tumors outside the livers, including small and large intestine, pancreas, and lung, was performed at the time of euthanasia. A lung tumor was noted in one FGF21KO mouse and this animal was excluded from the study.
3.3. Characterization of hepatocellular carcinoma
Staining for reticulin and glutamine synthetase was used to distinguish between well differentiated HCC and other hepatic nodules [30]. Reticulin fibers, which are type III collagen bundles, are usually present between the hepatocytes. Loss of reticulin fibers is a hallmark feature of HCC which leads to widening of trabeculae. We observed an intact reticular fiber network in WT-HFHS fed mice (Figure 4 Ai) while in FGF21 KO mice, a normal reticulin network was seen in non-tumor areas. In tumor nodules loss of reticulin network and widening of trabecule was seen (Figure 4 Aii). Glutamine synthetase stains the perivenular hepatocytes in normal liver, as seen in WT-HFHS mice (Figure 4B i) while it is upregulated in HCC and tumor nodules [31] as can be seen in tumors derived from FGF21 KO mice fed with HFHS. A very clear margin between the tumor and surrounding tissue was observed (Figure 4B ii).
Figure 4.

Characterization of hepatocellular carcinoma by double staining. Liver sections of WT and FGF21 KO mice fed with HFHS for 52 weeks stained for reticulin network is shown (A). WT mice demonstrate intact reticulin fibers in between the hepatocytes (A i). Tumor nodules from FGF21 KO mice show the loss of reticulin network (A ii). Increased trabecular thickness confirms the presence of hepatocellular carcinoma. Glutamine synthetase staining demonstrate the positive staining around perivenular hepatocytes (B i) while tumor nodules show very diffuse staining in the entire tumor nodule (B ii). A clear margin between positively stained tumor nodules and negatively stained adjacent non tumor tissue is visible. Scale: 100 μm (A i-ii), 200 μm (B i-ii).
3.4. Transcriptomic Profiling of tumors by microarray analysis and validation by qPCR
Transcriptomic expression analysis using microarray profiling was performed to identify differentially expressed genes (DEGs) and/or altered pathways potentially involved in tumor development. Liver samples from mice fed with HFHS were analyzed. We compared the liver samples in 3 different groups – WT mice, non-tumor (NT) tissue from FGF21 KO mice and tumor tissue. Heat map visualization of the hepatic transcriptome from all three groups illustrates distinct differences (Figure 5A). The distinct gene expression profile was further confirmed by principal component analysis (not shown). Similarity in gene expression signatures from WT and FGF21 KO non tumor area within each experimental group was noted (Figure 5A) and therefore these two groups did not show any significant differentially expressed genes between them. Analysis of tumor tissue to adjacent non tumor (NT) tissue led to the identification of a total number of 438 differentially expressed genes (Figure 5B). Scatter plot is presented with DEGs including 373 up-regulated genes, 65 down-regulated genes. The top 10 enriched biological pathways of the DEGs between non tumor and tumor tissues according to P value are shown (Figure 5C, Table 2). Enriched pathways include the biological process of protein folding and maturation, developmental FGF signaling pathways, FGF signaling pathways in cancer, signal transduction, and mTOR downstream pathways.
Figure 5.

Transcriptomic Profiling of tumors by Microarray analysis. Transcriptome analysis was performed on liver tissues from WT- HFHS fed mice, non-tumor area from FGF21 KO - HFHS fed mice and tumor nodules. The data are presented as: (A) Heat map demonstrating deregulated genes. Color intensity indicate high and low gene expression, respectively; (B) Scatter plot and (C) Gene ontology (GO) processes. The top rank ordered processes, maps, and networks are based on statistical significance. Data are represented as fold change; n = 9 mice/group for WT and FGF21 KO non-tumor tissue, n = 6 mice/group for tumor.
Table 2.
The top 10 enriched Gene Ontology terms of Differentially Expressed Genes (DEGs), sorted by P value in ascending order. On the basis of DEGs, the network analysis identified the modulated pathways are listed. All the genes are upregulated. The most commonly activated targetable genes are associated with FGF signaling pathways.
| # | Maps | Total | p-value | FDR | In Data | Network Objects from Active Data |
|---|---|---|---|---|---|---|
| 1 | Protein folding and maturation_POMC processing | 30 | 7.737E-21 | 3.474E-18 | 16 | CLIP, ACTH, alpha-MSH beta-Endorphin extracellular region, proACTH, POMC, N-POMC, gamma-MSH, N-POC, beta-LPH, gamma-LPH, ACTH 1-17, DA-alphaMSH, gamma2-MSH, gamma3-MSK beta-MSH |
| 2 | Development_FGF-family signaling | 52 | 1.569E-09 | 3.522E-07 | 11 | FGF2, FGF8, FGF9, FGF3, FGF7, FGF10, FGF6, FGF 19, FGFR1, FGF1, FGF4 |
| 3 | Neurophysiological process_Receptor-mediated axon growth repulsion | 46 | 1.650E-05 | 1.853E-03 | 7 | PlexinA2, Ephexin, F-Actin cytoskeleton, Fer, c-Fes, Plexin A1, Actin cytoskeletal |
| 4 | FGF signaling in pancreatic cancer | 46 | 1.650E-05 | 1.853E-03 | 7 | FGF2, FGF7, FGF5, FGF10, FGFR1, HBP17, FGF1 |
| 5 | Signal transduction_mTORC1 downstream signaling | 61 | 7.790E-04 | 6.996E-02 | 6 | 4E-BP2, CLIP170, 4E-BP1, LIPIN1, elF4A, elF4E |
| 6 | Development_Growth factors in regulation of oligodendrocyte precursor cell proliferation | 67 | 1.281 E-03 | 9.584E-02 | 6 | FGF2, FGF8, FGF18, FGF17, FGFR1, mTOR |
| 7 | Cytoskeleton remodeling_Reverse signaling by Ephrin-B | 32 | 2.494E-03 | 1.578E-01 | 4 | SDF-1, FAP-1, Actin cytoskeletal, F-Actin |
| 8 | Translation_Regulation of EIF4F activity | 54 | 2.812E-03 | 1.578E-01 | 5 | 4E-BP1, elF4A, elF4E, mTOR, elF4G2 |
| 9 | Androgen receptor activation and downstream signaling in Prostate cancer | 110 | 3.727E-03 | 1.859E-01 | 7 | FGF2, FGF8, SPRY2, ESR2, FGFR1, FEN1, FGF1 |
| 10 | Development_Mu-type opioid receptor signaling | 38 | 4.706E-03 | 1.951E-01 | 4 | 4E-BP2, beta-Endorphin extracellular region, 4E-BP1, mTOR |
The comparison between WT liver and tumor tissues was also performed. The scatter plot generated for these comparisons is presented in Supplementary Figure 3A. The top 10 enriched biological pathways of the DEGs from WT and tumor samples are shown in Supplementary Figure 3B.
Quantitative PCR was used to validate the results from microarray analysis. Overlapping genes between FGF signaling pathways and among top 20 upregulated genes were selected. We found 4 such genes; FGF7, FGF12, FGF4, FGFBP1. All of them were significantly elevated in tumor tissues compared to other groups (Figure 6A–D).
Figure 6.

Validation of microarray data by quantitative PCR. The gene expression levels of Fibroblast growth factor ligands 7, 12, 4, and binding protein 1 are shown to be significantly upregulated in tumor samples (A–D). Data represented as Mean ± SEM; n = 6–12 mice/group. Significance was determined with a two-way ANOVA and Bonferroni's post-hoc analysis test for individual comparisons. Significance is designated by symbols that do not share a common symbol are significantly different from each other at P < 0.01.
4. Discussion
In the United States, the incidence of hepatocellular carcinoma has almost tripled in the last 3 decades, making it the fastest rising cause of cancer-related deaths [32], [33]. Some of the known risk factors include viral hepatitis, ethanol consumption and increasingly NAFLD resulting from obesity and the metabolic syndrome [34], [35], [36], [37]. As obesity now affects up to 30% of the general adult population in Western countries [21], [22], it has become a major risk factor for liver disease. In addition, a strong association of Type 2 diabetes with increased risk of development and progression of HCC has been reported in many epidemiological studies [38], [39].
Variation in a limited number of genes, such as patatin-like phospholipase (PNPLA3) and transmembrane 6 superfamily member 2 (TM6SF2), have been linked to an increased susceptibility to NAFLD [40], [41]. However, genetic information concerning the predisposition of NAFLD and its progression to HCC is limited and inconsistent. Furthermore while activation of a number of pathways has been implicated in the development of HCC [42], [43], the mechanisms contributing to the progression of fatty liver to carcinoma are poorly understood. A genome wide expression profiling study of formalin-fixed, paraffin-embedded tissues from humans identified a gene-expression signature correlating with survival in patients with hepatocellular carcinoma [44]. Some of the genes correlating with good survival in HCC patients, such as ACSM3 and IMPA1, were found to be enriched in FGF21 KO tumor samples compared to the non-tumor adjacent tissue. In general however our gene ontology analysis revealed that the top 10 dysregulated pathways in tumor tissues involved FGF signaling pathways.
Altered expression of genes, including the FGF ligands 7, 12, 4, and FGF binding protein 1 were among the top 20 upregulated genes in FGF21 KO tumor samples. There are multiple reports of upregulation of FGF ligands, their receptors and regulatory molecules in different types of cancers, and FGF pathways have been implicated in HCC [45], [46]. There are also reports of aberrant FGF15/19 and FGFR4 signaling pathways in HCC development in mice [47]. However, we did not observe a significant rise in hepatic expression of either FGF receptor 4 or its ligand FGF15 in obese FGF21 KO mice. Knowledge about the significance of these upregulated FGF pathways is quite limited. FGF7 is expressed by hepatic stellate cells and is reported to be involved in liver regeneration via paracrine signaling in hepatocytes [48], [49]. The potential functions of FGF4 and FGF12 are not well characterized in liver tumorogenesis. FGF binding proteins are important regulators of FGF signaling, as they mobilize and activate locally stored FGFs; increased expression of FGFBPs have been implicated in FGF signaling [50], [51]. There is increasing interest in anti-fibroblast growth factor (FGF) therapy in HCC, based on evidence that FGF signaling may contribute to HCC progression [52], [53]. Unsurprisingly, in vitro models exhibiting FGFR amplification respond more favorably to FGFR directed therapies [54].
In contrast to FGF pathways, in which excess may promote the development of HCC, it is the absence of FGF21 that has harmful effects on the liver in this study. There are precedents for this phenomenon. In addition to its role as an important regulator of hepatic metabolism, FGF21 attenuates hepatic pathology in response to a number of nutritional and chemical stimuli, including ketogenic diet, methionine and choline deficient diet, high fat diet, high fructose diet, ethanol supplemented diet and diethynitrosamine [4], [6], [8], [9], [10], [12].
FGF21 has been previously linked to the potential for developing HCC [8], [55]. While Liu et al. showed that FGF21 deficiency creates an microenvironment that would be expected to support HCC, liver histology was not evaluated nor was any evidence of development of HCC presented in these mice [8]. Zhang et al. showed a reduction in FGF21 in OVE26 mice, a genetic model of diabetes treated with diethylnitrosamine, but a direct link between FGF21 and HCC was not demonstrated [55]. Thus, ours is the first direct demonstration that lack of FGF21 promotes the development of HCC.
Our findings extend the adverse effects of FGF21 deficiency to long term consumption of a standard obesogenic “Western style” diet. Consistent with the emerging evidence that FGF21 is a key protective element in mice under a variety of challenges, mice lacking FGF21 had more severe fibrosis and most importantly, developed HCC with a very high prevalence. Interestingly while HCC usually develops in the context of cirrhosis, irrespective of the etiology, a link to cirrhosis was not observed in our model. This is consistent with an increasing number of reports that HCC can occur in the absence of cirrhosis [56], [57], [58].
In conclusion, we have demonstrated for the first time that in mice exposed long term to an obesogenic diet, deficiency of FGF21 promotes the progression of NAFLD to HCC, the most lethal complication of this disorder. These findings further enhance the potential for FGF21-based therapeutics that are already being explored in humans as agents to limit the progression of NAFLD/NASH, to now include limiting progression of NAFLD/NASH to HCC. The molecular details by which FGF21 signaling may limit NAFLD associated HCC requires further exploration.
Acknowledgements
This work was supported by National Institutes of Health Grant R01 DK028082-035 (EMF, JSF). We are also thankful to HDDC core B at BIDMC for providing technical support. We thank Andrew Charles Adams, Director, Diabetes Innovation, Lilly Research Laboratories, Indianapolis, Indiana for providing the FGF21 KO mice. We also thank John G. Clohessy, Director, Preclinical Murine Pharmacogenetics Facility, at BIDMC for his scientific contributions.
Footnotes
Supplementary data related to this article can be found at https://doi.org/10.1016/j.molmet.2018.03.002.
Conflict of interest
The authors have nothing to disclose.
Appendix A. Supplementary data
The following are the supplementary data related to this article:
Supplementary Figure 1.
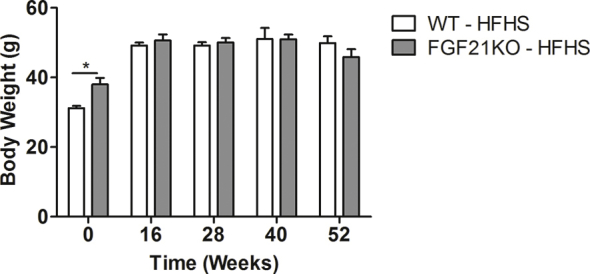
WT and FGF21 KO mice consuming HFHS maintain similar body weight up to 52 weeks.
Supplementary Figure 2.

Triglycerides (A) and cholesterol (B) accumulation is not statistically different in all 4 cohorts of mice, WT and FGF21 KO fed either with chow or HFHS for 52 weeks. Gene expression profile of fibrosis and inflammation genes is shown (C).
Supplementary Figure 3.

Transcriptomic analysis of liver tissues from tumor area from FGF21 KO and WT -HFHS fed mice (n = 9). The data are presented as: (A) volcano plot; (C) Gene ontology (GO) processes. The top rank ordered processes, maps and networks are based on statistical significance.
References
- 1.Kharitonenkov A., Shiyanova T.L., Koester A., Ford A.M., Micanovic R., Galbreath E.J. FGF-21 as a novel metabolic regulator. The Journal of Clinical Investigation. 2005;115:1627–1635. doi: 10.1172/JCI23606. [DOI] [PMC free article] [PubMed] [Google Scholar]
- 2.Fisher F.M., Maratos-Flier E. Understanding the physiology of FGF21. Annual Review of Physiology. 2016;78:223–241. doi: 10.1146/annurev-physiol-021115-105339. [DOI] [PubMed] [Google Scholar]
- 3.Badman M.K., Pissios P., Kennedy A.R., Koukos G., Flier J.S., Maratos-Flier E. Hepatic fibroblast growth factor 21 is regulated by PPARalpha and is a key mediator of hepatic lipid metabolism in ketotic states. Cell Metabolism. 2007;5:426–437. doi: 10.1016/j.cmet.2007.05.002. [DOI] [PubMed] [Google Scholar]
- 4.Badman M.K., Koester A., Flier J.S., Kharitonenkov A., Maratos-Flier E. Fibroblast growth factor 21-deficient mice demonstrate impaired adaptation to ketosis. Endocrinology. 2009;150:4931–4940. doi: 10.1210/en.2009-0532. [DOI] [PMC free article] [PubMed] [Google Scholar]
- 5.Laeger T., Henagan T.M., Albarado D.C., Redman L.M., Bray G.A., Noland R.C. FGF21 is an endocrine signal of protein restriction. The Journal of Clinical Investigation. 2014;124:3913–3922. doi: 10.1172/JCI74915. [DOI] [PMC free article] [PubMed] [Google Scholar]
- 6.Fisher F.M., Chui P.C., Nasser I.A., Popov Y., Cunniff J.C., Lundasen T. Fibroblast growth factor 21 limits lipotoxicity by promoting hepatic fatty acid activation in mice on methionine and choline-deficient diets. Gastroenterology. 2014;147 doi: 10.1053/j.gastro.2014.07.044. 1073–1083 e6. [DOI] [PMC free article] [PubMed] [Google Scholar]
- 7.Tanaka N., Takahashi S., Zhang Y., Krausz K.W., Smith P.B., Patterson A.D. Role of fibroblast growth factor 21 in the early stage of NASH induced by methionine- and choline-deficient diet. Biochimica et Biophysica Acta. 2015;1852:1242–1252. doi: 10.1016/j.bbadis.2015.02.012. [DOI] [PMC free article] [PubMed] [Google Scholar]
- 8.Liu X., Zhang P., Martin R.C., Cui G., Wang G., Tan Y. Lack of fibroblast growth factor 21 accelerates metabolic liver injury characterized by steatohepatities in mice. American Journal of Cancer Research. 2016;6:1011–1025. [PMC free article] [PubMed] [Google Scholar]
- 9.Fisher F.M., Kim M., Doridot L., Cunniff J.C., Parker T.S., Levine D.M. A critical role for ChREBP-mediated FGF21 secretion in hepatic fructose metabolism. Molecular Metabolism. 2017;6:14–21. doi: 10.1016/j.molmet.2016.11.008. [DOI] [PMC free article] [PubMed] [Google Scholar]
- 10.Desai B.N., Singhal G., Watanabe M., Stevanovic D., Lundasen T., Fisher F.M. Fibroblast growth factor 21 (FGF21) is robustly induced by ethanol and has a protective role in ethanol associated liver injury. Molecular Metabolism. 2017;6:1395–1406. doi: 10.1016/j.molmet.2017.08.004. [DOI] [PMC free article] [PubMed] [Google Scholar]
- 11.Ye D., Wang Y., Li H., Jia W., Man K., Lo C.M. Fibroblast growth factor 21 protects against acetaminophen-induced hepatotoxicity by potentiating peroxisome proliferator-activated receptor coactivator protein-1alpha-mediated antioxidant capacity in mice. Hepatology. 2014;60:977–989. doi: 10.1002/hep.27060. [DOI] [PubMed] [Google Scholar]
- 12.Huang X., Yu C., Jin C., Yang C., Xie R., Cao D. Forced expression of hepatocyte-specific fibroblast growth factor 21 delays initiation of chemically induced hepatocarcinogenesis. Molecular Carcinogenesis. 2006;45:934–942. doi: 10.1002/mc.20241. [DOI] [PubMed] [Google Scholar]
- 13.Dushay J., Chui P.C., Gopalakrishnan G.S., Varela-Rey M., Crawley M., Fisher F.M. Increased fibroblast growth factor 21 in obesity and nonalcoholic fatty liver disease. Gastroenterology. 2010;139:456–463. doi: 10.1053/j.gastro.2010.04.054. [DOI] [PMC free article] [PubMed] [Google Scholar]
- 14.Yilmaz Y., Eren F., Yonal O., Kurt R., Aktas B., Celikel C.A. Increased serum FGF21 levels in patients with nonalcoholic fatty liver disease. European Journal of Clinical Investigation. 2010;40:887–892. doi: 10.1111/j.1365-2362.2010.02338.x. [DOI] [PubMed] [Google Scholar]
- 15.Li H., Fang Q., Gao F., Fan J., Zhou J., Wang X. Fibroblast growth factor 21 levels are increased in nonalcoholic fatty liver disease patients and are correlated with hepatic triglyceride. Journal of Hepatology. 2010;53:934–940. doi: 10.1016/j.jhep.2010.05.018. [DOI] [PubMed] [Google Scholar]
- 16.Ter Horst K.W., Gilijamse P.W., Demirkiran A., van Wagensveld B.A., Ackermans M.T., Verheij J. The FGF21 response to fructose predicts metabolic health and persists after bariatric surgery in obese humans. Molecular Metabolism. 2017;6:1493–1502. doi: 10.1016/j.molmet.2017.08.014. [DOI] [PMC free article] [PubMed] [Google Scholar]
- 17.Christodoulides C., Dyson P., Sprecher D., Tsintzas K., Karpe F. Circulating fibroblast growth factor 21 is induced by peroxisome proliferator-activated receptor agonists but not ketosis in man. The Journal of Clinical Endocrinology and Metabolism. 2009;94:3594–3601. doi: 10.1210/jc.2009-0111. [DOI] [PubMed] [Google Scholar]
- 18.Galman C., Lundasen T., Kharitonenkov A., Bina H.A., Eriksson M., Hafstrom I. The circulating metabolic regulator FGF21 is induced by prolonged fasting and PPARalpha activation in man. Cell Metabolism. 2008;8:169–174. doi: 10.1016/j.cmet.2008.06.014. [DOI] [PubMed] [Google Scholar]
- 19.Fazeli P.K., Faje A.T., Cross E.J., Lee H., Rosen C.J., Bouxsein M.L. Serum FGF-21 levels are associated with worsened radial trabecular bone microarchitecture and decreased radial bone strength in women with anorexia nervosa. Bone. 2015;77:6–11. doi: 10.1016/j.bone.2015.04.001. [DOI] [PMC free article] [PubMed] [Google Scholar]
- 20.Dushay J.R., Toschi E., Mitten E.K., Fisher F.M., Herman M.A., Maratos-Flier E. Fructose ingestion acutely stimulates circulating FGF21 levels in humans. Molecular Metabolism. 2015;4:51–57. doi: 10.1016/j.molmet.2014.09.008. [DOI] [PMC free article] [PubMed] [Google Scholar]
- 21.Younossi Z.M., Koenig A.B., Abdelatif D., Fazel Y., Henry L., Wymer M. Global epidemiology of nonalcoholic fatty liver disease-Meta-analytic assessment of prevalence, incidence, and outcomes. Hepatology. 2016;64:73–84. doi: 10.1002/hep.28431. [DOI] [PubMed] [Google Scholar]
- 22.Bellentani S. The epidemiology of non-alcoholic fatty liver disease. Liver International: Official Journal of the International Association for the Study of the Liver. 2017;37(Suppl 1):81–84. doi: 10.1111/liv.13299. [DOI] [PubMed] [Google Scholar]
- 23.Sanyal Arun, EDC, Neuschwander-Tetri Brent, Loomba Rohit, Harrison Stephen, Abdelmalek Manal F. BMS-986036 (PEGylated FGF21) in patients with non-alcoholic steatohepatitis: a phase 2 study. Hepatology. 2017;66:104A–105A. [Google Scholar]
- 24.Henriksson E.N.J., Galsgaard E.D., Kirk R.K., Rakipovski G., Anderson B. A novel long-acting FGF21 analogue significantly improves liver steatosis and halters progression of fibrosis in pre-clinical models of NASH. Hepatology. 2017;66 1061A–A. [Google Scholar]
- 25.Neuschwander-Tetri B.A. Hepatic lipotoxicity and the pathogenesis of nonalcoholic steatohepatitis: the central role of nontriglyceride fatty acid metabolites. Hepatology. 2010;52:774–788. doi: 10.1002/hep.23719. [DOI] [PubMed] [Google Scholar]
- 26.Bedossa P., Poynard T. An algorithm for the grading of activity in chronic hepatitis C. The METAVIR Cooperative Study Group. Hepatology. 1996;24:289–293. doi: 10.1002/hep.510240201. [DOI] [PubMed] [Google Scholar]
- 27.Folch J., Lees M., Sloane Stanley G.H. A simple method for the isolation and purification of total lipides from animal tissues. The Journal of Biological Chemistry. 1957;226:497–509. [PubMed] [Google Scholar]
- 28.Ekins S., Nikolsky Y., Bugrim A., Kirillov E., Nikolskaya T. Pathway mapping tools for analysis of high content data. Methods in Molecular Biology. 2007;356:319–350. doi: 10.1385/1-59745-217-3:319. [DOI] [PubMed] [Google Scholar]
- 29.Singhal G., Fisher F.M., Chee M.J., Tan T.G., El Ouaamari A., Adams A.C. Fibroblast growth factor 21 (FGF21) protects against high fat diet induced inflammation and islet hyperplasia in pancreas. PLoS One. 2016;11 doi: 10.1371/journal.pone.0148252. e0148252. [DOI] [PMC free article] [PubMed] [Google Scholar]
- 30.Swanson B.J., Yearsley M.M., Marsh W., Frankel W.L. A triple stain of reticulin, glypican-3, and glutamine synthetase: a useful aid in the diagnosis of liver lesions. Archives of Pathology & Laboratory Medicine. 2015;139:537–542. doi: 10.5858/arpa.2013-0645-OA. [DOI] [PubMed] [Google Scholar]
- 31.Kuramitsu Y., Harada T., Takashima M., Yokoyama Y., Hidaka I., Iizuka N. Increased expression and phosphorylation of liver glutamine synthetase in well-differentiated hepatocellular carcinoma tissues from patients infected with hepatitis C virus. Electrophoresis. 2006;27:1651–1658. doi: 10.1002/elps.200500718. [DOI] [PubMed] [Google Scholar]
- 32.Mittal S., El-Serag H.B. Epidemiology of hepatocellular carcinoma: consider the population. Journal of Clinical Gastroenterology. 2013;47(Suppl):S2–S6. doi: 10.1097/MCG.0b013e3182872f29. [DOI] [PMC free article] [PubMed] [Google Scholar]
- 33.El-Serag H.B., Kanwal F. Epidemiology of hepatocellular carcinoma in the United States: where are we? Where do we go? Hepatology. 2014;60:1767–1775. doi: 10.1002/hep.27222. [DOI] [PMC free article] [PubMed] [Google Scholar]
- 34.Bosch F.X., Ribes J., Cleries R., Diaz M. Epidemiology of hepatocellular carcinoma. Clinics in Liver Disease. 2005;9:191–211. doi: 10.1016/j.cld.2004.12.009. v. [DOI] [PubMed] [Google Scholar]
- 35.El-Serag H.B., Rudolph K.L. Hepatocellular carcinoma: epidemiology and molecular carcinogenesis. Gastroenterology. 2007;132:2557–2576. doi: 10.1053/j.gastro.2007.04.061. [DOI] [PubMed] [Google Scholar]
- 36.Larsson S.C., Wolk A. Overweight, obesity and risk of liver cancer: a meta-analysis of cohort studies. British Journal of Cancer. 2007;97:1005–1008. doi: 10.1038/sj.bjc.6603932. [DOI] [PMC free article] [PubMed] [Google Scholar]
- 37.Calle E.E., Rodriguez C., Walker-Thurmond K., Thun M.J. Overweight, obesity, and mortality from cancer in a prospectively studied cohort of U.S. adults. New England Journal of Medicine. 2003;348:1625–1638. doi: 10.1056/NEJMoa021423. [DOI] [PubMed] [Google Scholar]
- 38.El-Serag H.B., Hampel H., Javadi F. The association between diabetes and hepatocellular carcinoma: a systematic review of epidemiologic evidence. Clinical Gastroenterology and Hepatology: The Official Clinical Practice Journal of the American Gastroenterological Association. 2006;4:369–380. doi: 10.1016/j.cgh.2005.12.007. [DOI] [PubMed] [Google Scholar]
- 39.Wang P., Kang D., Cao W., Wang Y., Liu Z. Diabetes mellitus and risk of hepatocellular carcinoma: a systematic review and meta-analysis. Diabetes/Metabolism Research and Reviews. 2012;28:109–122. doi: 10.1002/dmrr.1291. [DOI] [PubMed] [Google Scholar]
- 40.Speliotes E.K., Butler J.L., Palmer C.D., Voight B.F., Consortium G., Consortium M.I. PNPLA3 variants specifically confer increased risk for histologic nonalcoholic fatty liver disease but not metabolic disease. Hepatology. 2010;52:904–912. doi: 10.1002/hep.23768. [DOI] [PMC free article] [PubMed] [Google Scholar]
- 41.Kozlitina J., Smagris E., Stender S., Nordestgaard B.G., Zhou H.H., Tybjaerg-Hansen A. Exome-wide association study identifies a TM6SF2 variant that confers susceptibility to nonalcoholic fatty liver disease. Nature Genetics. 2014;46:352–356. doi: 10.1038/ng.2901. [DOI] [PMC free article] [PubMed] [Google Scholar]
- 42.Thorgeirsson S.S., Grisham J.W. Molecular pathogenesis of human hepatocellular carcinoma. Nature Genetics. 2002;31:339–346. doi: 10.1038/ng0802-339. [DOI] [PubMed] [Google Scholar]
- 43.Aravalli R.N., Steer C.J., Cressman E.N. Molecular mechanisms of hepatocellular carcinoma. Hepatology. 2008;48:2047–2063. doi: 10.1002/hep.22580. [DOI] [PubMed] [Google Scholar]
- 44.Hoshida Y., Villanueva A., Kobayashi M., Peix J., Chiang D.Y., Camargo A. Gene expression in fixed tissues and outcome in hepatocellular carcinoma. New England Journal of Medicine. 2008;359:1995–2004. doi: 10.1056/NEJMoa0804525. [DOI] [PMC free article] [PubMed] [Google Scholar]
- 45.Turner N., Grose R. Fibroblast growth factor signalling: from development to cancer. Nature Reviews Cancer. 2010;10:116–129. doi: 10.1038/nrc2780. [DOI] [PubMed] [Google Scholar]
- 46.Sandhu D.S., Baichoo E., Roberts L.R. Fibroblast growth factor signaling in liver carcinogenesis. Hepatology. 2014;59:1166–1173. doi: 10.1002/hep.26679. [DOI] [PubMed] [Google Scholar]
- 47.Alvarez-Sola G., Uriarte I., Latasa M.U., Urtasun R., Barcena-Varela M., Elizalde M. Fibroblast growth factor 15/19 in hepatocarcinogenesis. Digestive Diseases. 2017;35:158–165. doi: 10.1159/000450905. [DOI] [PubMed] [Google Scholar]
- 48.Tsai S.M., Wang W.P. Expression and function of fibroblast growth factor (FGF) 7 during liver regeneration. Cellular Physiology and Biochemistry: International Journal of Experimental Cellular Physiology, Biochemistry, and Pharmacology. 2011;27:641–652. doi: 10.1159/000330073. [DOI] [PubMed] [Google Scholar]
- 49.Takase H.M., Itoh T., Ino S., Wang T., Koji T., Akira S. FGF7 is a functional niche signal required for stimulation of adult liver progenitor cells that support liver regeneration. Genes & Development. 2013;27:169–181. doi: 10.1101/gad.204776.112. [DOI] [PMC free article] [PubMed] [Google Scholar]
- 50.Tassi E., Al-Attar A., Aigner A., Swift M.R., McDonnell K., Karavanov A. Enhancement of fibroblast growth factor (FGF) activity by an FGF-binding protein. Journal of Biological Chemistry. 2001;276:40247–40253. doi: 10.1074/jbc.M104933200. [DOI] [PubMed] [Google Scholar]
- 51.Czubayko F., Liaudet-Coopman E.D., Aigner A., Tuveson A.T., Berchem G.J., Wellstein A. A secreted FGF-binding protein can serve as the angiogenic switch in human cancer. Nature Medicine. 1997;3:1137–1140. doi: 10.1038/nm1097-1137. [DOI] [PubMed] [Google Scholar]
- 52.Tovar V., Cornella H., Moeini A., Vidal S., Hoshida Y., Sia D. Tumour initiating cells and IGF/FGF signalling contribute to sorafenib resistance in hepatocellular carcinoma. Gut. 2017;66:530–540. doi: 10.1136/gutjnl-2015-309501. [DOI] [PMC free article] [PubMed] [Google Scholar]
- 53.Allen E., Walters I.B., Hanahan D. Brivanib, a dual FGF/VEGF inhibitor, is active both first and second line against mouse pancreatic neuroendocrine tumors developing adaptive/evasive resistance to VEGF inhibition. Clinical Cancer Research: An Official Journal of the American Association for Cancer Research. 2011;17:5299–5310. doi: 10.1158/1078-0432.CCR-10-2847. [DOI] [PMC free article] [PubMed] [Google Scholar]
- 54.Schmidt B., Wei L., DePeralta D.K., Hoshida Y., Tan P.S., Sun X. Molecular subclasses of hepatocellular carcinoma predict sensitivity to fibroblast growth factor receptor inhibition. International Journal of Cancer. 2016;138:1494–1505. doi: 10.1002/ijc.29893. [DOI] [PMC free article] [PubMed] [Google Scholar]
- 55.Zhang Q., Li Y., Liang T., Lu X., Liu X., Zhang C. Loss of FGF21 in diabetic mouse during hepatocellular carcinogenetic transformation. American Journal of Cancer Research. 2015;5:1762–1774. [PMC free article] [PubMed] [Google Scholar]
- 56.Yasui K., Hashimoto E., Komorizono Y., Koike K., Arii S., Imai Y. Characteristics of patients with nonalcoholic steatohepatitis who develop hepatocellular carcinoma. Clinical Gastroenterology and Hepatology: The Official Clinical Practice Journal of the American Gastroenterological Association. 2011;9:428–433. doi: 10.1016/j.cgh.2011.01.023. quiz e50. [DOI] [PubMed] [Google Scholar]
- 57.Kawada N., Imanaka K., Kawaguchi T., Tamai C., Ishihara R., Matsunaga T. Hepatocellular carcinoma arising from non-cirrhotic nonalcoholic steatohepatitis. Journal of Gastroenterology. 2009;44:1190–1194. doi: 10.1007/s00535-009-0112-0. [DOI] [PubMed] [Google Scholar]
- 58.Noureddin M., Rinella M.E. Nonalcoholic Fatty liver disease, diabetes, obesity, and hepatocellular carcinoma. Clinics in Liver Disease. 2015;19:361–379. doi: 10.1016/j.cld.2015.01.012. [DOI] [PMC free article] [PubMed] [Google Scholar]