

Abstract
The use of offline liquid chromatography-matrix assisted laser desorption/ionization (LC-MALDI) tandem mass spectrometry (MS/MS) for bottom-up proteomics offers advantages in terms of cost, ease of use, and the time-decoupled nature of the separation step and the mass analysis. A method was developed to improve the capabilities of LC-MALDI-MS/MS in terms of protein identification in a bottom-up proteomic workflow. Enhanced protein identification is achieved by an increase in the MALDI signal intensity of the precursor peptides brought about by coating the MALDI plate with a thin film of graphite powder. Using the Escherichia coli proteome, it is demonstrated that the graphite-modified MALDI plates used in an offline LC-MALDI-MS/MS bottom-up protocol led to a 50 to 135% increase in the number of peptide identifications, and a concomitant 21% to 105% increase in the number of proteins inferred. We identify factors that lead to improvements in peptide sequence identifications and in the number of unique proteins identified when compared to using an unmodified MALDI plate. These improvements are achieved using a low cost approach that it is easy to implement, requires no major hardware/protocol modification, compatible with LC and adds no additional analysis time.
Keywords: offline LC-MALDI, MALDI-TOF/TOF, Bottom-up Proteomics, protein identification
Graphical abstract

1.1. Introduction
Reversed-phase liquid chromatography (LC) coupled with Electrospray Ionization (ESI) tandem mass spectrometry (MS/MS) for analysis of tryptic peptides has served as a cornerstone of proteomic measurements for decades.1,2 Although LC-Matrix Assisted Laser Desorption/Ionization (MALDI)-MS/MS has fallen out of favor for comprehensive shotgun proteomics due to its limited proteome coverage, the approach has unique characteristics which have allowed it to establish a niche in bottom-up proteomics. MALDI instruments are relatively easy to operate and are less susceptible to contamination than ESI instruments. MALDI-time of flight/time of flight (ToF/ToF) instruments cost less than high mass resolution Orbitrap-based MS systems. In addition, LC-MALDI-MS/MS has been found to yield complementary results to those obtained by LC-ESI-MS/MS, albeit at the cost of longer analysis times.3–6
A significant advantage gained when using LC-MALDI is the time-decoupled separation step and mass analysis. Although online coupling has been demonstrated, the most popular approach is an offline interface between the LC separation step and the MALDI-MS measurement. The LC eluate can be deposited directly onto the MALDI plate either continuously7–9 or as discrete fractions or spots.10–12 Thus, the fractions are effectively “frozen” in time, which has several implications. The MALDI plate can be stored for later analysis and/or reanalyzed. The sample can be modified after separation with techniques such as on-plate digestion.13,14,15 Also, data-dependent analysis can be performed without duty-cycle restrictions allowing for the manipulation of precursor ion selection strategies to improve the efficiency of MS/MS acquisition.5,16,17,18 Fractions can also be analyzed in an alternating fashion to gain complementary19 or additional20,21 information. However, sample consumption in MALDI limits the extent of MS and MS/MS analyses that can be performed or repeated at each fraction.
Other advantages include the relatively high tolerance of MALDI to additives compared to ESI. The chromatographic conditions can be optimized independently of the ionization step, as additives like trifluoroacetic acid (TFA), detrimental in ESI, do not interfere or suppress the MALDI process. MALDI produces predominantly singly charged peptides, which yields simple mass spectra. Therefore, development of an improved protocol incorporating MALDI-MS/MS coupled with LC can provide another effective and complementary tool for the analysis of the proteome.
To increase the signal intensity or signal-to-noise ratio (S/N) in MALDI-MS when analyzing peptides several groups have explored the possibility of varying the matrix compound and/or altering the surface onto which the sample is spotted. One effective and simple approach uses a layer of graphite to coat the MALDI plate. Graphite was explored because of its strong light absorption in the UV range, thus providing a pathway for energy transfer and analyte desorption. The first use of graphite in MALDI-MS was as an additive mixed with glycerol for the analysis of peptides, proteins and synthetic polymers.22,23 A substitution of the standard metal plate with a plate made of graphite for the analysis of synthetic polymer without the use of matrix has also been demonstrated.24 The use of graphite as a matrix was explored using simple pencil lead (graphite plus a clay binder) applied to the metal prior to the sample deposition.25,26 The use of a silicone/graphite coating applied prior to the deposition of a mixture of matrix and analyte was later studied by Li et al.27 They reported that the matrix α-cyano-4-hydroxycinnamic acid (CHCA) formed smaller crystals and produced more homogeneous spots than those produced using untreated surfaces. It was proposed that the graphite served as nucleation sites for the CHCA crystal growth. Moreover, these investigators reported an increase in signal intensity when using the silicon/graphite treated targets compared to untreated steel targets. This in turn resulted in an increase in the number of proteins identified by peptide mass fingerprinting (PMF) measurements (2-dimmensional gel electrophoresis and in-gel tryptic digests).
Recently, Gorka et al28 reported that by modifying the surface of the MALDI plate with a thin film of graphite powder (not observable by SEM or visible microscopy) produced similar signal enhancements and lower the detection limits for standard peptides and the protein bovine serum albumin (BSA). They also observed a difference in the matrix crystallization morphology when using modified graphite plates when compared to unmodified stainless steel plates. Reproducibility of the mass spectral ion intensity was also observed to improve due to the uniform crystallization of the matrix, and they reported relative standard deviations (RSD) of 15% when using graphite-modified plates, a decrease from 40% RSD when using unmodified MALDI plates.
Recently, a graphite preparation step using conducting graphite paint was used for on-plate proteolysis and lipid extraction.29,30 Samples of protein standards, egg yolk and bovine milk were analyzed using MALDI-MS and compared to solution-based digestion. The sequence coverage of the on-plate digested samples without the graphite surface pre-treatment were substantially lower when compared to proteolysis performed in-solution. However, sequence coverage of on-plate digestion with the added graphite pre-treatment was significantly higher than untreated on-plate digestions and comparable to solution based methods. This was attributed to graphite having higher thermal conductivity resulting in increased denaturation and enzymatic activity.
Even though the enhancing effect of graphite-modified MALDI plates on the signal intensity has been well documented, past studies have focused only on standard peptides, proteins and protein digests (i.e., PMF). That is, no study has been conducted to quantify this effect in a shotgun-proteomics experiment. In this study, we evaluate the effect(s) of graphite-modified MALDI plates using LC offline MALDI-ToF/ToF-MS for the bottom-up proteomic analysis of the microorganism E. coli. Specifically, we quantify the effect of enhanced MALDI peptide signals on the number of peptides detected and identified (via MS/MS), and ultimately the number of protein identities inferred in a standard bottom-up proteomics workflow.
1.2. Experimental Section
1.2.1. Chemicals
Water was purified using an 18 MΩ water purification system (Sartorius, Bohemia, NY). Acetonitrile (ACN; HPLC grade), agar, and Tris base were purchased from Fischer Scientific (Fair Lawn, NJ). Optima grade water and ACN used for LC mobile phases were also from Fischer Scientific. Hydrochloric acid was obtained from EMD Millipore (Billerica, MA). Triflouroacetic acid (TFA), iodoacetamide, dithiothreitol (DTT), and α-cyano-4-hydroxycinnamic acid (CHCA) were all purchased from Sigma Aldrich (St. Louis, MO). Trypticase soy broth was purchased from Becton, Dickinson and Company (Sparks, MD).
1.2.2. Bacteria
Escherichia coli K12 (kindly provided by Dr. Naomi Ward of the Molecular Biology Department, Univ. of Wyoming) was grown on trypticase soy agar for 24 hours. The cells were harvested using a sterilized nichrome wire inoculation loop. About 15 mg of cell material (approximately 4×10⁹ cells) were placed into a microcentrifuge tube and suspended in 1 mL of water by vortexing for 1 minute. Cells were then centrifuged 5 minutes at 10,000 rpm and the supernatant discarded. This washing step was repeated 3 times. After the final wash, cells were suspended in 1 mL of 100 mM Tris-HCl pH 8 in preparation for sonication. Sonication (Sonic Dismembrator, model number 60, Fischer Scientific) was performed on ice using a pulse duration of 10 s, followed by an idle 10 s, and repeated 10 times. After sonication the cells were centrifuged at 12,700 rpm for 15 minutes to separate cellular material. This process yielded an approximate extracted protein concentration of 0.86 mg/mL.
1.2.3. Digestion
A 1 mL aliquot of protein extract was first reduced with the addition of 50 μL of 100 mM DTT followed by incubation for 10 minutes at 95 °C. Next, 150 μL of 100 mM iodoacetamide was added. The solution was placed in the dark for 30 minutes. The protein solution was first digested with 125 μL of 0.1 μg/μL Lys-C (Wako, Richmond, VA) at 37 °C for 3 hours. This step was followed by the addition of 125 μL of 0.1 μg/μL of trypsin (Sigma-Aldrich) and further incubated for 12 hours at 37 °C. The digestion was stopped by the addition of 10 μL of TFA. The resulting digested solution was aliquoted out and stored at −80 °C for future analysis.
1.2.4. Graphite Modified MALDI Plates
MALDI plates were prepared using the “Graphite Supported Preparation” (GSP) protocol described by Gorka et al.28 Briefly, graphite powder (Sigma-Aldrich) was spread across a blank stainless steel LC-MALDI plate (Sciex) using a cotton swab. Excess graphite was removed by gently wiping the surface with a lint-free tissue. No visible changes on the MALDI plate surface were observed (as noted in the original work by Gorka et al); however, the resulting CHCA matrix/sample spots on these modified plates were darker when compared to spots on unmodified MALDI plates.
1.2.5. HPLC Separation
Prior to injection, digested protein samples were filtered using a 0.22 μm spin filter (Millipore) and then transferred to an autosampler vial (ThermoFisher vial#200 046, lid#C4011-54). The trap column (1.2 cm long, 100 μm inner diameter) and analytical column (15 cm long, 100 μm inner diameter) were packed in-house using C18 particles (3.6 μm particles with 200 Å pores, Phenomenex, Torrance, CA). LC separation was performed using an ekspert™ nanoLC 425 equipped with a NLC 400× Autosampler (both Sciex). Mobile phase A was 96% water, 4% ACN, 0.05% TFA and mobile phase B was 96% ACN, 4% water, 0.05% TFA. A 1 μL aliquot of the sample was injected onto the trap column at 5 μL/min flowrate and subsequently separated through the analytical column using the following gradient (at 400 nL/min): initial mobile phase at 5% B, then a gradient to 25% B at 80 min, 35% B at 100 min, 90% B at 120 min, holding for 25 min. The column was re-equilibrated for 40 min at initial mobile phase conditions. Eluates were deposited onto the blank LC-MALDI plate via the ekspot™ spotter (Sciex). The CHCA matrix (5 mg/mL, 0.1% TFA) was mixed online with the LC eluate using a syringe pump at a rate of 800 nL/min. The resulting mixture was deposited onto the plate in discrete 20 s fractions. Fraction collection/MALDI spotting was performed between the 18 min and 125 min of the LC gradient. Three samples were analyzed over the course of three days and each sample was injected twice, one without graphite applied to the plate and one with graphite. This yielded 3 data sets resulting from measurements using the standard MALDI plates (i.e., unmodified) and 3 data sets using the graphite-modified MALDI plates.
1.2.6. Mass Spectrometry
Mass spectrometry measurements were performed with a MALDI-ToF/ToF-MS (5800™, Sciex). External mass calibrations for reflectron mode were performed using a calibration mix (Cal mix TOF/TOF, Sciex) containing des-Arg1-bradykinin (m/z 904.468), Angiotensin I (m/z 1,296.685), Glu1-fibrinopeptide B (m/z 1,570.677), ACTH clip 1–17 (m/z 2,093.086), ACTH clip 18–39 (m/z 2,465.199), and ACTH clip 7–38 (m/z 3,657.929) diluted to the manufacturers specifications (1–3 pmol/μL each). The MS/MS external calibration was performed using the fragments of the Glu-fibrinopeptide B precursor ion.
The reflector mass window was set at m/z 800–4,000 with a focus of m/z 2,000. A fixed laser intensity of 2,700 au (arbitrary units) was used and 400 laser shots were averaged per mass spectrum. Parameters for the interpretation method used to select precursors for MS/MS analysis were as follows: minimum cluster area signal-to-noise filter of 50, mass range for precursor selection was m/z 900–4,000, maximum number of precursors per fraction was 20. Tandem-MS (MS/MS) was conducted using 2 kV positive mode collision induced dissociation (CID) at a pressure of 5.3×10⁻⁵ Pa (air). The precursor mass window is set by the instrument timed ion selector (TIS) window, which was set at a FWHM resolution of 200 relative to the mass. The spectrum was a result of an average of 400 shots at a laser intensity of 3,200 au.
1.2.7. Data Processing
Tandem mass spectrometry measurements were processed using the Peak Explorer™ and ProteinPilot™ software packages (Sciex), the latter implementing the Paragon™ algorithm for the identification of peptides from tandem mass spectra using sequence tags.31 The mass spectra were searched using iodoacetamide cysteine alkylation and E. coli K12 specific search. Other search settings were automatically set by the Paragon™ algorithm, which uses probabilities to model for peptide modifications, substitutions and cleavages, rather than user-defined and discrete settings to consider a feature. That is, the Paragon™ algorithm as used in this work considered a total of 417 possible modifications, each with an associated probability. As a result, the user-interface for this algorithm is simplified and does not require their selection prior to database search, as it is the case in other search engines like Mascot™ (Matrix Science). The criteria for peptide identification was set at a minimum of 95 % confidence, and the protein inference in the Paragon™ algorithm was set to a minimum of 99 % confidence score. These settings allowed for protein inference (at 99% confidence) with a minimum of one peptide. The False Discovery Rate (FDR) selected was <1% for protein identification, leading to each protein identification having a ≥ 99 % probability of being correct (i.e., local FDR). Tables listing different FDR levels with the identification yield for mass spectra, peptides and proteins for each replicate analysis are included in the Supplemental Information document as well as a spreadsheet detailing proteins detected, their score, percent coverage and number of peptides used in their identification. The database searched 9184 protein sequences (including contaminants and decoys) downloaded from UniProt on 1-17-17. The results of the software programs were exported to spreadsheets for further processing. Mirror-image plots of mass spectra were made using mMass 5.5.0 software,32 and box plots were generated using the BoxPlotR online tool.33
1.3. Results and Discussion
As mentioned earlier, the primary advantage of graphite-modified plates is an increase in signal intensity.28 Aligning with these previous findings, this work also found a significant enhancement in the signal intensity in LC-MALDI-MS measurements when utilizing graphite-modified plates and results are presented in the total ion chromatogram (TIC) in figure 1A. The TIC signal intensity using the graphite-coated plates ranges between 3 to 10 times larger than those using MALDI plates without graphite (The average signal areas of 10 precursor ions for both analyses, with graphite-modified and standard plates, are shown in the supporting information figure S1). From these data frequency distributions of all the signal intensities of the peptides detected in both analyses were generated and shown in figure 1B (a total of 3 analyses for each method and using the same sample). The frequency distribution for signals derived from measurements performed with the graphite-modified plate is shifted to higher intensities and its average is a factor of 2.5 higher than the average of the signals obtained using the unmodified plate. Also, the fact that the entire distribution is shifted toward higher intensities indicates that signal-enhancing effect of the graphite modification affects most peptides regardless of their amino acid sequence. Also from these data, it can be observed that measurements using the graphite coated plate resulted in an increase in the overall number of signals detected, that is, more signals meeting the minimum signal-to-noise requirement were detected. Specifically, 1185 peptides were detected using the graphite-coated plates versus 831 with the unmodified MALDI plates, providing clear evidence that graphite-modified plates increase the overall S/N of the MALDI signals for a wide range of tryptic peptides.
Figure 1.

A) Total ion chromatogram (TIC) of the 6 measurements plotted individually (3 with graphite-modified MALDI plates, 3 with unmodified plates), and B) signal intensity frequency distribution for a single replicate analysis using graphite-modified and std. MALDI plates (sample 2). The apex cluster area of each signal was used for this figure thus each m/z signal is only present once. The cluster area of all signals within a fraction was added to yield the total cluster area.
In MALDI-MS/MS analysis of LC fractions, a preliminary MS measurement is performed in order to select precursor ion candidates (meeting a pre-defined S/N criteria) for subsequent MS/MS measurement. Looking at the number of peptides meeting the criteria for MS/MS analysis, our results indicate that a higher number of precursor ions were selected in the analysis using graphite-modified MALDI plates (figure 2A). The increase in the number of precursor ions selected when using graphite-modified plates ranged from 37.6% to 106.4% for the 3 replicate analyses. The basis for this increase is best illustrated in figure 2B, where MALDI-mass spectra for the same sample and fraction number are compared for analyses performed with graphite-modified and unmodified MALDI plates. The larger signals of the analysis performed with the graphite-modified MALDI plate (top mass spectrum) resulted in the maximum number of precursor ions that are subjected for MS/MS analysis, in this case set to 20. In contrast, the analysis using standard unmodified MALDI plates (lower mass spectrum) yielded lower signal intensities and resulted in the selection of only 3 precursor ions for subsequent MS/MS. The inset mass spectrum for the ion at m/z 1,098 shows the prominent signal intensity difference between the two analyses, illustrating the high signal intensity of the precursor ion obtained with the graphite-modified plate (in this example, the same ion was selected for subsequent MS/MS in both analyses).
Figure 2.
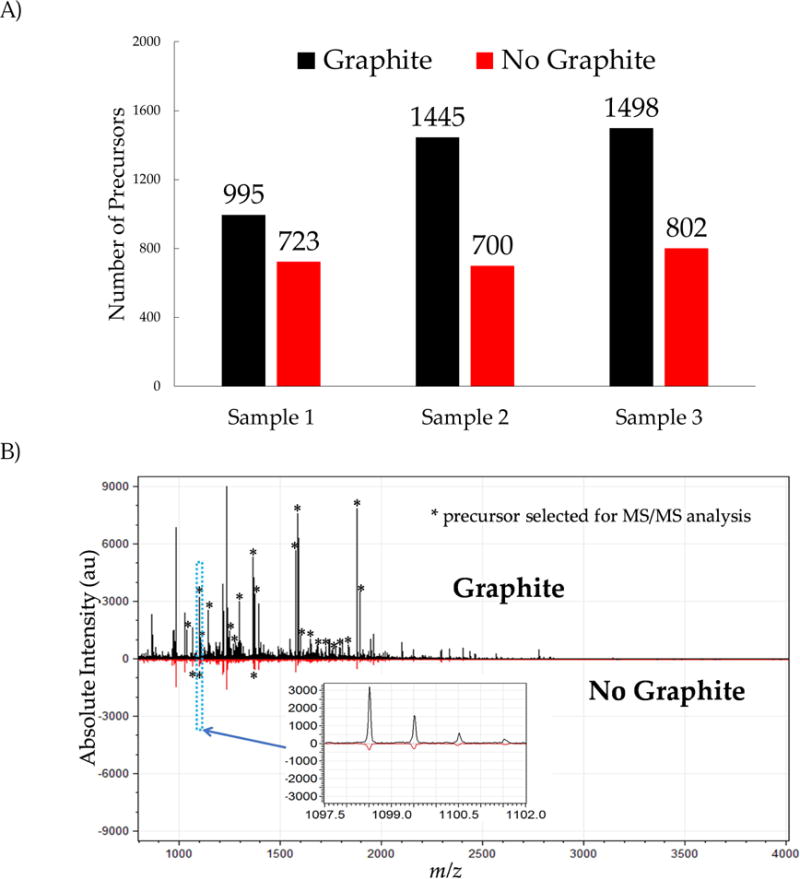
A) Number of precursor ions meeting the requirements for MS/MS measurement in each analysis. Analyses using graphite-modified plates consistently submitted more precursors ions for MS/MS analysis. B) Mirror image plot of fraction #116 with and without graphite application (same sample). Peaks labelled with an asterisk indicates that the ion was selected for MS/MS analysis. Each precursor is only selected once for MS/MS (only in the apex fraction), which explains why the base peak and other high S/N peaks were not selected in this particular fraction. In this example, the measurement with the graphite-modified plate resulted in a factor of 6 greater signal intensity and more precursors being selected for MS/MS (20 signals vs. 3). Inset shows a signal at m/z 1,098.5 submitted for MS/MS analysis by both methods.
We then looked at the number of peptides that were assigned a sequence or identified by the database sequence matching algorithm, performed with the software ProteinPilot™. Figure 3A shows the number of peptides identified by the ProteinPilot™ database search (with a >95% confidence level and total) for each of the 6 measurements. Overall, analyses using graphite-modified MALDI plates consistently led to the identification of more peptides than the analyses performed with unmodified MALDI plates. In these data, the increase in the total number of confidently identified peptides ranges from 48.9% to 134.5%, and confidence scores assigned to each peptide identification reveals differences in their distribution between the two assays. Figure 3B shows the difference in the percentage of peptides identified by each technique (graphite-modified vs. std. plate) plotted versus the database search identification confidence score. The resulting plot indicates that analyses performed with the standard MALDI plate tend to yield peptide identifications with low confidence scores, while analyses with graphite-modified MALDI plates yielded more peptide identifications with high confidence scores. Also, the fraction of acquired mass spectra that go unassigned is much smaller in the graphite-modified MALDI plate analysis (<1%) than in the standard analysis, that is, unidentified peptides with a confidence score equal to zero. The percentage of assigned fragment ions were consistently higher by 5% for measurements performed with the graphite-modified MALDI plates and these results are shown in the Supplemental Information section (Figure S2).
Figure 3.
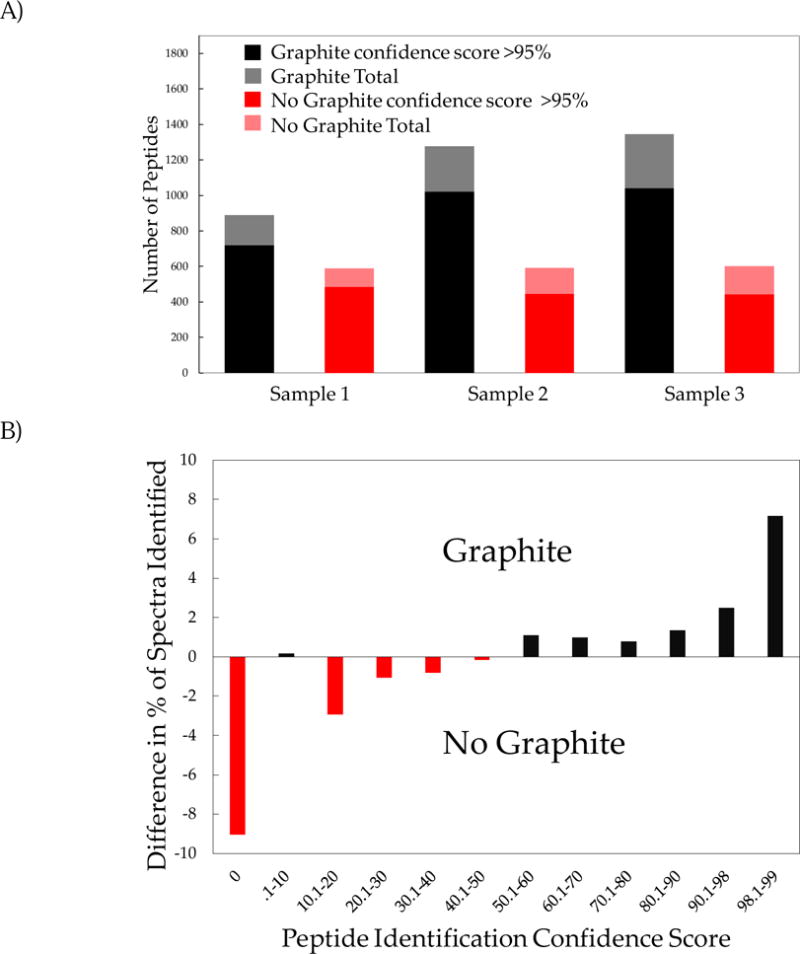
A) number of peptides identified (i.e., assigned a sequence) with a minimum confidence score of 95% or greater, and light shaded bar represent the total number of peptides identified (with any score, score 0–99). B) Difference in the normalized frequency distribution of the ProteinPilot™ peptide confidence score. Measurements using graphite modified MALDI plates yielded a higher percentage of scores above 50%, while measurements using non-modified plates had a higher percentage of scores below 50%. Measurements with unmodified MALDI plates also had a higher percentage of unidentified tandem mass spectra.
To highlight the striking difference in S/N between the two measurements, in Figure 4 we compare two tandem mass spectra obtained for the same precursor ion (m/z 1,592.8) using both methods. The overall signal intensity in the mass spectrum obtained using the graphite-modified plate is about a factor of 5 times higher than that obtained using the standard unmodified plate. Also between these tandem mass spectra there is a factor of 3.7 higher number of peaks detected in the graphite-modified measurement, demonstrating an increase in the S/N across the mass spectrum (peak detection threshold set at S/N= 10; number of peaks detected was 482 vs. 130 for graphite and non-graphite, respectively). The absolute intensity of the base peak (m/z 175; Arg y1 ion) for graphite-modified measurement was 6.6 times higher than the base peak (m/z 86; L/I immonium ion) of the unmodified plate measurement. This striking enhancement in the tandem mass spectrum of the graphite-modified measurements is believed to be the main factor influencing the higher scores obtained in database search matches. For examples, 8 signals were assigned in the graphite-modified MALDI plate measurement, compared to only 3 signals in the unmodified MALDI plate measurement. Specifically, the sequence assigned using the graphite-modified MALDI plate was VGVGLGTNYEEWLR with an 86% confidence score. On the other hand, the unmodified MALDI plate measurement led to an assigned peptide sequence of INVFDRSMSPAVEK with a confidence score less than 1%.
Figure 4.

Mirror image plot comparing tandem mass spectra of the precursor ion at m/z 1,592.8 obtained by measurements with and without graphite-modified MALDI plates. The intensity of the graphite mass spectrum is 6.6 times higher than the unmodified-plate measurements and resulted in 8 peaks assignments (labelled with +) versus only 3 peaks assigned in the measurement using unmodified MALDI plates.
The overall increase in the number of tandem mass spectra collected and the number of confident peptide sequence assignments translated in an increase in the number of proteins inferred in the analysis of the E. coli proteome. Figure 5A shows the total number of E. coli proteins inferred (at a 99% confidence level) using the ProteinPilot™ database search. All analyses with graphite-modified MALDI plates resulted in an increase of 21% to 105% in the number of proteins inferred when compared to analyses with unmodified plates. The ProteinPilot™ search score distributions have a higher upper limit for graphite-based analyses, but no significant difference was measured in the median or quartile scores (supporting information, figure S5). This is expected as scores are assigned based on mass spectral and match thresholds that are applied to both datasets. The Venn diagram shown in Figure 5B illustrates the overlap and uniqueness of the number of proteins inferred between the two methods compared. Based on replicate analyses of 3 protein samples, a total of 116 ± 10 proteins were inferred by both methods (figure 5B), while the number of unique protein identifications or inferences was greatly increased by the use of graphite-modified MALDI plates. An average of 90 ± 37 (n= 3, 1 std. dev.) unique proteins were detected for the graphite-modified analysis compared to an average of 6 ± 9 for the non-graphite analysis. This constitutes a 69% increase in the number of proteins inferred when using the graphite-modified MALDI plates over unmodified.
Figure 5.
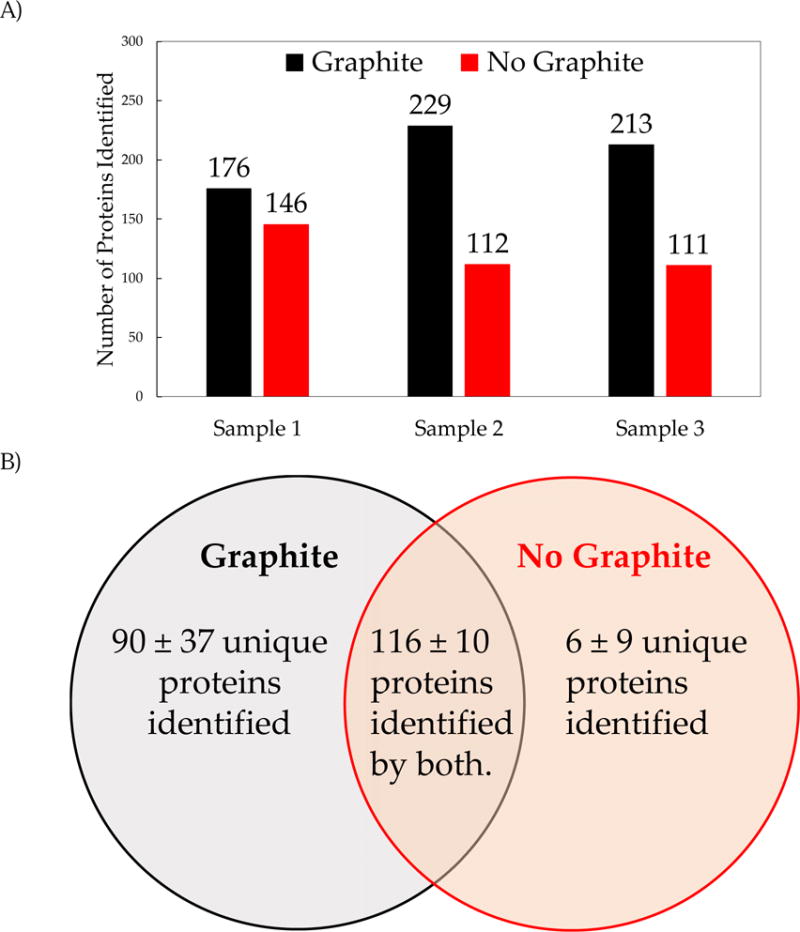
A) Number of E. coli proteins inferred by the ProteinPilot™ database search with a minimum confidence of 99%. Analyses performed with graphite-modified MALDI plates resulted in the identification of more proteins in all experiments conducted for this work. B) Venn diagram of the average (± std. deviation) number of E. coli proteins inferred by the ProteinPilot™ database search for the three samples.
1.4. Conclusions
The advantages of graphite-modified MALDI plate for shotgun bottom-up proteomics using offline LC-MALDI-MS/MS were demonstrated through the analysis of the E. coli proteome. Aligning with previous findings by other investigators, our work demonstrated that graphite-modified MALDI plates are compatible with offline LC deposition methods as the signal enhancement was observed along the entire LC gradient (i.e., unaffected by changing solvent composition). In the context of a bottom-up proteomic workflow, this signal increase has an overall advantage of an increase number of proteins identified/inferred. The modification of MALDI plates with graphite also proved to be very robust as it consistently provided increases in signal intensity and number of proteins identified between replicate analyses. Without a significant burden in time or labor, graphite modifications of MALDI plates was demonstrated to increase the utility of offline LC-MALDI-MS/MS for bottom-up proteomic applications. Even though the use of LC-ESI-MS/MS instrumentation remains the favored approach to conduct bottom-up proteomics in many laboratories, workflows implementing offline LC MALDI-ToF/ToF still provide a useful analytical platform in proteomic laboratories due to the complementary nature of ESI and MALDI.3–6 The use of gel separation techniques prior to LC (e.g., GeLC-MALDI-MS/MS)34 may provide even more improvements in terms of peptides and proteins detected and identified.
Supplementary Material
Acknowledgments
This work was supported in part by a grant from the NSF Chemical Measurement and Imaging (CMI) program (CHE-1611538). The acquisition of the MALDI-TOF/TOFMS instrument (Sciex 5800) was made possible by a grant from the NSF Major Research Instrumentation (MRI) program (CHE-1429615). Anthony Maus and Rudolph Mignon acknowledge financial support from NIH (NIH-INBRE) to the University of Wyoming; The NIH-INBRE project at the U. of Wyoming was supported by a grant from the National Institute of General Medical Sciences (P20GM103432) from the National Institutes of Health. The content is solely the responsibility of the authors and does not necessarily represent the official views of the National Institutes of Health.
Footnotes
Publisher's Disclaimer: This is a PDF file of an unedited manuscript that has been accepted for publication. As a service to our customers we are providing this early version of the manuscript. The manuscript will undergo copyediting, typesetting, and review of the resulting proof before it is published in its final citable form. Please note that during the production process errors may be discovered which could affect the content, and all legal disclaimers that apply to the journal pertain.
References
- 1.Zhang Y, Fonslow BR, Shan B, Baek M-C, Yates JR. Protein Analysis by Shotgun/Bottom-up Proteomics. Chem Rev. 2013;113(4):2343–2394. doi: 10.1021/cr3003533. [DOI] [PMC free article] [PubMed] [Google Scholar]
- 2.Aebersold R, Goodlett DR. Mass Spectrometry in Proteomics. Chem Rev. 2001;101(2):269–296. doi: 10.1021/cr990076h. [DOI] [PubMed] [Google Scholar]
- 3.Rietschel B, Arrey TN, Meyer B, Bornemann S, Schuerken M, Karas M, Poetsch A. Elastase Digests New Ammunition for Shotgun Membrane Proteomics. Mol Cell Proteomics. 2009;8(5):1029–1043. doi: 10.1074/mcp.M800223-MCP200. [DOI] [PMC free article] [PubMed] [Google Scholar]
- 4.Bodnar WM, Blackburn RK, Krise JM, Moseley MA. Exploiting the Complementary Nature of LC/MALDI/MS/MS and LC/ESI/MS/MS for Increased Proteome Coverage. J Am Soc Mass Spectrom. 2003;14(9):971–979. doi: 10.1016/S1044-0305(03)00209-5. [DOI] [PubMed] [Google Scholar]
- 5.Chen H, Rejtar T, Andreev V, Moskovets E, Karger BL. Enhanced Characterization of Complex Proteomic Samples Using LC−MALDI MS/MS: Exclusion of Redundant Peptides from MS/MS Analysis in Replicate Runs. Anal Chem. 2005;77(23):7816–7825. doi: 10.1021/ac050956y. [DOI] [PubMed] [Google Scholar]
- 6.Hessling B, Büttner K, Hecker M, Becher D. Global Relative Quantification with Liquid Chromatography–Matrix-Assisted Laser Desorption Ionization Time-of-Flight (LC-MALDI-TOF)—Cross–validation with LTQ-Orbitrap Proves Reliability and Reveals Complementary Ionization Preferences. Mol Cell Proteomics. 2013;12(10):2911–2920. doi: 10.1074/mcp.M112.023457. [DOI] [PMC free article] [PubMed] [Google Scholar]
- 7.Wall DB, Berger SJ, Finch JW, Cohen SA, Richardson K, Chapman R, Drabble D, Brown J, Gostick D. Continuous Sample Deposition from Reversed-Phase Liquid Chromatography to Tracks on a Matrix-Assisted Laser Desorption/Ionization Precoated Target for the Analysis of Protein Digests. ELECTROPHORESIS. 2002;23(18):3193–3204. doi: 10.1002/1522-2683(200209)23:18<3193::AID-ELPS3193>3.0.CO;2-Y. [DOI] [PubMed] [Google Scholar]
- 8.Keil O, LeRiche T, Deppe H, Volmer DA. Hyphenation of Capillary High-Performance Liquid Chromatography with Matrix-Assisted Laser Desorption/Ionization Time-of-Flight Mass Spectrometry for Nano-Scale Screening of Single-Bead Combinatorial Libraries. Rapid Commun Mass Spectrom. 2002;16(8):814–820. doi: 10.1002/rcm.642. [DOI] [PubMed] [Google Scholar]
- 9.Fung KYC, Askovic S, Basile F, Duncan MWA. Simple and Inexpensive Approach to Interfacing High-Performance Liquid Chromatography and Matrix-Assisted Laser Desorption/Ionization-Time of Flight-Mass Spectrometry. PROTEOMICS. 2004;4(10):3121–3127. doi: 10.1002/pmic.200300843. [DOI] [PubMed] [Google Scholar]
- 10.Mirgorodskaya E, Braeuer C, Fucini P, Lehrach H, Gobom J. Nanoflow Liquid Chromatography Coupled to Matrix-Assisted Laser Desorption/Ionization Mass Spectrometry: Sample Preparation, Data Analysis, and Application to the Analysis of Complex Peptide Mixtures. PROTEOMICS. 2005;5(2):399–408. doi: 10.1002/pmic.200400984. [DOI] [PubMed] [Google Scholar]
- 11.Ericson C, Phung QT, Horn DM, Peters EC, Fitchett JR, Ficarro SB, Salomon AR, Brill LM, Brock A. An Automated Noncontact Deposition Interface for Liquid Chromatography Matrix-Assisted Laser Desorption/Ionization Mass Spectrometry. Anal Chem. 2003;75(10):2309–2315. doi: 10.1021/ac026409j. [DOI] [PubMed] [Google Scholar]
- 12.Nägele E, Vollmer M. Coupling of Nanoflow Liquid Chromatography to Matrix-Assisted Laser Desorption/Ionization Mass Spectrometry: Real-Time Liquid Chromatography Run Mapping on a MALDI Plate. Rapid Commun Mass Spectrom. 2004;18(24):3008–3014. doi: 10.1002/rcm.1723. [DOI] [PubMed] [Google Scholar]
- 13.Getie-Kebtie M, Franke P, Aksamit R, Alterman MA. Experimental Evaluation of Protein Identification by an LC/MALDI/On-Target Digestion Approach. J Proteome Res. 2008;7(9):3697–3707. doi: 10.1021/pr800258k. [DOI] [PubMed] [Google Scholar]
- 14.Yoo C, Zhao J, Pal M, Hersberger K, Huber CG, Simeone DM, Beer DG, Lubman DM. Automated Integration of Monolith-Based Protein Separation with on-Plate Digestion for Mass Spectrometric Analysis of Esophageal Adenocarcinoma Human Epithelial Samples. Electrophoresis. 2006;27(18):3643–3651. doi: 10.1002/elps.200600117. [DOI] [PubMed] [Google Scholar]
- 15.Dauly C, Perlman DH, Costello CE, McComb ME. Protein Separation and Characterization by Np-RP−HPLC Followed by Intact MALDI-TOF Mass Spectrometry and Peptide Mass Mapping Analyses. J Proteome Res. 2006;5(7):1688–1700. doi: 10.1021/pr060108z. [DOI] [PMC free article] [PubMed] [Google Scholar]
- 16.Zerck A, Nordhoff E, Lehrach H, Reinert K. Optimal Precursor Ion Selection for LC-MALDI MS/MS. BMC Bioinformatics. 2013;14:56. doi: 10.1186/1471-2105-14-56. [DOI] [PMC free article] [PubMed] [Google Scholar]
- 17.Liu H, Yang L, Khainovski N, Dong M, Hall SC, Fisher SJ, Biggin MD, Jin J, Witkowska HE. Automated Iterative MS/MS Acquisition: A Tool for Improving Efficiency of Protein Identification Using a LC–MALDI MS Workflow. Anal Chem. 2011;83(16):6286–6293. doi: 10.1021/ac200911v. [DOI] [PubMed] [Google Scholar]
- 18.Gandhi T, Fusetti F, Wiederhold E, Breitling R, Poolman B, Permentier HP. Apex Peptide Elution Chain Selection: A New Strategy for Selecting Precursors in 2D-LC−MALDI-TOF/TOF Experiments on Complex Biological Samples. J Proteome Res. 2010;9(11):5922–5928. doi: 10.1021/pr1006944. [DOI] [PubMed] [Google Scholar]
- 19.Küster SK, Pabst M, Jefimovs K, Zenobi R, Dittrich PS. High-Resolution Droplet-Based Fractionation of Nano-LC Separations onto Microarrays for MALDI-MS Analysis. Anal Chem. 2014;86(10):4848–4855. doi: 10.1021/ac4041982. [DOI] [PubMed] [Google Scholar]
- 20.Baeumlisberger D, Rohmer M, Arrey TN, Mueller BF, Beckhaus T, Bahr U, Barka G, Karas M. Simple Dual-Spotting Procedure Enhances NLC–MALDI MS/MS Analysis of Digests with Less Specific Enzymes. J Proteome Res. 2011;10(6):2889–2894. doi: 10.1021/pr2001644. [DOI] [PubMed] [Google Scholar]
- 21.Pabst M, Kuster SK, Wahl F, Krismer J, Dittrich PS, Zenobi R. A Microarray-MALDI-MS Approach for Site-Specific Protein N-Glycosylation Analysis, as Demonstrated for Human Serum IgM. Mol Cell Proteomics. 2015 doi: 10.1074/mcp.O114.046748. mcp.O114.046748. [DOI] [PMC free article] [PubMed] [Google Scholar]
- 22.Sunner J, Dratz E, Chen Y-C. Graphite Surface-Assisted Laser Desorption/Ionization Time-of-Flight Mass Spectrometry of Peptides and Proteins from Liquid Solutions. Anal Chem. 1995;67(23):4335–4342. doi: 10.1021/ac00119a021. [DOI] [PubMed] [Google Scholar]
- 23.Dale MJ, Knochenmuss R, Zenobi R. Graphite/Liquid Mixed Matrices for Laser Desorption/Ionization Mass Spectrometry. Anal Chem. 1996;68(19):3321–3329. doi: 10.1021/ac960558i. [DOI] [PubMed] [Google Scholar]
- 24.Kim H-J, Lee J-K, Park S-J, Ro HW, Yoo DY, Yoon DY. Observation of Low Molecular Weight Poly(Methylsilsesquioxane)s by Graphite Plate Laser Desorption/Ionization Time-of-Flight Mass Spectrometry. Anal Chem. 2000;72(22):5673–5678. doi: 10.1021/ac0003899. [DOI] [PubMed] [Google Scholar]
- 25.Black C, Poile C, Langley J, Herniman J. The Use of Pencil Lead as a Matrix and Calibrant for Matrix-Assisted Laser Desorption/Ionisation. Rapid Commun Mass Spectrom. 2006;20(7):1053–1060. doi: 10.1002/rcm.2408. [DOI] [PubMed] [Google Scholar]
- 26.Langley GJ, Herniman JM, Townell MS. 2B or Not 2B, That Is the Question: Further Investigations into the Use of Pencil as a Matrix for Matrix-Assisted Laser Desorption/Ionisation. Rapid Commun Mass Spectrom. 2007;21(2):180–190. doi: 10.1002/rcm.2827. [DOI] [PubMed] [Google Scholar]
- 27.Li X, Wilm M, Franz T. Silicone/Graphite Coating for on-Target Desalting and Improved Peptide Mapping Performance of Matrix-Assisted Laser Desorption/Ionization-Mass Spectrometry Targets in Proteomic Experiments. PROTEOMICS. 2005;5(6):1460–1471. doi: 10.1002/pmic.200401023. [DOI] [PubMed] [Google Scholar]
- 28.Gorka J, Bahr U, Karas M. Graphite Supported Preparation (GSP) of α-Cyano-4-Hydroxycinnamic Acid (CHCA) for Matrix-Assisted Laser Desorption/Ionization Mass Spectrometry (MALDI-MS) for Peptides and Proteins. J Am Soc Mass Spectrom. 2012;23(11):1949–1954. doi: 10.1007/s13361-012-0478-8. [DOI] [PubMed] [Google Scholar]
- 29.Calvano CD, van der Werf ID, Sabbatini L, Palmisano F. On Plate Graphite Supported Sample Processing for Simultaneous Lipid and Protein Identification by Matrix Assisted Laser Desorption Ionization Mass Spectrometry. Talanta. 2015;137:161–166. doi: 10.1016/j.talanta.2015.01.030. [DOI] [PubMed] [Google Scholar]
- 30.Calvano CD, van der Werf ID, Palmisano F, Sabbatini L. Identification of Lipid-and Protein-Based Binders in Paintings by Direct on-Plate Wet Chemistry and Matrix-Assisted Laser Desorption Ionization Mass Spectrometry. Anal Bioanal Chem. 2014;407(3):1015–1022. doi: 10.1007/s00216-014-8359-6. [DOI] [PubMed] [Google Scholar]
- 31.Shilov IV, Seymour SL, Patel AA, Loboda A, Tang WH, Keating SP, Hunter CL, Nuwaysir LM, Schaeffer DA. The Paragon Algorithm, a Next Generation Search Engine That Uses Sequence Temperature Values and Feature Probabilities to Identify Peptides from Tandem Mass Spectra. Mol Cell Proteomics. 2007;6(9):1638–1655. doi: 10.1074/mcp.T600050-MCP200. [DOI] [PubMed] [Google Scholar]
- 32.Strohalm M, Hassman M, Košata B, Kodíček M. MMass Data Miner: An Open Source Alternative for Mass Spectrometric Data Analysis. Rapid Commun Mass Spectrom. 2008;22(6):905–908. doi: 10.1002/rcm.3444. [DOI] [PubMed] [Google Scholar]
- 33.Spitzer M, Wildenhain J, Rappsilber J, Tyers M. BoxPlotR: A Web Tool for Generation of Box Plots. Nat Methods. 2014;11(2):121–122. doi: 10.1038/nmeth.2811. [DOI] [PMC free article] [PubMed] [Google Scholar]
- 34.Dzieciatkowska M, Hill R, Hansen K. GeLC-MS/MS Analysis of Complex Protein Mixtures. In: Martins-de-Souza D, editor. Shotgun Proteomics. Springer; New York: 2014. pp. 53–66. (Methods in Molecular Biology). [DOI] [PMC free article] [PubMed] [Google Scholar]
Associated Data
This section collects any data citations, data availability statements, or supplementary materials included in this article.