

Abstract
Objective
Understanding the current status of parents’ vaccine decision making is crucial to inform public policy. We sought to assess changes in vaccine decisions among parents of young children.
Methods
We conducted a web-based national poll of parents of children <7 years in 2012 and 2014. Participants reported vaccine decisions for their youngest child. We calculated survey-weighted population estimates of overall immunizations decisions, and delay/refusal rates for specific vaccines.
Results
In 2012, 89.2% (95% CI, 87.3–90.8%) reported accepting or planning to accept all recommended non-influenza childhood vaccines, 5.5% (4.5–6.6%) reported intentionally delaying one or more, and 5.4% (4.1–6.9%) reported refusing one or more vaccines. In 2014, the acceptance, delay, and refusal rates were 90.8% (89.3–92.1%), 5.6% (4.6–6.9%), and 3.6% (2.8–4.5%), respectively. Between 2012 and 2014, intentional vaccine refusal decreased slightly among parents of older children (2–6 years) but not younger children (0–1 years). The proportion of parents working to catch up on all vaccines increased while those refusing some but not all vaccines decreased. The South experienced a significant increase in estimated acceptance (90.1–94.1%) and a significant decrease in intentional ongoing refusal (5.0–2.1%). Vaccine delay increased in the Northeast (3.2–8.8%).
Conclusions
Nationally, acceptance and ongoing intentional delay of recommended non-influenza childhood vaccines were stable. These findings suggest that more effort is warranted to counter persistent vaccine hesitancy, particularly at the local level. Longitudinal monitoring of immunization attitudes is also warranted to evaluate temporal shifts over time and geographically.
Keywords: Vaccine acceptability, Vaccine delay, Vaccine refusal, Immunization coverage, Vaccine hesitancy
1. Introduction
Childhood vaccination coverage in the United States (U.S.) has been consistently high in recent years, yet there is growing public health concern on stabilizing vaccine hesitancy [1–4] in the wake of recent high-profile outbreaks of measles, pertussis, and other vaccine preventable diseases (VPDs). These decisions to delay or refuse recommended vaccines impact not only the child for whom the immunizations are recommended, but also others in the community who are unable to vaccinate (e.g., those with contraindications). [5–8].
Estimates of vaccine delay vary widely (13–22%) [9–11], as do reasons for delay, which are often based on vaccines’ perceived risk/benefit [9,12]. Some parents may intentionally space vaccine doses over longer timeframes than recommended, or delay the entire vaccination schedule until a child is older, due to safety or efficacy concerns [11,13]. Alternatively, some may intend to accept vaccines but circumstantially delay due to acute illness or vaccine shortage [11]. Refusal estimates and definitions also vary; complete refusal of all vaccines is rare (estimated <1% nationally) [14], while selective refusal of one or more is more common (6–16%) [9,10,15,16]. Reasons given for refusal are linked to perceived risk or lack of necessity of specific vaccines [17–19].
The ongoing burden of VPDs is a reminder of the continued importance of vaccination and consequences arising from a loss of confidence [20,21]. Previous studies using National Immunization Survey data of immunization coverage among U.S. children ages 19–35 months have examined parental behavior related to vaccine refusal; the NIS has distinct methodological attributes (e.g. immunization confirmation by healthcare providers, large sample sizes, geographic granularity, assessment of vaccine combinations) [22–24]. Yet, few national samples exist that offer more recently collected data at two or more time points, and that offer measurement specificity to capture parental behavior toward immunizations across a decisional spectrum and in relation to specific vaccines. Thus, we conducted this study to gain thorough understanding of the recent status of childhood immunization decisions and to offer timely detection of shifts in vaccine hesitancy.
2. Methods
2.1. Study design and sample
The survey utilized quality standards implemented by the Federal government (e.g., CDC-sponsored National Immunization Survey (NIS)), including survey pilot testing via cognitive interviews with parents of young children. From January to March 2012 and June to July 2014, a probability-based sampling strategy was used to recruit from KnowledgePanel, a survey panel selected to be nationally representative of the U.S. population [25]. Panel members were recruited using address-based sampling and random digit dialing [26]. Members were offered Internet access if they did not have it before joining the panel. This methodology allows KnowledgePanel to closely mirror the US population [27].
Our sampling frame included English-speaking, non-institutionalized parents/guardians ages ⩾18 living in the U.S. with children <7 years. Participants were selected from potentially eligible active KnowledgePanel members, using probabilities weighted to account for panel recruitment design, demographic differences between the panel and current U.S. population, and non-coverage bias. Selected participants were invited via email to take the online survey. Participants received a $5 cash-equivalent incentive.
Our overall response rate was 52.7% (2603/4933) and 52.4% (2518/4803) in 2012 and 2014, respectively. Survey iterations had discrete populations. Following survey administration, ranking was applied to construct study-specific post-stratification weights that allowed analyses to adjust for non-response, sampling design, and sampling and non-sampling differences between the sample and US population of parents of children <7 [28]. The ranking procedure iteratively updated the base KnowledgePanel sample design weights to fit the marginal distribution of several key demographics of parents of children <7, as determined by the full KnowledgePanel (2012) and by the 2012 3-year American Community Survey estimates (2014) [29]. The sample was aligned to the US population on age and gender, race/Hispanic ethnicity, education, household income (2014 only), census region, and metropolitan residence. The FHI360 and Westat Institutional Review Boards approved each survey. Subsequently, the Emory University IRB also reviewed the study.
2.2. Measurement
Surveys examined behaviors of parents of children <7 towards childhood immunization, as this age group is primarily affected by school entry immunization policies and are included in the CDC recommended immunization schedule for infants and children [30,31]. Sociodemographic characteristics were derived from existing panel data and were not included on surveys. Child age was determined from the age category of the youngest child in the household (i.e., 0–1, 2–5, 6–12 years). In 2014, 116 parents verified having a child <7 years but did not have any children <12 years reported in their panel data, which we addressed using two models: (1) treating child’s age as missing and (2) considering them as having a child age 0–1 (as they were likely new parents whose panel information had not yet been updated at time of survey).
To assess vaccination decisions, we asked respondents if their youngest child received all vaccinations at their most recent medical appointment. Parents were asked about vaccines including Hepatitis B (HepB), Rotavirus (RV), Diphtheria, Tetanus, Pertussis (DTaP), Haemophilus influenzae type b (Hib), Pneumococcal (PCV), Inactive Poliovirus (IPV), Influenza (Flu), Measles, Mumps, Rubella (MMR), Varicella (chickenpox), and Hepatitis A (Hep A); the survey did not include combination administration (e.g., DTaP-Hib-IPV).
Response options included: (1) received all vaccinations at recommended time, (2) had not, but actively working on catching up, (3) delayed one or more but not all, (4) delayed all, (5) refused one or more but not all, (6) refused some and delayed some, and (7) refused all. Delays due to sickness or vaccine stock issues were not included as actual delays; we recoded those as actively working on catching up on all vaccines (n = 7 in 2012; n = 12 in 2014). Respondents who reported delaying or refusing at least one vaccine (not actively working to catch up) were then asked to indicate if they chose to delay or refuse 10 recommended childhood vaccines: HepB, RV, DTaP, Hib, PCV, IPV, influenza, MMR, chickenpox, and HepA. Respondents could also indicate if they were unsure of delay and/or refusal of each vaccine. Specific refusal and delay responses did not include parents who experienced circumstantial delay (e.g., due to acute illness or vaccine shortage) or those actively working to catch up on all vaccinations.
Because of differences in perception and attitudes towards influenza vaccination compared to other single-series childhood vaccines, this analysis focuses on delay and refusal of vaccines to protect against 1 or more of 13 diseases against which all young children are recommended to be vaccinated, excluding influenza [32]. The initial decision options were combined with specific vaccine decisions to determine parents’ non-influenza vaccine decision categories on the vaccine decision-making continuum. These categories were then aggregated into “acceptors” or highly- accepting parents (including parents who accepted all recommended non-influenza vaccines, those actively working to catch up, and those indicating delay or refusal of only influenza vaccination, but acceptance of all other recommended vaccines), “delayers” (or hesitant parents), and “refusers” (including parents who indicated refusal or possible refusal, but unsure, of at least one non-influenza vaccine).
2.3. Statistical analysis
Population estimates of U.S. vaccination decisions in 2012 and 2014 were constructed using survey post-stratification weights. Bivariate survey-weighted chi-square analyses between vaccination decisions and survey year determined changes in vaccination decisions over time. Additionally, U.S. decision rates were estimated for parents of children age 0–1 and of children age 2–6. Opportunities for delay or refusal are greater in the first two years of life. By stratifying by age, we were able to account for the number of doses normally due during this time period. We also assessed changes in childhood immunization decisions according to U.S. census region definitional parameters (West, Midwest, South, Northeast) [29,33]. Population estimates were also constructed for intentional and ongoing delay and refusal of each specific childhood vaccination, using only participants sure of delay or refusal. Estimates were also constructed for the proportion of parents unsure of delay or refusal of each vaccine.
We performed analyses using SPSS version 22.0 and SPSS Complex Sample Module (IBM SPSS Inc., Chicago, IL, USA). Statistical significance was assessed at α = 0.05 and point estimates were at 95% confidence.
3. Results
3.1. Sociodemographic characteristics
Respondent sociodemographic characteristics are described in Table 1. In both 2012 and 2014, the majority of respondents were female and between ages 25–44 years. A majority were non- Hispanic white, employed, married, had completed some college or more, lived in a metropolitan area, and had household income between $20,000 and $150,000.
Table 1.
Sociodemographic characteristics of survey respondents.
| 2012 (n = 2603) Frequency (%) |
2014 (n = 2518) Frequency (%) |
|
|---|---|---|
| Gender | ||
| Male | 719 (27.6%) | 699 (27.8%) |
| Female | 1884 (72.4%) | 1819 (72.2%) |
| Age | ||
| 18–24 | 391 (15.0%) | 179 (7.1%) |
| 25–34 | 1023 (39.3%) | 1273 (50.6%) |
| 35–44 | 997 (38.3%) | 887 (35.2%) |
| 45–54 | 178 (6.8%) | 155 (6.2%) |
| 55 and over | 14 (0.5%) | 24 (1.0%) |
| Ethnicity | ||
| Hispanic/Latino | 363 (13.9%) | 337 (13.4%) |
| Not Hispanic/Latino | 2224 (85.4%) | 2165 (86.0%) |
| Missing or refused | 16 (0.6%) | 16 (0.6%) |
| Race | ||
| White only | 2059 (79.1%) | 1989 (79.0%) |
| Black or African American only | 260 (10.0%) | 238 (9.5%) |
| American Indian or Alaska Native only | 20 (0.8%) | 17 (0.7%) |
| Asian only | 91 (3.5%) | 85 (3.4%) |
| Native Hawaiian or Pacific Islander only | 17 (0.7%) | 9 (0.4%) |
| Other single racea | 65 (2.5%) | 57 (2.3%) |
| Multiple race | 55 (2.1%) | 84 (3.3%) |
| Missing or refused | 36 (1.4%) | 39 (1.5%) |
| Educational attainment | ||
| Less than high school degree | 109 (4.2%) | 59 (2.3%) |
| High school degree | 359 (13.8%) | 326 (12.9%) |
| Some college | 916 (35.2%) | 871 (34.6%) |
| Bachelor’s degree | 797 (30.6%) | 818 (32.5%) |
| Master’s or Doctoral degree | 422 (16.2%) | 444 (17.6%) |
| Annual household income | ||
| Less than $10,000 | 206 (7.9%) | 151 (6.0%) |
| $10,000–$19,999 | 204 (7.8%) | 154 (6.1%) |
| $20,000–$39,999 | 561 (21.6%) | 505 (20.1%) |
| $40,000–$59,999 | 463 (17.8%) | 450 (17.9%) |
| $60,000–$99,999 | 714 (27.4%) | 757 (30.1%) |
| $100,000–149,999 | 313 (12.0%) | 347 (13.8%) |
| $150,000 or more | 142 (5.5%) | 154 (6.1%) |
| Employment status | ||
| Employed | 1618 (62.2%) | 1675 (66.5%) |
| Unemployed | 290 (11.1%) | 183 (7.3%) |
| Retired or disabled | 56 (2.2%) | 57 (2.3%) |
| Not working – other | 639 (24.5%) | 603 (23.9%) |
| Marital status | ||
| Married, widowed, or living with partner | 2231 (85.7%) | 2183 (86.7%) |
| Divorced or separated | 144 (5.5%) | 125 (5.0%) |
| Never married | 228 (8.8%) | 210 (8.3%) |
| Residence in metropolitan statistical area | ||
| Metropolitan | 2218 (85.2%) | 2165 (86.0%) |
| Non-metropolitan | 385 (14.8%) | 353 (14.0%) |
| Geographic region of residence | ||
| Northeast | 357 (13.7%) | 351 (13.9%) |
| Midwest | 730 (28.0%) | 673 (26.7%) |
| South | 869 (33.4%) | 840 (33.4%) |
| West | 647 (24.9%) | 654 (26.0%) |
| Age of youngest child in household | ||
| 0–1 | 947 (36.4%) | 774 (30.7%) |
| 2–6 | 1656 (63.6%) | 1628 (64.7%) |
| Missing | 0 (0.0%) | 116 (4.6%) |
Includes Hispanic and non-Hispanic others.
3.2. Childhood vaccination decisions: Rate estimates and changes
Table 2 presents U.S. population estimates of childhood vaccination decisions from the 2012 and 2014 surveys (non- influenza). There was no significant change among the overall distribution of vaccine acceptors, delayers, and refusers between years (survey-weighted chi-square; p = 0.07). However, significant change in the distribution of the seven vaccination decision sub-categories was observed (p = 0.01). One 2014 participant had missing outcome, accounted for by casewise deletion.
Table 2.
Population estimates and changes in decisions for vaccination of youngest child with recommended non-influenza vaccines.
| 2012 (n = 2603)
|
2014 (n = 2518, missing = 1)
|
Diff† | |||
|---|---|---|---|---|---|
| Unwt. N | Weighted Pop. Est. (95% CI) | Unwt. N | Weighted Pop. Est.% (95% CI) | ||
| Accepted | 2265 | 89.2% (87.3, 90.8) | 2234 | 90.8% (89.3, 92.1) | 1.6% |
| Accepted all recommended vaccines1 | 2189 | 86.9% (85.0, 88.7) | 2146 | 86.9% (85.1, 88.6) | 0.0% |
| Actively working to catch up on all recommended vaccines2 | 76 | 2.3% (1.7, 3.0) | 88 | 3.9% (2.9, 5.1) | 1.6%* |
| Delayed | 191 | 5.5% (4.5, 6.6) | 171 | 5.6% (4.6, 6.9) | 0.1% |
| Delayed one or more recommended vaccines3 | 163 | 4.7% (3.8, 5.8) | 146 | 5.0% (4.0, 6.3) | 0.3% |
| Delayed all recommended vaccines4 | 28 | 0.7% (0.5, 1.2) | 25 | 0.6% (0.4, 1.0) | −0.1% |
| Refused | 147 | 5.4% (4.1, 6.9) | 112 | 3.6% (2.8, 4.5) | −1.8%* |
| Refused one or more recommended vaccines5 | 62 | 2.5% (1.7, 3.7) | 41 | 1.1% (0.8, 1.7) | −1.4%* |
| Refused and delayed some recommended vaccines6 | 29 | 1.1% (0.6, 2.1) | 23 | 0.6% (0.3, 1.0) | −0.5% |
| Refused all recommended vaccines7 | 56 | 1.8% (1.2, 2.7) | 48 | 1.8% (1.3, 2.7) | 0.1% |
Unwt. N = Unweighted Frequency.
Weighted Pop. Est. = Weighted U.S. population estimate.
CI = Confidence Interval.
Difference in estimated percentage.
P-value < 0.05.
My child received all of his/her vaccines at the time(s) they were recommended, or indicated delaying or refusing only influenza.
My child has not received all of his/her vaccines at the time(s) they were recommended but I am actively working to catch up.
I chose to delay, or get later, one or more, but not all of the recommended vaccines at the time(s) they were recommended.
I chose to delay all of the recommended vaccines at the time(s) they were recommended.
I chose to refuse, or never get, one or more, but not all, of the recommended vaccines at the time(s) they were recommend.
I chose to refuse and delay some of the vaccines for my child at the time(s) they were recommended.
I chose to refuse all of the recommended vaccines at the time(s) they were recommended.
3.2.1. Decision to accept all non-influenza vaccines
No significant difference in the percentage of parents that accepted all vaccines was observed between years (p = 0.16). In 2012, an estimated 89.2% (95% CI, 87.3–90.8%) of parents of children <7 reported accepting all recommended vaccinations for their youngest child, compared to 90.8% (95% CI, 89.3–92.1%) in 2014.
3.2.2. Intentional ongoing delay of one or more non-influenza vaccines
No significant change was observed in either the overall (p = 0.82) or separate categories of vaccine delayers. Among the estimated 5.5% (95% CI, 4.5–6.6%) of parents who had intentional ongoing delay of at least one recommended vaccine in 2012, 0.7% (95% CI, 0.5–1.2%) chose to delay all and 4.7% (95% CI, 3.8–5.8%) delayed at least one but not all. Rates were similar in 2014, where 5.6% (95% CI, 4.6–6.9%) of parents chose to delay at least one of the recommended vaccines for their youngest child. Among those parents, 0.6% (95% CI, 0.4–1.0%) chose to delay all and 5.0% (95% CI, 4.0–6.3%) delayed at least one but not all. The most reported delayed vaccines included MMR, HepB, and chickenpox; the least delayed included DTaP, IPV, and HepA.
3.2.3. Intentional ongoing refusal of one or more non-influenza vaccines
Overall, reported intentional ongoing refusal of recommended childhood vaccines declined significantly (p = 0.02), from an estimated 5.4% (95% CI, 4.1–6.9%) in 2012 to 3.6% (95% CI, 2.8–4.5%) in 2014. Within the group of “refusers,” a subgroup of parents refused some, but not all, recommended vaccines (p < 0.01), estimated at 2.5% (95% CI, 1.7–3.7%) in 2012 and at 1.1% (95% CI, 0.8–1.7%) in 2014. The estimated proportion choosing to both refuse some and delay some recommended vaccines did not change significantly (p = 0.13) at 1.1% (95% CI, 0.6–2.1%) in 2012, compared to 0.6% (95% CI, 0.3–1.0%) in 2014.
3.2.4. Childhood vaccination decision rate estimates and changes by age group
Parents of children age 0–1 had stable delay and refusal rates between years. For parents of children age 2–6, the refusal rate decreased significantly between 2012 and 2014. The overall delay and refusal rates of parents of children age 2–6 were similar to those of parents of children age 0–1 (Table 3).
Table 3.
Population estimates and changes in choices for non-influenza vaccination of youngest child in the United States, by age of youngest child.
| 2012 (n = 2603) | 2014 Child Model (n = 2518; missing = 116) | 2014 Child+ Model (n = 2518; missing = 1) | |||
|---|---|---|---|---|---|
| Weighted Pop. Est. % (95% CI) | Weighted Pop. Est. % (95% CI) | Diff in % | Weighted Pop. Est. % (95% CI) | Diff in % | |
| Youngest child aged 0–1 (2012 n = 947; 2014 n = 890†) | |||||
| Accepted | 88.3% (85.1%, 90.9%) | 89.5% (86.3%, 92.0%) | 1.2% | 89.8% (87.0%, 92.1%) | 1.5% |
| Accepted all recommended vaccines | 85.6% (82.2%, 88.5%) | 85.8% (82.2%, 88.7%) | 0.2% | 85.9% (82.7%, 88.7%) | 0.4% |
| Actively working to catch up on all recommended vaccines | 2.7% (1.6%, 4.4%) | 3.7% (2.3%, 5.9%) | 1.0% | 3.9% (2.5%, 6.0%) | 1.2% |
| Delayed | 6.4% (4.7%, 8.5%) | 6.1% (4.2%, 8.7%) | −0.3% | 5.9% (4.3%, 8.3%) | 0.4% |
| Delayed one or more recommended vaccines | 5.2% (3.8%, 7.2%) | 5.5% (3.7%, 8.1%) | 0.3% | 5.3% (3.7%, 7.6%) | 0.0% |
| Delayed all recommended vaccines | 1.1% (0.6%, 2.2%) | 0.6% (0.3%, 1.2%) | −0.5% | 0.7% (0.3%, 1.4%) | 0.4% |
| Refused | 5.3% (3.5%, 8.1%) | 4.5% (2.8%, 6.9%) | −0.9% | 4.2% (2.8%, 6.3%) | 1.1% |
| Refused one or more recommended vaccines | 1.9% (1.0%, 3.5%) | 1.5% (0.8%, 2.8%) | −0.4% | 1.4% (0.8%, 2.6%) | 0.4% |
| Refused and delayed some recommended vaccines | 1.3% (0.4%, 4.3%) | 0.4% (0.2%, 1.0%) | −0.9% | 0.4% (0.2%, 0.9%) | 0.9% |
| Refused all recommended vaccines | 2.1% (1.2%, 3.8%) | 2.6% (1.3%, 5.0%) | 0.4% | 2.4% (1.3%, 4.3%) | 0.2% |
| Youngest child aged 2–6 (2012 n = 1656; 2014 n = 1628) | |||||
| Accepted | 89.7% (87.3%, 91.7%) | 91.3% (89.4%, 92.8%) | 1.6% | – | – |
| Accepted all recommended vaccines | 87.7% (85.2%, 89.8%) | 87.4% (85.1%, 89.4%) | −0.3% | – | – |
| Actively working to catch up on all recommended vaccines | 2.0% (1.4%, 2.9%) | 3.8% (2.7%, 5.5%) | 1.8%* | – | – |
| Delayed | 5.0% (3.8%, 6.5%) | 5.5% (4.2%, 7.1%) | 0.5% | – | – |
| Delayed one or more recommended vaccines | 4.4% (3.3%, 5.9%) | 4.9% (3.7%, 6.5%) | 0.5% | – | – |
| Delayed all recommended vaccines | 0.5% (0.3%, 1.0%) | 0.6% (0.3%, 1.2%) | 0.1% | – | – |
| Refused | 5.4% (3.8%, 7.5%) | 3.3% (2.4%, 4.3%) | −2.2%* | – | – |
| Refused one or more recommended vaccines | 2.8% (1.7%, 4.6%) | 1.0% (0.6%, 1.6%) | −1.9%** | – | – |
| Refused and delayed some recommended vaccines | 1.0% (0.5%, 1.9%) | 0.7% (0.4%, 1.3%) | −0.3% | – | – |
| Refused all recommended vaccines | 1.6% (0.9%, 2.9%) | 1.6% (1.0%, 2.5%) | 0.0% | – | – |
Weighted Pop. Est. = Weighted US population estimate.
CI = Confidence Interval.
Child Model = parents with no indicated children under 12 counted as missing.
Child+ Model = parents with no indicated children under 12 counted as having a youngest child aged 0–1.
774 parents of children 0–1 included in Child–Model for 2014; 890 parents included in Child+ Model (with one missing outcome).
p-value < 0.05.
p-value < 0.01.
3.3. Regional differences and changes in vaccination decisions
Fig. 1 displays estimated changes in childhood vaccination decisions by U.S. census region. In the South, a significant increase in estimated acceptance of recommended vaccines, from 90.1% (95% CI, 86.6–92.8%) in 2012 to 94.1% (95% CI, 92.3–95.5%) in 2014 (p = 0.01), was accompanied by a significant decrease in intentional ongoing refusal, from 5.0% (95% CI, 3.0–8.3%) in 2012 to 2.1% (95% CI, 1.3–3.3%) in 2014 (p = 0.01). The Northeast experienced a significant increase in estimated rates of delay between 2012 and 2014, from 3.2% (95% CI, 1.9–5.6%) in 2012 to 8.8% (95% CI, 5.3–14.3%) in 2014 (p < 0.01) and no change in rates of refusal in 2012 and 2014 The Midwest consistently had the highest estimated refusal rates in both years.
Fig. 1.
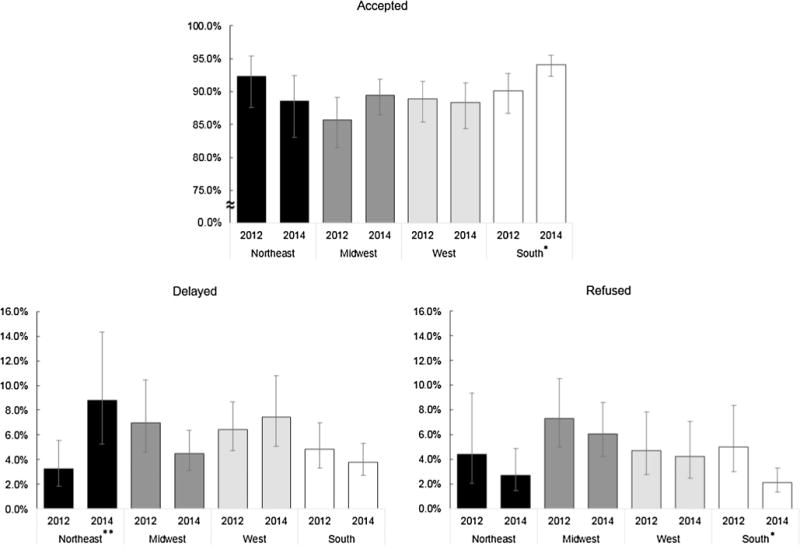
Population estimates and changes in choices for recommended non-influenza vaccinations of youngest child by US census region. *Proportion in this region significantly changed from survey year 2012 to 2014 (p < 0.05). **Proportion in this region significantly changed from survey year 2012 to 2014 (p < 0.01).
3.4. Changes in decisions for specific vaccines
U.S. population estimates for intentional and ongoing delay and refusal of specific recommended childhood vaccines are displayed in Fig. 2. These include only those parents who were sure they had refused, or delayed but not refused, the indicated vaccination for their youngest child. Fig. 2 also contains the proportion of parents who did not accept or indicate that they were actively catching up on all recommended vaccines, yet were unsure of their delay and/ or refusal status.
Fig. 2.
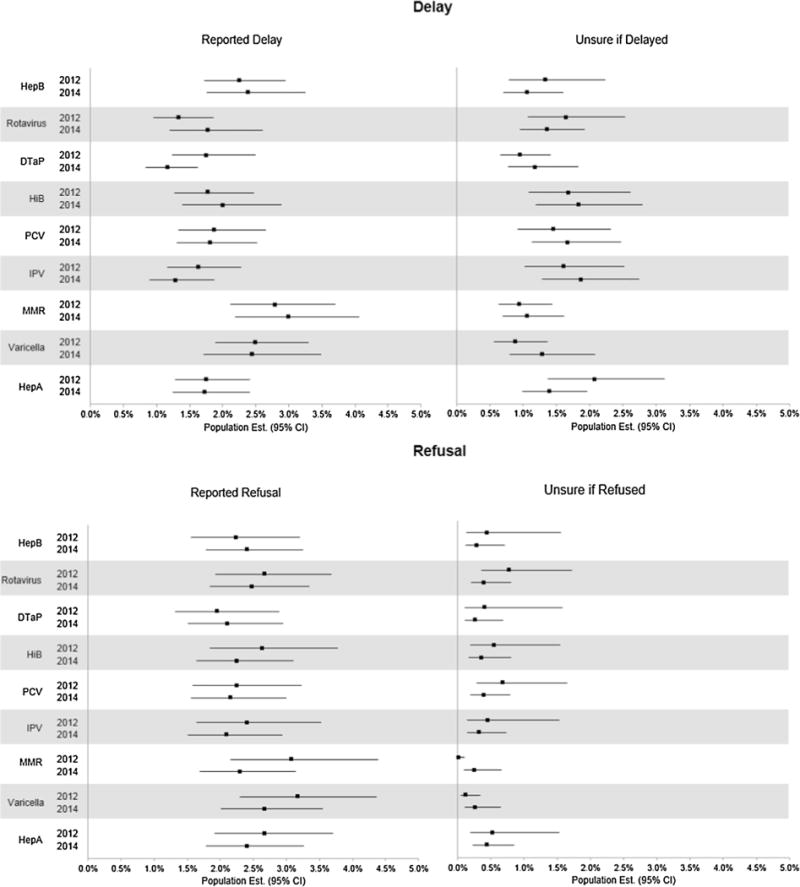
Immunization decisions regarding specific childhood vaccinations. CI = Confidence Interval. Reported Delay = Delayed, but did not refuse the indicated vaccine. Does not include participants who delayed the vaccine, but were unsure of refusal. Unsure of Delay = Unsure if delayed, and did not refuse, the specified vaccine. Includes those who delayed but were unsure of refusal. Reported Refusal = Refused the indicated vaccine. Unsure of Refusal = Unsure if refused the indicated vaccine.
No statistically significant change in intentional and ongoing delay or refusal was observed for any of the recommended childhood vaccinations between years. Refusal rates were relatively consistent between all 9 non-influenza vaccines. Most parents were more certain of their refusal decisions than delay decisions and of refusal of MMR and chickenpox than other vaccines. The least refused vaccines were DTaP, HepB, and PCV.
4. Discussion
While this study included data from only two rounds of surveys, our findings provide critically needed information on the extent of vaccine decision-making expressed by parents of children ages 0–6 years in the U.S. [3]. The results presented herein specifically address the National Vaccine Advisory Committee’s recommendation to draw upon existing data to measure vaccine decision-making over time and to detect any changes in geographic variation for which cities and states may construct appropriate response strategies [3,34]. Findings also reflect variability in parents’ vaccination decisions that have changed or remained the same from 2012 to 2014, both important public health concerns for stemming VPD vulnerability [12,35].
This study demonstrated stable and high estimates of acceptance of non-influenza childhood vaccines, a finding consistent with earlier findings from similar surveys of parents in 2010 and analyses of NIS data [18,36,37]. Also consistent with previous studies [10,18], estimates of parental delay and refusal of recommended vaccines were relatively low. Programs such as Vaccines for Children provide coverage for recommended childhood immunizations for eligible children that may be sustaining high rate stability over time [37].
Our findings highlight that delay of recommended vaccines remained stable while refusal decreased, primarily in parents of older children (2–6 years) in contrast to younger children (0–1 years), for whom rates of refusal were similar at both time points. No significant changes in intentional delay and refusal of specific vaccines were observed. Given that prior to 2012 there was evidence of increase in vaccine refusal at school entry, our findings are encouraging [38]. The decreases observed in refusal may be reflective of more vigorous vaccine promotion at the state level in recent years to decrease use of nonmedical philosophical and religious exemptions [5,39,40].
We also found some regional changes in parental vaccination decisions. Vaccine acceptance in the Southern U.S. increased in 2014 compared to 2012, with a corresponding decrease in refusal. Such changes may be reflective of improvements in immunization delivery systems and reduction of allowable exemptions in most Southern states [37,41].
In the Northeast, however, decisions to delay increased, although there was no statistically significant change in refusal. No other regional level changes were observed at these time points. Notably, these states have become more active in addressing immunization challenges like intentional delay in the wake of these findings. From 2015 through present, several states in this region (Maine, Rhode Island, Vermont, New York) have introduced legislation aimed at improving childhood vaccination rates via introduction of affidavits and written documentation requirements for allowable nonmedical exemptions for primary and secondary school entrance [42–49]. Future analyses of reported childhood immunization may be able to detect improvements in coverage following enactment of these state exemption requirements.
It is important to note these regional differences and changes, such as vaccine refusal [50] tends to cluster geographically; identifying these regional differences and decisional changes over time can help target interventions [51]. Thus, fostering collaboration with local level coalitions, physicians, and health systems, who are best equipped to recognize their community issues and intervention research that focus on community, are key to address regional vaccine hesitancy and refusal.
Given the evidence of movement away from intentional refusal but relatively stable prevalence of intentional delay, new approaches may be needed to address this shift [17,52,53]. Many studies have identified possible barriers to vaccination; however, there are few effective evidence-based interventions that address the nature of vaccine behavior and the heterogeneity of parental concerns represented in the decision-making spectrum [15,54,55]. Our findings highlight the need to design educational interventions to address greater delay with respect to MMR, HepB, and chickenpox vaccines and greater refusal of DTaP, HepB, and PCV vaccines. Thus, maintaining high childhood coverage rates and addressing those with lower vaccine acceptance will require a move away from a “one-size-fits-all” approach toward more targeted approaches tailored to the needs of parents with an array of immunization positions [56].
4.1. Limitations
Study findings are subject to several potential limitations including exclusion of those parents <18 years. We recognize that several sources of bias limit the ability of self-reported vaccination decisions to represent actual vaccination behavior, including recall, response, and social desirability bias. Post-stratification weights were applied to mitigate selection bias associated with low response rates. We did not directly assess systemic differences between participant demographics and that of the broader parent population of children <7 years. We also may have missed those distrustful of the government and its surveys. However, our findings are similar to those of NIS [1,14], and our main outcome of intentional delay/refusal is not routinely captured in that survey (2011 NIS Parental Concerns Module) [57]. Nonetheless, subsequent analyses of NIS data may offer additional insight on longitudinal trends not observable with the data utilized for these analyses.
Some children may not have yet reached the age to receive some vaccines. However, most recommended series start before 12 months, with the exception of MMR, chickenpox, and HepA (12 months). Thus, a large majority of our sample has children of age to have begun the series for the majority of all recommended vaccines. Parents without children <12 years were treated using two models (missing and considering their youngest child to be 0–1). These assumptions may not be valid for all of those parents, but the comparison of the two models verified stability of estimates.
Finally, not all vaccines are given each year and some reported delays and refusals may have happened years prior to the survey, potentially influencing the stability of delay and refusal rates. However, several vaccines and boosters are recommended for children up to age 6, so there are continuing opportunities for delay and refusal and to catch up on vaccines. Thus, estimates can reflect potential changes in vaccination behavior and intentions.
5. Conclusions
Between 2012 and 2014, there was a slight decrease in intentional ongoing refusal (refusal of at least one recommended non- influenza vaccine) among parents of older children (2–6 years) but not younger children (0–1 years). Also, no significant change was observed in the acceptance or ongoing intentional delay of recommended non-influenza vaccines in both age groups. Significant differences were observed among subcategories of acceptors and refusers. No significant changes were observed in intentional delay or refusal of any of the specific childhood immunizations. Acceptance, delay, and refusal were stable among parents of children age 0–1. In the South, acceptance increased while refusal decreased. In the Northeast, delay increased but not refusal. These findings suggest that existing immunization promotion programs (e.g., one-on-one discussions with practice-designated vaccine champions who are skilled vaccine communicators) are a successful strategy in promoting local vaccination. Yet, additional strategies are needed to address vaccine acceptance, particularly at the state and local level.
Acknowledgments
We wish to thank the parents and guardians who responded to our poll and to the staff of FHI360, Westat, and GfK for their support during the implementation of this study.
Source of funding
This research was supported in part by a grant from the U.S. Centers for Disease Control and Prevention (CDC) and an appointment to the Research Participation Program at the CDC administered by the Oak Ridge Institute for Science and Education through an interagency agreement between the US Department of Energy and CDC. The findings and conclusions in this article are those of the authors and do not necessarily represent the official position of the Centers for Disease Control and Prevention.
Footnotes
Conflicts of interest
The authors report no conflicts of interest exist for this study.
References
- 1.Elam-Evans LD, Yankey D, Singleton JA, Kolasa M. National, state, and selected local area vaccination coverage among children aged 19–35 months – United States, 2013. MMWR Morb Mortal Wkly Rep. 2014;63(34):741–8. [PMC free article] [PubMed] [Google Scholar]
- 2.Smith PJ, Kennedy AM, Wooten K, Gust DA, Pickering LK. Association between health care providers’ influence on parents who have concerns about vaccine safety and vaccination coverage. Pediatrics. 2006;118(5):e1287–92. doi: 10.1542/peds.2006-0923. [DOI] [PubMed] [Google Scholar]
- 3.Orenstein WA, Gellin BG, Beigi RH, et al. Assessing the state of vaccine confidence in the United States: recommendations from the National Vaccine Advisory Committee. Public Health Rep. 2015;130(6):573–95. doi: 10.1177/003335491513000606. [DOI] [PMC free article] [PubMed] [Google Scholar]
- 4.Phadke VK, Bednarczyk RA, Salmon DA, Omer SB. Association between vaccine refusal and vaccine-preventable diseases in the United States: a review of measles and pertussis. JAMA. 2016;315(11):1149–58. doi: 10.1001/jama.2016.1353. [DOI] [PMC free article] [PubMed] [Google Scholar]
- 5.Omer SB, Enger KS, Moulton LH, Halsey NA, Stokley S, Salmon DA. Geographic clustering of nonmedical exemptions to school immunization requirements and associations with geographic clustering of pertussis. Am J Epidemiol. 2008;168(12):1389–96. doi: 10.1093/aje/kwn263. [DOI] [PubMed] [Google Scholar]
- 6.Glanz JM, McClure DL, Magid DJ, et al. Parental refusal of pertussis vaccination is associated with an increased risk of pertussis infection in children. Pediatrics. 2009;123(6):1446–51. doi: 10.1542/peds.2008-2150. [DOI] [PubMed] [Google Scholar]
- 7.Glanz JM, McClure DL, Magid DJ, Daley MF, France EK, Hambidge SJ. Parental refusal of varicella vaccination and the associated risk of varicella infection in children. Arch Pediatr Adolesc Med. 2010;164(1):66–70. doi: 10.1001/archpediatrics.2009.244. [DOI] [PubMed] [Google Scholar]
- 8.Bisgard KM, Rhodes P, Connelly BL, et al. Pertussis vaccine effectiveness among children 6 to 59 months of age in the United States, 1998–2001. Pediatrics. 2005;116(2):e285–94. doi: 10.1542/peds.2004-2759. [DOI] [PubMed] [Google Scholar]
- 9.Gust DA, Darling N, Kennedy A, Schwartz B. Parents with doubts about vaccines: which vaccines and reasons why. Pediatrics. 2008;122(4):718–25. doi: 10.1542/peds.2007-0538. [DOI] [PubMed] [Google Scholar]
- 10.Dempsey AF, Schaffer S, Singer D, Butchart A, Davis M, Freed GL. Alternative vaccination schedule preferences among parents of young children. Pediatrics. 2011;128(5):848–56. doi: 10.1542/peds.2011-0400. [DOI] [PubMed] [Google Scholar]
- 11.Smith PJ, Humiston SG, Parnell T, Vannice KS, Salmon DA. Pub Health Rep. 4. Vol. 125. Washington, D.C: 1974: 2010. The association between intentional delay of vaccine administration and timely childhood vaccination coverage; pp. 534–41. [DOI] [PMC free article] [PubMed] [Google Scholar]
- 12.Gowda C, Dempsey AF. The rise (and fall?) of parental vaccine hesitancy. Hum Vaccines Immunotherapeutics. 2013;9(8):1755–62. doi: 10.4161/hv.25085. [DOI] [PMC free article] [PubMed] [Google Scholar]
- 13.Nadeau JA, Bednarczyk RA, Masawi MR, et al. Vaccinating my way-use of alternative vaccination schedules in New York State. J Pediatr. 2015;166(1):151–6.e151. doi: 10.1016/j.jpeds.2014.09.013. [DOI] [PubMed] [Google Scholar]
- 14.Hill HA, Elam-Evans LD, Yankey D, Singleton JA, Kolasa M. National, state, and selected local area vaccination coverage among children aged 19–35 months – United States, 2014. MMWR Morb Mortal Wkly Rep. 2015;64(33):889–96. doi: 10.15585/mmwr.mm6433a1. [DOI] [PubMed] [Google Scholar]
- 15.ASTHO. Communicating effectively about vaccines: summary of a survey of U. S. Parents and Guardians. Arlington, VA: Association of State and Territorial Health Officials; 2010. [Google Scholar]
- 16.Freed GL, Clark SJ, Butchart AT, Singer DC, Davis MM. Parental vaccine safety concerns in 2009. Pediatrics. 2010;125(4):654–9. doi: 10.1542/peds.2009-1962. [DOI] [PubMed] [Google Scholar]
- 17.Smith PJ, Humiston SG, Marcuse EK, et al. Pub Health Rep. Suppl 2. Vol. 126. Washington, DC.: 1974: 2011. Parental delay or refusal of vaccine doses, childhood vaccination coverage at 24 months of age, and the Health Belief Model; pp. 135–46. [DOI] [PMC free article] [PubMed] [Google Scholar]
- 18.McCauley MM, Kennedy A, Basket M, Sheedy K. Exploring the choice to refuse or delay vaccines: a national survey of parents of 6- through 23-month-olds. Acad Pediatr. 2012;12(5):375–83. doi: 10.1016/j.acap.2012.06.007. [DOI] [PubMed] [Google Scholar]
- 19.Jacobson RM, St Sauver JL, Finney Rutten LJ. Vaccine hesitancy. Mayo Clin Proc. 2015;90(11):1562–8. doi: 10.1016/j.mayocp.2015.09.006. [DOI] [PubMed] [Google Scholar]
- 20.Measles – United States, January 1–August 24, 2013. MMWR. Morbidity and mortality weekly report. 2013;62(36):741–743. [PMC free article] [PubMed] [Google Scholar]
- 21.Winter K, Glaser C, Watt J, Harriman K. Pertussis epidemic – California, 2014. MMWR Morb Mortal Wkly Rep. 2014;63(48):1129–32. [PMC free article] [PubMed] [Google Scholar]
- 22.Cardemil CV, Cullen KA, Harris L, Greby SM, Santibanez TA. Factors associated with provider reporting of child and adolescent vaccination history to immunization information systems: results from the National Immunization Survey, 2006–2012. J Pub Health Manage Pract: JPHMP. 2016;22(3):245–54. doi: 10.1097/PHH.0000000000000278. [DOI] [PMC free article] [PubMed] [Google Scholar]
- 23.Shaw KM, Santibanez TA, Chu SY. Asian and Pacific Islander childhood vaccination coverage: National Immunization Survey, 2002–2004. Ethnicity Dis. 2008;18(1):72–6. [PubMed] [Google Scholar]
- 24.Smith PJ, Hoaglin DC, Battaglia MP, et al. Statistical methodology of the National Immunization Survey, 1994–2002. Vital Health Stat Ser 2, Data Eval Methods Res. 2005;138:1–55. [PubMed] [Google Scholar]
- 25.GfK. KnowledgePanel Design Summary. 2013 < http://www.knowledgenetworks.com/knpanel/docs/knowledgepanel(R)-design-summary-description.pdf> [accessed Feb 25, 2016.
- 26.Knowledge Networks. Update: Address-based Sampling Nets Success for KnowledgePanel® Recruitment and Sample Representation. 2010 < http://www.knowledgenetworks.com/accuracy/spring2010/pdf/disogra-spring10.pdf> [accessed July 19, 2016]
- 27.Knowledge Networks. KnowledgePanel® Demographic Profile February 2012. 2012 < http://www.knowledgenetworks.com/knpanel/docs/GfK-KnowledgePanel(R)-Demographic-Profile.pdf> [accessed July 19, 2016]
- 28.Deville J-C, Särndal C-E, Sautory O. Generalized raking procedures in survey sampling. J Am Stat Assoc. 1993;88(423):1013–20. [Google Scholar]
- 29.US Census Bureau. American Community Survey (ACS) 2016 < https://www.census.gov/programs-surveys/acs/> [accessed July 19, 2016]
- 30.Orenstein WA, Hinman AR. The immunization system in the United States – the role of school immunization laws. Vaccine. 1999;17(Suppl 3):S19–24. doi: 10.1016/s0264-410x(99)00290-x. [DOI] [PubMed] [Google Scholar]
- 31.CDC. Recommended Immunizations for Children from Birth Through 6 Years Old. 2015;2015 < http://www.cdc.gov/vaccines/parents/downloads/parent-ver-sch-0-6yrs.pdf> [accessed Jan 28, 2016] [Google Scholar]
- 32.Allison MA, Reyes M, Young P, et al. Parental attitudes about influenza immunization and school-based immunization for school-aged children. Pediatr Infect Dis J. 2010;29(8):751–5. doi: 10.1097/INF.0b013e3181d8562c. [DOI] [PubMed] [Google Scholar]
- 33.US Census Bureau. Census Bureau Regions and Divisions with State FIPS Codes. 2016 < http://www2.census.gov/geo/pdfs/maps-data/maps/reference/us_regdiv.pdf> [accessed July 30, 2016]
- 34.Findley SE, Irigoyen M, Stockwell MS, Chen S. Changes in childhood immunization disparities between central cities and their respective states, 2000 versus 2006. J Urban Health. 2009;86(2):183–95. doi: 10.1007/s11524-008-9337-0. [DOI] [PMC free article] [PubMed] [Google Scholar]
- 35.Funkhouser AW, Wassilak SG, Orenstein WA, Hinman AR, Mortimer EA., Jr Estimated effects of a delay in the recommended vaccination schedule for diphtheria and tetanus toxoids and pertussis vaccine. JAMA. 1987;257(10):1341–6. [PubMed] [Google Scholar]
- 36.Centers for Disease Control and Prevention. National, state, and local area vaccination coverage among children aged 19-35 months – United States, 2011. MMWR Morb Mortal Wkly Rept. 2012;61:689. [PubMed] [Google Scholar]
- 37.Centers for Disease Control and Prevention. National, state, and local area vaccination coverage among children aged 19–35 months-United States, 2012. MMWR Morb Mortal Wkly Rep. 2013;62(36):733. [PMC free article] [PubMed] [Google Scholar]
- 38.Omer SB, Orenstein WA, Koplan JP. Go big and go fast–vaccine refusal and disease eradication. New Engl J Med. 2013;368(15):1374–6. doi: 10.1056/NEJMp1300765. [DOI] [PubMed] [Google Scholar]
- 39.Omer SB, et al. Vaccination policies and rates of exemption from immunization, 2005–2011. New Engl J Med. 2012;367(12):1170–1. doi: 10.1056/NEJMc1209037. [DOI] [PMC free article] [PubMed] [Google Scholar]
- 40.Salmon DA, Haber M, Gangarosa EJ, Phillips L, Smith NJ, Chen RT. Health consequences of religious and philosophical exemptions from immunization laws: individual and societal risk of measles. JAMA. 1999;282(1):47–53. doi: 10.1001/jama.282.1.47. [DOI] [PubMed] [Google Scholar]
- 41.Orenstein WA, Hinman AR. The immunization system in the United States— the role of school immunization laws. Vaccine. 1999;17:S19–24. doi: 10.1016/s0264-410x(99)00290-x. [DOI] [PubMed] [Google Scholar]
- 42.Dakin RL, translator. An act relating to the removal of the philosophical and religious immunization exemptions. 11222015. [Google Scholar]
- 43.Mullin SK, translator. An act relating to removal of the philosophical immunization exemption. 11222015. [Google Scholar]
- 44.Sen Raptakis K, Lombardi, Morgan, Jabour, translators. An act relating to education – offenses pertaining to schools. 16-38-22016. [Google Scholar]
- 45.Sens Gianaris A, Hoylman, Stavisky, translators. An act to amend the public health law, in relation to the religious exemption from mandatory immunization of a child. 6:2015–2016. ed2015. [Google Scholar]
- 46.Dilan S, translator. Philosophical exemption to immunizations act. 6:2015–2016. ed2015. [Google Scholar]
- 47.Simotas MoA., translator. An act to amend the public health law, in relation to the religious exemption from mandatory immunization of a child. 9:2015–2016. ed2015. [Google Scholar]
- 48.Abinanti C, Kolb, Clark, Arroyo, McDonough, Thiele, translators. An act to amend the public health law, in relation to enacting the “philosophical exemption to immunizations act”. M. of A. 6:2015–2016. ed2015. [Google Scholar]
- 49.Sanborn F, Katz, Burstein, Gattine, Head, Hubbell, Jorgensen, Nutting, Dill, Haskell, translators. An act to improve childhood vaccination rates in Maine. Rep. 2015. pp. 6355–6359. 20-A MRSA. ed2015. [Google Scholar]
- 50.Assessing the State of Vaccine Confidence in the United States: Recommendations from the National Vaccine Advisory Committee: Approved by the National Vaccine Advisory Committee on June 10, 2015. Public Health Reports. 6. Vol. 130. Washington, D.C: 1974: 2015. pp. 573–595. [DOI] [PMC free article] [PubMed] [Google Scholar]
- 51.Lieu TA, Ray GT, Klein NP, Chung C, Kulldorff M. Geographic clusters in underimmunization and vaccine refusal. Pediatrics. 2015;135(2):280–9. doi: 10.1542/peds.2014-2715. [DOI] [PubMed] [Google Scholar]
- 52.Leask J, Willaby HW, Kaufman J. The big picture in addressing vaccine hesitancy. Hum Vaccines Immunotherapeutics. 2014;10(9):2600–2. doi: 10.4161/hv.29725. [DOI] [PMC free article] [PubMed] [Google Scholar]
- 53.Glanz JM, Wagner NM, Narwaney KJ, et al. A mixed methods study of parental vaccine decision making and parent-provider trust. Acad Pediatr. 2013;13(5):481–8. doi: 10.1016/j.acap.2013.05.030. [DOI] [PMC free article] [PubMed] [Google Scholar]
- 54.Williams SE. What are the factors that contribute to parental vaccine-hesitancy and what can we do about it? Hum Vaccines Immunotherapeutics. 2014;10(9):2584–96. doi: 10.4161/hv.28596. [DOI] [PMC free article] [PubMed] [Google Scholar]
- 55.Sadaf A, Richards JL, Glanz J, Salmon DA, Omer SB. A systematic review of interventions for reducing parental vaccine refusal and vaccine hesitancy. Vaccine. 2013;31(40):4293–304. doi: 10.1016/j.vaccine.2013.07.013. [DOI] [PubMed] [Google Scholar]
- 56.Salmon DA, Dudley MZ, Glanz JM, Omer SB. Vaccine hesitancy: causes, consequences, and a call to action. Vaccine. 2015;33:D66–71. doi: 10.1016/j.vaccine.2015.09.035. [DOI] [PubMed] [Google Scholar]
- 57.CDC. NIS-Child Hard Copy Questionnaire. 2011 < http://ftp.cdc.gov/pub/Health_Statistics/NCHS/Dataset_Documentation/NIS/NISPUF11_HHQuex.pdf>.