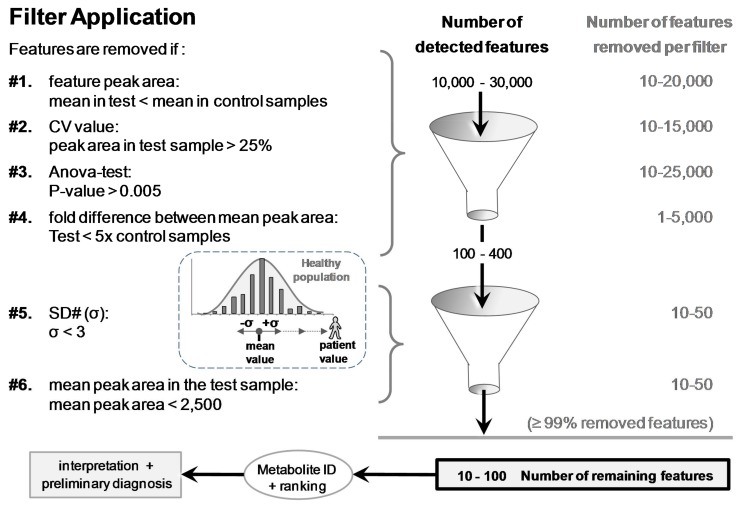
Figure 4.
The six filters used to discard ≥99% of the >10,000 detected features. Remaining features were eventually ranked based on SD# and mean peak area values prior to putative identifications and biomedical interpretations. SD# value was calculated with the following equation: SD# of feature f = [(|peak areafmean in test sample − peak areafmean in control group|)/(SD of control group)]. It corresponds to the distance, as a number of [σ] (=SD#), between the peak area mean of the test and the peak area mean of the control samples (e.g., samples of a patient and a healthy population).

