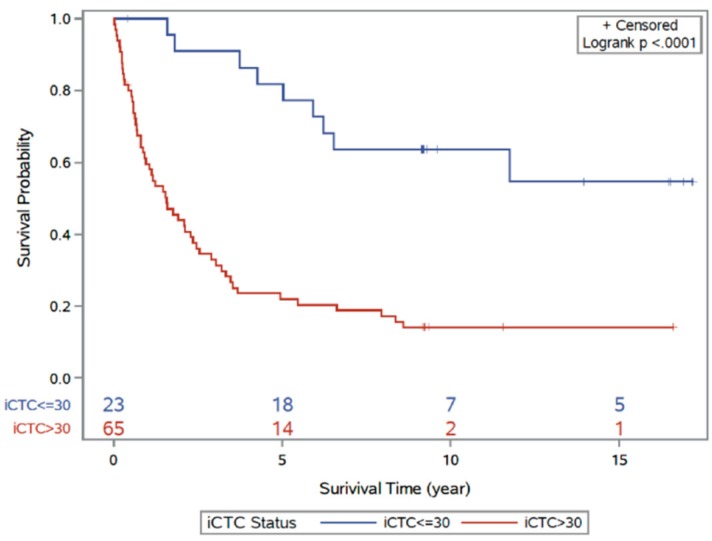
Figure 4.
Kaplan–Meier curve analysis for disease outcome according to high-iCTC-count groups and low-iCTC-count groups using optimal iCTC cutoff point (≤30 iCTCs/mL vs. >30 iCTCs/mL). The two survival curves are significantly different (log-rank p-value < 0.001). The red line indicates the high iCTC count group; blue line indicates the low iCTC count group.

