Abstract
Statistical shape analysis captures the geometric properties of a given set of shapes, obtained from medical images, by means of statistical methods. Orthognathic surgery is a type of craniofacial surgery that is aimed at correcting severe skeletal deformities in the mandible and maxilla. Methods assuming spherical topology cannot represent the class of anatomical structures exhibiting complex geometries and topologies, including the mandible. In this paper we propose methodology based on non-rigid deformations of 3D geometries to be applied to objects with thin, complex structures. We are able to accurately and quantitatively characterize bone healing at the osteotomy site as well as condylar remodeling for three orthognathic surgery cases, demonstrating the effectiveness of the proposed methodology.
Index Terms: Complex topology, diffeomorphic shape registration, statistical shape modeling, statistical shape analysis, orthognathic surgery
1. INTRODUCTION
The goal of shape analysis studies is to capture the geometrical and statistical properties of a given set of shapes. This field is of interest to the biomedical community due to its potential to precisely locate morphological changes between two shapes, such as healthy and pathological structures, or to quantify the effects of treatment in a given structure(s). Methods such as Spherical Harmonic Representation of Point Distribution Models (SPHARM-PDM) [1], entropy-based particle systems [2] or skeletal representations (s-reps) [3] allow to accurately perform 3D statistical shape analysis on objects with spherical topology by computing a population of corresponding model surfaces. These methods have been valuable to biomedical research and have helped to characterize how anatomy changes due to treatment or disease. However, a large number of medical or biological objects are often composed of sharp features and regions of high curvatures. Methods such as SPHARM-PDM fail to clearly capture certain classes of anatomical structures presenting complex surfaces and change of topology, for example vertebrae, pelvic bones, mandibles or skulls.
Orthognathic surgery is a type of craniofacial surgery that is aimed at correcting severe skeletal deformities. These deformities are disabling and stigmatizing. Individuals with craniofacial deformities experience speech and masticatory problems as a result of their condition [4]. Orthognathic surgery often creates bony defects at the site of the surgical cuts. The defect heals and remodel with time depending on the location and size of defect. A morphometric assessment method which can evaluate the rate and extent of bony remodeling is crucial to understanding long-term surgical stability as well as complications resulting from these surgeries. In addition, improper relocation of the condyles and temporomandibular joint to its pre-operative position can lead to surgical relapse or condylar remodeling. Measuring and correlating the rate of condylar remodeling is important to understanding why some patients develop temporomandibular joint disorder after surgery. Existing shape analysis methods such as SPHARM-PDM or s-reps have not been able to properly densely represent mandibular shapes, due to its highly concave and thin shape.
In this paper we propose an alternative method based on non-rigid deformations of 3D geometries that can even be applied to objects of non-spherical topology as well as of highly complex shape. We will demonstrate its validity using three mandibular shapes obtained from patients that underwent orthognathic surgery.
2. MATERIALS
Three patients selected for the study had a history of temporomandibular joint disorder and severe skeletal disharmony. All patients underwent maxillo-mandibular advancement (MMA) with counterclockwise rotation. Patient 001 had genioplasty advancement and anchored mini-implants placed into their condylar head, patient 002 had anchored mini-implants, and patient 003 had genioplasty advancement.
Cone Beam Computed Tomography (CBCT) scans were taken using the ICAT (Imaging Sciences International, Hart-field, PA) with a voxel resolution of 0.3mm × 0.3mm × 0.3mm. CBCT scans were obtained before surgery (T1), after surgery (T2), completion of orthodontic treatment (T3) and 1–2 year follow-up (T4, T5, only in patient 001). All patients were instructed to bite into maximum intercuspation during the scan. All scans were evaluated to make sure the condyles were seated in the center of the fossa and patients were excluded from study if condyles were postured. No subjects were excluded for posturing during CBCT scan.
CBCT DICOM files were converted to an ITK [5] compatible format. Longitudinal scans were registered to T1 scans on the anterior cranial fossa using cranial-based registration methods [6] in 3DSlicer [7] and 3D semi-automated segmentation with ITK-SNAP [8].
3. METHODS
Shape correspondences are estimated by group-wise diffeomorphic shape registration. Given a population of N shapes Yi, the problem consists of jointly estimating a set of diffeomorphic transformations ϕi which minimize the following criterion:
| (1) |
given a prototype shape configuration X0, where W* is the norm on varifolds [9], Reg is a measure of regularity of the transformations ϕi (see [10] for more detail), and γ is a trade-off parameter which balances data-matching and regularity. The prototype shape configuration X0 defines the number of points in the resulting model as well as their distribution. Correspondence is guaranteed since a single X0 is diffeomorphically transported onto each observation Yi, so that the estimated shapes ϕi(X0) share the same parameterization. During optimization, the location of the vertices of X0 can either be fixed, or estimated by the iterative process.
Representing shapes as varifolds has several important benefits for estimating shape correspondence. The varifold representation limits the need for extensive preprocessing, as shapes in the population do not need a consistent sampling or topology. The varifold representation also robustly handles non-oriented shapes with thin features, which is a known limitation of oriented representations such as currents [11]. This method is implemented in Deformetrica [10].
Prototype shape configuration
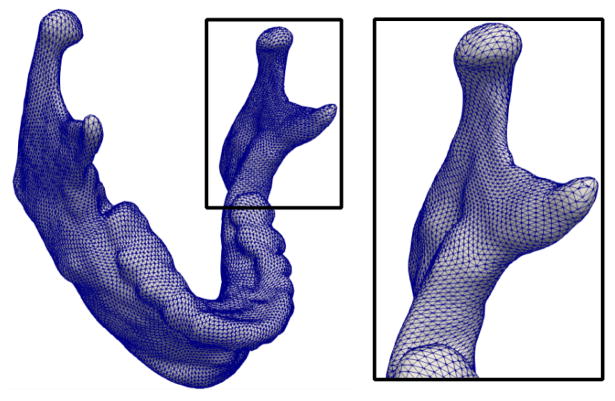
The prototype shape configuration X0 must be provided by the user. To ensure highly accurate correspondence, the prototype shape configuration should be densely sampled, particularly in areas of complex local geometry or high curvature, see Fig. 1 for an example. However, the sampling can be adaptive, with sparse sampling in areas of low curvature.
Fig. 1.
Example prototype shape for the full mandible, which defines the number of shape points and their distribution.
For objects with simple connected geometry, such as subcortical structures of the brain, an ellipsoid serves as an adequate initialization. However, shapes with complex geometry and topology will require a prototype shape configuration that is representative of the population. It is possible to choose one shape from the population as an initialization, which will be refined during estimation. However, the choice of initialization may bias the estimation. For our experiments, we computed a prototype shape configuration by unbiased atlas building [12] of the binary label maps, to estimate an average shape for initialization.
The prototype shape configuration also defines the topology of the final estimated model, as the diffeomorphic mappings cannot change topology. This makes the method robust to observations which contain small holes or missing pieces, since missing data will be effectively ‘filled in’ by the fact that the prototype shape configuration does not have such imperfections. This allows for the inclusion of more data and reduces the need for extensive preprocessing.
Parameter settings
The method has three main parameters. First, the kernel width controlling the non-linearity of the diffeomorphism. Second, the kernel width defining the metric properties of the space of varifolds. These two kernel widths have physical units defined by the data (e.g. mm) and can generally be set to a low value to prioritize highly non-linear deformations and very accurate data-matching. The third parameter, γ, controls the regularity of the diffeomorphisms. This can also be set to a low value to favor data-matching over regularity, or tuned empirically to find a balance which is reasonable for a given application. See [10, 13] for details about parameter selection.
4. EXPERIMENTAL VALIDATION
Shape correspondence
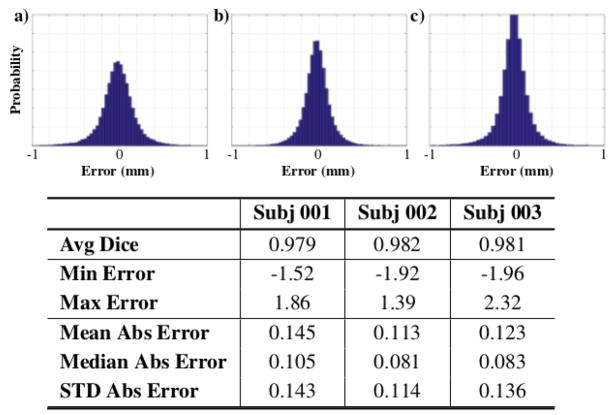
We compute corresponding and densely sampled surface representations for our set of three orthognathic surgery patients to accurately detect surgical movements before and after surgery, as well as to quantify bone healing and condylar remodeling changes. In order to confirm the likeness between the estimated shapes and the original observations, different closest point errors between the estimated corresponding shapes and the original observations have been computed for each patient. The bottom of Fig. 2 shows that average errors for all the observations of all patients is below sub-millimeter accuracy.
Fig. 2.
Normalized histograms of surface error (mm) between the estimated shapes and original observations for patient datasets a) 001 b) 002 and c) 003.
Full error distributions (Fig. 2) show that the amount of gross errors in the reconstructed surfaces is very small, with the majority of the errors tightly distributed around 0mm. These histograms are computed for all surfaces of each dataset. In addition to reconstruction errors, the estimated correspondence model for three observations of subject 002 is shown in Fig. 3 to illustrate accurate correspondences.
Fig. 3.
Surfaces colored by vertex location for three observations of patient 002 which show accurate correspondence, even in the presence of dramatic changes due to surgery.
Shape analysis
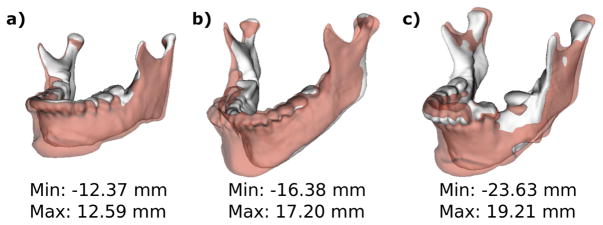
Gross surgical movements between pre-surgery (T1) and post-surgery (T2) semitransparency models are shown in Fig. 4 for each patient. Surgical movements clearly show the displacement obtained through the surgical maxillo-mandibular advancement (MMA).
Fig. 4.
Semi-transparencies of pre-surgical (T1) models in solid white and post-surgical (T2) models in transparent red for patients a) 001 b) 002 and c) 003.
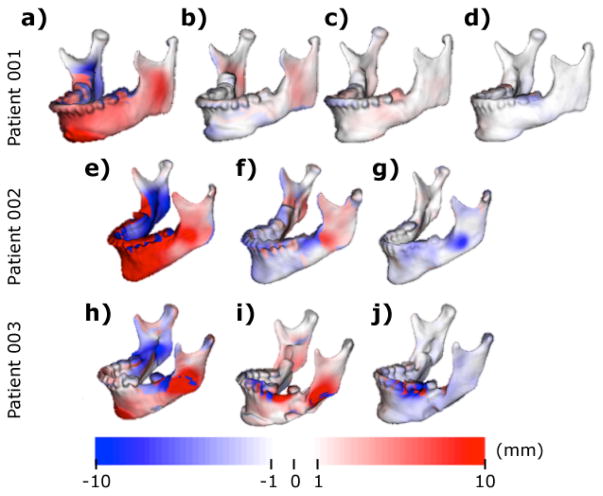
MMA aims to bring skeletal occlusions back to alignment by moving the mandible forward and rotating it back. Further quantitative information is displayed in Fig. 5. The range of the distance maps has been clamped to the [−10,10] mm range to establish parallelisms between patients. Signed distance maps between each time point of each patient reflect bone advancement in red (positive) in the front face of the mandibular bone paired with blue (negative) in the back face of the mandibular bone. Bone apposition (red) and resorption (blue) are also displayed.
Fig. 5.
Signed corresponding distance computed between a-e-h) T1 and T2 shapes, displayed on T1, b-f-i) T2 and T3, displayed on T2, c-f-i) T3 and T4, displayed on T3 and d) T4 and T5, displayed on T4
All patients show the MMA movements in the distances computed between T1 and T2, bone filling in the osteotomy cuts between T2 and T3, and some degree of condylar remodeling/displacement between T3 and T4/T5. Measurements were made using ModelToModelDistance [14], a surface to surface distance plugin in 3DSlicer.
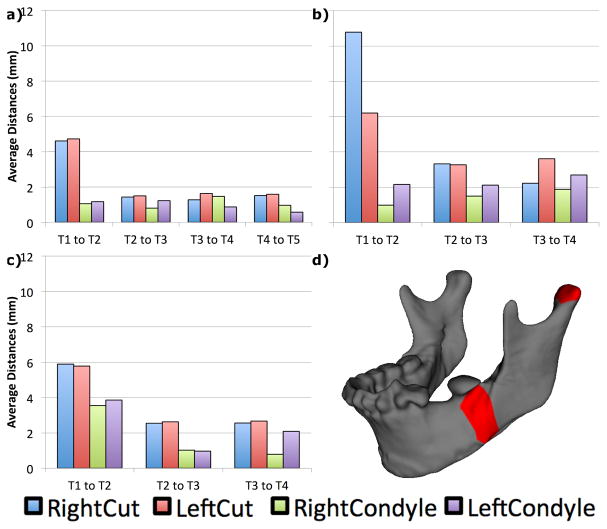
Localized remodeling data was calculated thanks to the Pick n’ Paint [15] and the Mesh Statistics [16] plugins of 3DSlicer. We selected 4 landmarks in the left and right surgical osteotomies and left and right condyles. Regions of interest (ROI) were computed around each landmark and extended in a neighborhood of 10 edges each, and also propagated to each time point per patient. Results for each ROI are displayed in Fig. 6. Our method accurately calculates the average magnitude of remodeling and displacement in condyles and osteotomy areas for each time interval. The plots capture the surgical movements between T1 and T2, as well bone healing illustrated by decreased remodeling rate in future time intervals (from completion of orthodontics treatment in T3 to stability follow ups in T4 and T5). Although the magnitude of condylar remodeling is much smaller than the osteotomy areas, it is possible to see that mandibular condyles do not remain stable after orthognathic surgery, especially between T3 to T4 time interval for all patients.
Fig. 6.
Average remodeling/displacements in each time interval for patients a) 001 b) 002, c) 003 and d) ROI marked in red for right condyle and osteotomy areas of one of the patients.
5. CONCLUSIONS
In this paper, we estimate densely sampled corresponding mandibular shapes via group-wise diffeomorphic shape registration. Our method is capable of handling complex shapes with varying topology. We showed that our estimated models are highly accurate in matching the original geometry of the shapes, as well producing precise correspondence. The method was applied to measure the effects of maxillo-mandibular advancement (MMA) in the mandibular bone. Other shape methods oriented to spherical topology objects [1, 2, 3] have failed to properly represent mandibular shapes due to their highly concave and thin geometry. This has hindered discoveries in fields like orthognathic surgery, which depend on highly accurate representations of mandibular shape in order to understand and correlate the rate of condylar remodeling. Future steps include packaging the method into SlicerSALT [17], our new open source shape analysis software, for free and wide dissemination.
Acknowledgments
Supported by grant NIH NIBIB R01EB021391 (SlicerSALT) and the New York Center for Advanced Technology in Telecommunications (CATT).
References
- 1.Styner M, et al. Framework for the statistical shape analysis of brain structures using spharm-pdm. Insight journal. 2006;(1071):242. [PMC free article] [PubMed] [Google Scholar]
- 2.Cates J, et al. Shape modeling and analysis with entropy-based particle systems. IPMI. 2007:333–345. doi: 10.1007/978-3-540-73273-0_28. [DOI] [PMC free article] [PubMed] [Google Scholar]
- 3.Tu L, et al. Fitting skeletal object models using spherical harmonics based template warping. IEEE Signal Proc Letters. 2015;22(12):2269–2273. doi: 10.1109/LSP.2015.2476366. [DOI] [PMC free article] [PubMed] [Google Scholar]
- 4.Proffit W, et al. Prevalence of malocclusion and orthodontic treatment need in the united states: estimates from the nhanes iii survey. The International journal of adult orthodontics and orthognathic surgery. 1997;13(2):97–106. [PubMed] [Google Scholar]
- 5.McCormick M, et al. Itk: enabling reproducible research and open science. Frontiers in Neuroinformatics. 2014;8:13. doi: 10.3389/fninf.2014.00013. [DOI] [PMC free article] [PubMed] [Google Scholar]
- 6.Boen V, et al. CMFReg Extension. www.slicer.org/slicerWiki/index.php/Documentation/Nightly/Extensions/CMFreg.
- 7.3DSlicer. www.slicer.org.
- 8.Yushkevich PA, et al. User-guided 3D active contour segmentation of anatomical structures: Significantly improved efficiency and reliability. Neuroimage. 2006;31(3):1116–1128. doi: 10.1016/j.neuroimage.2006.01.015. [DOI] [PubMed] [Google Scholar]
- 9.Charon N, Trouvé A. The varifold representation of nonoriented shapes for diffeomorphic registration. SIAM Journal of Imaging Sciences. 2013;6(4):2547–2580. [Google Scholar]
- 10.Durrleman S, et al. Morphometry of anatomical shape complexes with dense deformations and sparse parameters. NeuroImage. 2014;101:35–49. doi: 10.1016/j.neuroimage.2014.06.043. [DOI] [PMC free article] [PubMed] [Google Scholar]
- 11.Vaillant M, Glaunès J. Surface matching via currents. IPMI. 2005:381–392. doi: 10.1007/11505730_32. vol. 3565 of LNCS. [DOI] [PubMed] [Google Scholar]
- 12.Avants B, et al. A reproducible evaluation of ants similarity metric performance in brain image registration. Neuroimage. 2011;54(3):2033–2044. doi: 10.1016/j.neuroimage.2010.09.025. [DOI] [PMC free article] [PubMed] [Google Scholar]
- 13.Fishbaugh J, et al. Geodesic shape regression with multiple geometries and sparse parameters. MEDIA. 2017;39:1–17. doi: 10.1016/j.media.2017.03.008. [DOI] [PMC free article] [PubMed] [Google Scholar]
- 14.Budin F, et al. ModelToModelDistance Extension. www.slicer.org/wiki/Documentation/Nightly/Extensions/ModelToModelDistance.
- 15.Macron L, et al. Pick ’n Paint Extension. www.slicer.org/wiki/Documentation/Nightly/Extensions/PickAndPaint.
- 16.Macron L, et al. Mesh Statistics Extension. www.slicer.org/wiki/Documentation/Nightly/Extensions/MeshStatistics.
- 17.Kitware. SlicerSALT. salt.slicer.org.


