

Abstract
Background:
Fatigue is reported by more than 75% of multiple sclerosis (MS) patients. In an earlier study, we showed that fatigue is not only a common symptom in patients at time of clinically isolated syndrome (CIS; fatigued 46%) but also predicts subsequent diagnosis of clinically definite multiple sclerosis (CDMS). The course of fatigue after CIS is unknown.
Objective:
We aimed to explore the long-term course of fatigue after CIS.
Methods:
In this study, 235 CIS patients, aged 18–50 years, were prospectively followed. Patients filled in the Krupp’s Fatigue Severity Scale (FSS) and the Hospital Anxiety and Depression Scale (HADS) at baseline and annually. After reaching CDMS diagnosis, Expanded Disability Status Scale (EDSS) was obtained annually. Mixed-effects models were used to analyse longitudinal FSS measurements.
Results:
Fatigue at baseline was an independent predictor for CDMS diagnosis (hazard ratio (HR): 2.6, 95% confidence interval (CI): 1.6–4.4). The evolution of FSS was the same in CIS patients who remained monophasic and patients who were diagnosed with CDMS during follow-up. However, FSS increased by 0.86 units after reaching CDMS diagnosis (p = 0.01). After this increase, the FSS course remained unaltered (p = 0.44).
Conclusion:
Fatigue, which is often present at time of CIS, probably persists over time and increases after a second attack.
Keywords: Clinically isolated syndrome, CIS, multiple sclerosis, early MS, fatigue, prognosis
Introduction
Fatigue is a common symptom in multiple sclerosis (MS), reported by more than 75% of patients,1–3 and it is described as the most debilitating symptom by 15%–40% of MS patients.4 In MS, fatigue is defined as ‘a subjective lack of physical and/or mental energy, perceived by the individual or caregiver to interfere with usual and desired activities’.5
The pathophysiological mechanisms of MS-related fatigue are not yet fully understood. Fatigue can result from MS-related symptoms such as sleep deprivation, MS-related neuro-psychiatric disorders such as depression and anxiety, and side effects of medication (secondary fatigue),6,7 but fatigue can also be the direct result of MS-related pathophysiological processes such as inflammation, demyelination and axonal loss (primary fatigue).6,7 Several studies also indicated an independent relation between inflammation and fatigue.8,9 In a previous study, we showed that fatigue was present in 46% of patients at time of the first attack, independent of the neuroanatomical localization of this first attack, with a severity similar to fatigue in patients with MS.10 This indicates that the MS-related fatigue presents itself already early in the disease at the moment of the first symptoms, not related to the attack itself. Few relatively short-term studies in patients diagnosed with MS suggested that fatigue persists over time. Those studies had a maximum follow-up of 3 years.1,11–14 The long-term course of fatigue after clinically isolated syndrome (CIS) is not known. The aim of this study was to explore the course of fatigue, during follow-up after CIS. The second aim was to study the association between fatigue at time of CIS and disability after a second clinical attack.
Methods
Patients
All patients with CIS, a suspected first episode of MS, who visited Erasmus Medical Centre (EMC) University Hospital in Rotterdam, a tertiary referral centre for MS or one of the collaborating regional hospitals, were enrolled in this study. All the patients were included and followed between July 2006 and December 2015 in the multicentre prospective observational study on Predicting the Outcome of a Demyelinating event (PROUD study). Study protocols have been described previously.10 Patients were between 18 and 50 years of age and were included in the study within 6 months after the onset of CIS. At baseline, patients underwent a magnetic resonance imaging (MRI) scan and routine laboratory tests to rule out alternative diagnoses.15 Patients with alternative diagnoses and patients who suffered from life-threatening comorbidities (i.e. malignancies, AIDS) were excluded. Patients with comorbidities likely to cause fatigue, other than depression, were excluded from the analyses. After inclusion, patients were reassessed annually.
Definitions
An exacerbation was defined as new symptoms or subacute worsening of existing symptoms after 30 days of improvement or stable disease and no evidence of alternative diagnosis.16 To be regarded as exacerbation, symptoms had to exist for longer than 24 hours and not to be preceded by fever.17 All exacerbations were confirmed by neurological examination. Clinically definite multiple sclerosis (CDMS) was defined as clinical dissemination in space and time as described by Poser et al.17 Disability was measured using the Expanded Disability Status Scale (EDSS).18 After a diagnosis of CDMS, EDSS was obtained at annual reassessments by a trained physician. In case of an exacerbation, the physicians made sure that an EDSS was obtained at least 3 months after the exacerbation.
Questionnaires
Krupp’s Fatigue Severity Scale (FSS) was used to assess fatigue.19 This self-administered questionnaire is validated for use in patients with MS.19–21 FSS consists of nine questions with seven possible answers for each question, ranging from strong disagreement to strong agreement. The FSS score ranges from 1 to 9; fatigue is defined as an FSS of 5.0 or higher.22
Hospital Anxiety and Depression Scale (HADS) was used to measure anxiety and depression.23 This is also a self-administered questionnaire that has been validated in MS patients.24 It contains seven items measuring symptoms of anxiety and seven items measuring symptoms of depression. For both anxiety and depression, a score of 11 points or higher (out of 21 points) was considered as being anxious or depressed. HADS was obtained at the same time as FSS to correct for depression and anxiety, as fatigue is associated with these factors.25,26 FSS and HADS were obtained at baseline and annually.
Standard protocol approvals and patient consent
This study was approved by the Medical Ethics Committee of Erasmus MC Rotterdam. Written informed consent was obtained from all patients.
Data analysis
Statistical analyses were done using SPSS version 21 (SPSS Inc., Chicago, IL, USA) for Windows, R statistical software version 3.2.4 and GraphPad Prism5 (GraphPad, San Diego, USA) for Windows. We compared continuous data using a two-tailed t-test (for age, follow-up time, time CIS to baseline FSS, FSS and HADS–Anxiety (HADS-A) at baseline) or a Mann–Whitney U-test (for HADS–Depression (HADS-D) and IgG index) if the data were not normally distributed. Chi-square or Fisher’s exact test was applied to analyse categorical data (gender, ethnicity, immunomodulating therapy (IMT), dichotomized FSS, clinical syndrome type, oligoclonal bands (OCB) and MRI features). Time to CDMS was calculated from the onset of the first symptoms to the second clinical attack (confirmed by a neurological examination). Patients who did not experience a second attack were considered as censored observations. Survival data were analysed using Kaplan–Meier survival analyses with log-rank test and univariable and multivariable Cox proportional hazard regression models. To analyse the longitudinal FSS measurements and to evaluate the association between baseline FSS and EDSS during follow-up, we used mixed-effects models. To model the time effect flexibly, we utilized natural cubic splines with two internal knots placed at the 33.3% and 66.6% percentiles of the observed follow-up times. In the linear mixed model used to analyse the longitudinal FSS measurements, we corrected our findings for ethnicity, gender, anatomical localization of the first symptoms, age at time of CIS, and HADS. To analyse the change in evolution of FSS after CDMS diagnosis, we included an interaction term between CDMS at time of questionnaire and the nonlinear time. In the model where we analysed EDSS (as continuous variable), we corrected for localization of the first symptoms. To analyse the correlation between FSS at baseline and evolution of EDSS during follow-up after CDMS, we included the interaction term between FSS at baseline and time. For both analyses, the model with random intercept and random slopes was deemed the most appropriate based on likelihood ratio tests between nested random-effects structures. Different F-tests were used to evaluate whether the time effect was nonlinear, whether FSS altered after being diagnosed with CDMS and whether EDSS was dependent on the baseline FSS.
Results
Patient characteristics
At the time of analyses, 281 patients were enrolled in the study. In total, 46 patients were excluded from further analysis because of alternative diagnoses (n = 12), comorbidities other than depression, that are likely to cause fatigue (Crohn’s disease (n = 1), ulcerative colitis (n = 1), hypothyroidism (n = 7), pan-hypopituitarism (n = 1), newly diagnosed diabetes mellitus (n = 1)), and missing data on the questionnaires (n = 23). After exclusions, 235 patients were left for analyses. A total of 825 questionnaires were obtained (median number of questionnaires per person was 3.0 (interquartile range (IQR): 2.0–5.0)). During the mean follow-up of 51.9 months, 89 patients (37.9%) were diagnosed with CDMS. In all, 15 of the 825 questionnaires were obtained within 3 months after CDMS diagnosis. A total of 59 patients received IMT before CDMS diagnosis. Patient characteristics are shown in Table 1. CIS patients are stratified into CDMS and monophasic.
Table 1.
Patient characteristics.
| Characteristic | All patients,N = 235 (100%) | CDMS,n = 89 (37.9%) | Monophasic,n = 146 (62.1%) | p valuea |
|---|---|---|---|---|
| No. of females, n (%) | 178 (75.7) | 74 (83.1) | 104 (71.2) | p = 0.04 |
| Ageb (years), mean (SD) | 34.2 (8.3) | 33.6 (8.1) | 34.5 (8.4) | ns (p = 0.38) |
| Caucasian ethnicity, n (%) | 187 (79.6) | 76 (85.4) | 111 (76.0) | ns (p = 0.08) |
| Follow-up time (months), mean (SD) | 51.9 (29.5) | 65.12 (25.0) | 43.9 (29.1) | p < 0.01 |
| Time CIS to baseline FSS (weeks), mean (SD) | 12.8 (8.6) | 12.3 (6.9) | 13.2 (9.6) | ns (p = 0.50) |
| Time CIS to CDMS (months) median (IQR) | Na | 19.0 (8.4–42.3) | na | na |
| Immunomodulating therapy, n (%) | 101 (43.0) | 74 (83.1) | 27 (18.5) | p < 0.01 |
| Immunomodulating therapy at time of CIS, n (%) | 59 (25.1) | 32 (36.0) | 27 (18.5) | p < 0.01 |
| Questionnaires at baseline | ||||
| FSS, mean (SD) | 4.2 (1.8) | 4.8 (1.8) | 3.8 (1.7) | p < 0.01 |
| FSS ⩾ 5.0, n (%) | 83 (35.3) | 47 (52.8) | 36 (24.7) | p < 0.01 |
| HADS-A, mean (SD) | 7.1 (4.1) | 7.6 (4.4) | 6.7 (3.9) | ns (p = 0.14) |
| HADS-D, median (IQR) | 4.0 (1.3–7.0) | 4.0 (2.0–8.0) | 3.0 (1.0–6.0) | p < 0.01 |
| Presenting phenotype at CIS | ||||
| Optic nerve | 94 (40.0) | 29 (32.6) | 65 (44.5) | ns (p = 0.07) |
| Brainstem | 25 (10.6) | 15 (16.9) | 10 (6.8) | ns (p = 0.06) |
| Spinal cord | 62 (26.4) | 23 (25.8) | 39 (26.7) | ns (p = 0.88) |
| Cerebellum | 3 (1.3) | 0 (0.0) | 3 (2.1) | ns (p = 0.29) |
| Cerebral hemispheres | 21 (8.9) | 8 (9.0) | 13 (8.9) | ns (p = 0.98) |
| Multifocal | 30 (12.8) | 14 (15.7) | 16 (11.0) | ns (p = 0.29) |
| CSF findings at baseline | ||||
| Positive OCB, n (%) (n = 142) | 115 (81.0%) | 57 (93.4%) | 58 (71.6%) | p < 0.01 |
| IgG index, median (IQR) (n = 137) | 0.83 (0.57–1.30) | 1.00 (0.62–1.39) | 0.78 (0.56–1.11) | p = 0.03 |
| Features baseline MRI scan | ||||
| ⩾9 T2 lesions on T2-weighted images, n (%) | 90 (38.3) | 48 (53.9) | 42 (28.8) | p < 0.01 |
| Gadolinium-enhancing lesions, n (%) (n = 158) | 65 (41.1) | 31 (48.4) | 34 (36.2) | ns (p = 0.12) |
CIS: clinically isolated syndrome; ns: not significant; na: not applicable; HADS-A: HADS–Anxiety; HADS-D: HADS–Depression; OCB: oligoclonal bands; Ig: immunoglobulin; CSF: cerebrospinal fluid; MRI: magnetic resonance imaging; FSS: Fatigue Severity Scale; SD: standard deviation; CDMS: clinically definite multiple sclerosis.
CDMS patients are those who are diagnosed with CDMS during follow-up after CIS defined by Poser criteria; monophasic are those not diagnosed with CDMS.
p value calculated between CDMS and monophasic.
Age at time of CIS.
Fatigue predicts CDMS diagnosis
Fatigue at baseline was associated with a shorter time to CDMS diagnosis (hazard ratio (HR): 2.5, 95% confidence interval (CI): 1.5–3.9; p < 0.001) using a univariable Cox regression model. After adjustments (sex, age, ethnicity, localization of symptoms, anxiety, depression, number of T2 lesions, gadolinium enhancement at baseline MRI and IMT before CDMS diagnosis), multivariable Cox analysis showed that fatigue at time of CIS was associated with CDMS diagnosis both as a dichotomous variable (HR: 2.7, 95% CI: 1.6–4.4; p < 0.001) and as a continuous variable (HR: 1.4, 95% CI: 1.2–1.6; p < 0.001). Kaplan–Meier curves for time to CDMS in fatigued and non-fatigued patients are shown in Figure 1.
Figure 1.
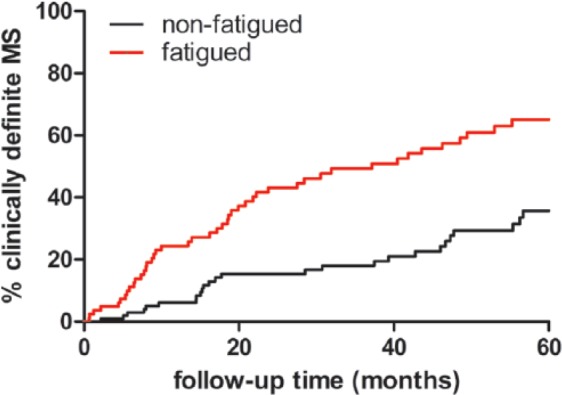
Time to CDMS.
Kaplan–Meier curves for time to CDMS. Patients were stratified at fatigued (FSS ⩾ 5) versus non-fatigued (FSS < 5) (log-rank test, p < 0.01).
There were no differences between FSS scores in patients who received IMT versus patients who did not receive IMT in the CDMS group (mean FSS, respectively, 4.6 vs 4.4; p = 0.19) and in the monophasic CIS group (mean FSS, respectively, 3.8 vs 3.4; p = 0.26). Patients who were diagnosed with CDMS during follow-up showed higher scores on the depression scale (HADS-D) compared to patients who remained monophasic (median: 4.0 vs 3.0 p < 0.01). However, the HR per point elevation in HADS-D was small (HR: 1.075, 95% CI: 1.02–1.14; p = 0.01).
From 112 patients, we knew the level of education. There was no difference in baseline FSS between patients with the lowest (n = 65) and highest (n = 47) level of education. Level of education did not correlate with CDMS diagnosis during follow-up in this cohort.
Longitudinal follow-up of fatigue
FSS at time of CIS did not differ between male and female patients (male vs female, mean FSS 3.90 vs 4.31 (p = 0.18)). However, during follow-up, female patients had 0.68 units higher FSS than males (mixed-effects model analysis: estimated main effect for female: 0.68 (p < 0.01)). There was no significant difference in FSS between Caucasian and non-Caucasian patients at baseline (Caucasian vs non-Caucasian, mean baseline FSS: 4.20 vs 4.30 (p = 0.76)) and during follow-up (estimated main effect for non-Caucasian: 0.23 (p = 0.27)). Age at time of CIS did not correlate with FSS at baseline (Pearson’s rho: 0.02 (p = 0.78)) nor during follow-up (estimated main effect per year older: 0.01 (p = 0.30)).
Anatomical localization of the first presenting symptom did not influence the FSS at baseline (optic neuritis vs other localization, mean baseline FSS: 3.93 vs 4.40 (p = 0.10)) nor during follow-up (estimated main effect for optic neuritis: 0.17 (p = 0.38)). The mean time between first neurological symptoms and baseline FSS was 12.8 weeks (standard deviation (SD): 8.6), no correlation between this time and baseline FSS score was found.
An increase of >1 point in FSS was seen in 25% of patients who remained CIS during follow-up. In the patients who were diagnosed with CDMS, 30% showed an increase of >1 point in FSS; this difference was not significant (p = 0.34).
The longitudinal evolution of FSS in time was nonlinear (p < 0.01). Therefore, we utilized a mixed-effects model with natural cubic splines. The evolution of FSS was not altered after CDMS diagnosis (p = 0.44 for interaction between the nonlinear effect for time and CDMS diagnosis). However, there was a significant increase in FSS by 0.86 units after CDMS diagnosis (estimated main effect for FSS at time of CDMS: 0.86 (p = 0.01)). After this increase in FSS, the FSS course remained unaltered, comparable to the course of FSS in monophasic CIS patients. These results were adjusted for ethnicity, gender, anatomical localization of first symptoms, age at time of CIS and HADS. The evolution of FSS in monophasic CIS patients and CIS patients diagnosed with CDMS during follow-up is shown in Figure 2(a) and (b). Figure 2(b) depicts the FSS evolution in CIS patients with 2 years between CIS and CDMS. The figures for CIS patients with different times between CIS and CDMS look similar, with the sole difference that the increase in FSS takes place at the time of CDMS diagnosis.
Figure 2.

Follow-up FSS in males and females. Time 0 refers to study entry. (a) FSS evolution in patients who are not diagnosed with CDMS during follow-up. (b) FSS evolution in patients who are diagnosed with CDMS during follow-up. The illustration depicts the model for CDMS diagnosis at year 2. For patients with other times to CDMS diagnosis, the figure looks similar with the increase in fatigue at time of CDMS diagnosis.
EDSS
When patients were diagnosed with CDMS (n = 89), EDSS was obtained annually. There is a trend towards 0.9 units higher EDSS during follow-up in patients with FSS ⩾5.0 at time of CIS, compared to patients with FSS <5.0 (mixed-effects model analysis: estimated fixed effect for FSS > 5.0: 0.90 (p = 0.10)). Those results were adjusted for localization of the first symptoms. Patients who changed >1 point in FSS score during follow-up did not show higher EDSS scores during follow-up than patients who did not change >1 point in FSS score.
Discussion
In this study, we explored the course of fatigue after CIS. The first part of the study replicates our earlier observation that a higher FSS at time of CIS, unrelated to disability or time between first neurological symptoms and baseline FSS, predicts a subsequent diagnosis of CDMS.10 Patients with a future diagnosis of CDMS already had a higher FSS at time of CIS than patients who remained monophasic during follow-up. Here, we showed that after the second attack (and thus after CDMS diagnosis), the FSS increased even more.
We found that fatigue is predictive for a shorter time to CDMS diagnosis. There is some evidence that a shorter time to CDMS diagnosis might correlate with a more severe disease course with more disability.27 Cavallari et al.28 found that fatigue in patients with MS was predictive for disease worsening. Therefore, we tested whether fatigue present even earlier in the disease also predicts future disability. In a mixed-effects model, with correction for localization of CIS, we did not find a correlation between fatigue at time of CIS (FSS ⩾ 5.0) and EDSS during follow-up. However, we did find a trend towards a 0.9-point higher EDSS score during follow-up in patients who were fatigued at baseline; a 0.9-point increase in EDSS might be clinically relevant.
A strength of our study was the large sample size, almost twice as large as our previous cohort (235 vs 127).10 Earlier studies looked at the course of fatigue in patients who were already diagnosed with MS with a much shorter follow-up of 1 year to a maximum of 3 years with various results in the persistency of fatigue.1,11–13,29,30 To our knowledge, this is the first study that examined fatigue annually after onset of CIS with a long follow-up (mean: 4.3 years). Since we had a large sample size, we could adjust our findings for multiple factors, including HADS. Anxiety and depression are known confounders and were associated with FSS; therefore, the analyses were adjusted for these factors.25,26,31
Although part of the patients received IMT, it did not influence the results because FSS did not differ between those who used IMT and those who did not. This is in line with the previous literature.12,32 In all, 59 patients received IMT prior to CDMS diagnosis, which may have postponed CDMS diagnosis. Therefore, our results may even be an underestimation. However, in the multivariable Cox model, we corrected for IMT prior to CDMS diagnosis.
One explanation for the observed increase in FSS score after CDMS diagnosis could be that this increase is related to the second attack itself; however, only a small proportion of questionnaires was obtained in a short period after the second attack (15 of 825 questionnaires within 3 months); this indicates that it is more likely that the observed increase in FSS is the MS-related fatigue and not the attack-related fatigue.
The FSS is a self-administered questionnaire, and easy to fill in. Although it is a subjective scale, it is as efficient as other scales measuring fatigue.33 Its validity has been proven in MS; hence, it has been used widely in MS studies. Because of its short length and simplicity, we had a preference for specifically this scale in order to limit the withdrawal due to repetitive annual measurement of fatigue.
In this study, less than 40% of CIS patients experienced a second attack during a mean follow-up time of more than 4 years. Using the newest diagnostic criteria,34 a part of the remaining 60% of patients, having a less active disease, would be diagnosed with MS. This underlines that not only predictors for MS diagnosis but also predictors for disease activity and disability are important.
There were a few limitations to our study. First, because patients were included over a long period of time, there was a wide range in follow-up, resulting in different numbers of completed questionnaires per patient. To overcome this problem, a mixed-effects model was used which allowed us to correct for different follow-up times and use all available questionnaires in the analyses. Second, we did not measure EDSS scores at the moment of CIS; therefore, we could not adjust for baseline EDSS. All EDSS scores were obtained at least 3 months after an attack because we did not want a resent relapse influencing the EDSS score. However, although we could not adjust for baseline EDSS, we did adjust for localization of CIS. We did not have reliable information on level of education for all patients. However, in a subgroup of 112 patients, we had this information. In this subgroup, the results were not altered after adding level of education to the Cox regression model.
Finally, since we did not perform a follow-up MRI scan regularly, we used the Poser criteria for defining CDMS diagnosis.17 In this way, we did show an effect on a second attack; this might be clinically more relevant, than showing an effect on MRI.
In summary, using a large prospective cohort of CIS patients, we show that fatigue at time of CIS predicts a subsequent CDMS diagnosis. Our findings indicate that fatigue exists early in the disease course of MS, probably will remain present during the further follow-up, and increases after CDMS diagnosis. Despite the long follow-up, we did not find an association between presence of fatigue at the moment of the first symptoms and future disability. However, we did find a trend towards a higher EDSS in patients who were fatigued at baseline. It would be interesting to follow our cohort to see whether, with a longer follow-up, the correlation of fatigue at first attack and disability during follow-up will reach significance. Fatigue can interfere with a person’s ability to function at home and work; our advice for clinical practice is to give proper attention to symptoms and management of fatigue early in the disease course.
Acknowledgments
The authors thank the participants of the PROUD study and the physicians who helped with the data collection.
Footnotes
Declaration of Conflicting Interests: The author(s) declared the following potential conflicts of interest with respect to the research, authorship and/or publication of this article: N.J. received honoraria for giving a lecture from Biogen Idec and received personal fees from Novartis, outside the submitted work. R.Q.H. received honoraria for serving on advisory boards for Biogen Idec, Roche and Sanofi. He participated in trials with Biogen Idec, Merck-Serono, Roche, Genzyme and Novartis, outside the submitted work. The remaining authors declare no potential conflict of interest.
Funding: The author(s) disclosed receipt of the following financial support for the research, authorship and/or publication of this article: This study was supported by the Dutch MS Research Foundation.
Contributor Information
Roos M van der Vuurst de Vries, MS Centrum ErasMS, Department of Neurology, Erasmus MC, Rotterdam, The Netherlands.
Jan JA van den Dorpel, MS Centrum ErasMS, Department of Neurology, Erasmus MC, Rotterdam, The Netherlands.
Julia Y Mescheriakova, MS Centrum ErasMS, Department of Neurology, Erasmus MC, Rotterdam, The Netherlands.
Tessel F Runia, MS Centrum ErasMS, Department of Neurology, Erasmus MC, Rotterdam, The Netherlands.
Naghmeh Jafari, MS Centrum ErasMS, Department of Neurology, Erasmus MC, Rotterdam, The Netherlands.
Theodora AM Siepman, MS Centrum ErasMS, Department of Neurology, Erasmus MC, Rotterdam, The Netherlands.
Dimitris Rizopoulos, Department of Biostatistics, Erasmus MC, Rotterdam, The Netherlands.
Ewout W Steyerberg, Department of Public Health, Erasmus MC, Rotterdam, The Netherlands.
Rogier Q Hintzen, MS Centrum ErasMS, Department of Neurology, Erasmus MC, Rotterdam, The Netherlands.
References
- 1. Lerdal A, Celius EG, Krupp L, et al. A prospective study of patterns of fatigue in multiple sclerosis. Eur J Neurol 2007; 14: 1338–1343. [DOI] [PubMed] [Google Scholar]
- 2. Minden SL, Frankel D, Hadden L, et al. The Sonya Slifka Longitudinal Multiple Sclerosis Study: Methods and sample characteristics. Mult Scler 2006; 12: 24–38. [DOI] [PubMed] [Google Scholar]
- 3. Van Kessel K, Moss-Morris R. Understanding multiple sclerosis fatigue: A synthesis of biological and psychological factors. J Psychosom Res 2006; 61: 583–585. [DOI] [PubMed] [Google Scholar]
- 4. Bakshi R. Fatigue associated with multiple sclerosis: Diagnosis, impact and management. Mult Scler 2003; 9: 219–227. [DOI] [PubMed] [Google Scholar]
- 5. Multiple Sclerosis Council for Clinical Practice Guidelines. Fatigue and multiple sclerosis: Evidence-based management strategies for fatigue in multiple sclerosis. Washington, DC: Paralyzed Veterans of America, 1998, pp. 1–33. [Google Scholar]
- 6. Kos D, Kerckhofs E, Nagels G, et al. Origin of fatigue in multiple sclerosis: Review of the literature. Neurorehabil Neural Repair 2008; 22: 91–100. [DOI] [PubMed] [Google Scholar]
- 7. Braley TJ, Chervin RD. Fatigue in multiple sclerosis: Mechanisms, evaluation, and treatment. Sleep 2010; 33: 1061–1067. [DOI] [PMC free article] [PubMed] [Google Scholar]
- 8. Malekzadeh A, Van de Geer-Peeters W, De Groot V, et al. Fatigue in patients with multiple sclerosis: Is it related to pro- and anti-inflammatory cytokines? Dis Markers 2015; 2015: 758314. [DOI] [PMC free article] [PubMed] [Google Scholar]
- 9. Heesen C, Nawrath L, Reich C, et al. Fatigue in multiple sclerosis: An example of cytokine mediated sickness behaviour? J Neurol Neurosurg Psychiatry 2006; 77: 34–39. [DOI] [PMC free article] [PubMed] [Google Scholar]
- 10. Runia TF, Jafari N, Siepman DA, et al. Fatigue at time of CIS is an independent predictor of a subsequent diagnosis of multiple sclerosis. J Neurol Neurosurg Psychiatry 2015; 86: 543–546. [DOI] [PubMed] [Google Scholar]
- 11. Patrick E, Christodoulou C, Krupp LB, et al. Longitudinal correlates of fatigue in multiple sclerosis. Mult Scler 2009; 15: 258–261. [DOI] [PubMed] [Google Scholar]
- 12. Johansson S, Ytterberg C, Hillert J, et al. A longitudinal study of variations in and predictors of fatigue in multiple sclerosis. J Neurol Neurosurg Psychiatry 2008; 79: 454–457. [DOI] [PubMed] [Google Scholar]
- 13. Tellez N, Rio J, Tintore M, et al. Fatigue in multiple sclerosis persists over time: A longitudinal study. J Neurol 2006; 253: 1466–1470. [DOI] [PubMed] [Google Scholar]
- 14. Wood B, van der Mei IA, Ponsonby AL, et al. Prevalence and concurrence of anxiety, depression and fatigue over time in multiple sclerosis. Mult Scler 2013; 19: 217–224. [DOI] [PubMed] [Google Scholar]
- 15. Miller DH, Weinshenker BG, Filippi M, et al. Differential diagnosis of suspected multiple sclerosis: A consensus approach. Mult Scler 2008; 14:1157–1174. [DOI] [PMC free article] [PubMed] [Google Scholar]
- 16. Schumacker GA, Beebe G, Klibler RF, et al. Problems of experimental trials of therapy in multiple sclerosis: Report by the panel on the evaluation of experimental trials of therapy in multiple sclerosis. Ann N Y Acad Sci 1965; 122: 2059–2069. [DOI] [PubMed] [Google Scholar]
- 17. Poser CM, Paty DW, Scheinberg L, et al. New diagnostic criteria for multiple sclerosis: Guidelines for research protocols. Ann Neurol 1983; 13: 227–231. [DOI] [PubMed] [Google Scholar]
- 18. Kurtzke JF. Rating neurologic impairment in multiple sclerosis: An expanded disability status scale (EDSS). Neurology 1983; 33: 1444–1452. [DOI] [PubMed] [Google Scholar]
- 19. Krupp LB, LaRocca NG, Muir-Nash J, et al. The fatigue severity scale. Application to patients with multiple sclerosis and systemic lupus erythematosus. Arch Neurol 1989; 46: 1121–1123. [DOI] [PubMed] [Google Scholar]
- 20. Valko PO, Bassetti CL, Bloch KE, et al. Validation of the fatigue severity scale in a Swiss cohort. Sleep 2008; 1: 1601–1607. [DOI] [PMC free article] [PubMed] [Google Scholar]
- 21. Armutlu K, Korkmaz NC, Keser I, et al. The validity and reliability of the Fatigue Severity Scale in Turkish multiple sclerosis patients. Int J Rehabil Res 2007; 30: 81–85. [DOI] [PubMed] [Google Scholar]
- 22. Lerdal A, Wahl A, Rustoen T, et al. Fatigue in the general population: A translation and test of the psychometric properties of the Norwegian version of the fatigue severity scale. Scand J Public Health 2005; 33: 123–130. [DOI] [PubMed] [Google Scholar]
- 23. Zigmond AS, Snaith RP. The hospital anxiety and depression scale. Acta Psychiatr Scand 1983; 67: 361–370. [DOI] [PubMed] [Google Scholar]
- 24. Honarmand K, Feinstein A. Validation of the Hospital Anxiety and Depression Scale for use with multiple sclerosis patients. Mult Scler 2009; 15: 1518–1524. [DOI] [PubMed] [Google Scholar]
- 25. Kroencke DC, Lynch SG, Denney DR. Fatigue in multiple sclerosis: Relationship to depression, disability, and disease pattern. Mult Scler 2000; 6: 131–136. [DOI] [PubMed] [Google Scholar]
- 26. Simpson S, Tan H, Otahal P, et al. Anxiety, depression and fatigue at 5-year review following CNS demyelination. Acta Neurol Scand 2016; 134: 403–413. [DOI] [PubMed] [Google Scholar]
- 27. Degenhardt A, Ramagopalan SV, Scalfari A, et al. Clinical prognostic factors in multiple sclerosis: A natural history review. Nat Rev Neurol 2009; 5: 672–682. [DOI] [PubMed] [Google Scholar]
- 28. Cavallari M, Palotai M, Glanz BI, et al. Fatigue predicts disease worsening in relapsing-remitting multiple sclerosis patients. Mult Scler 2016; 22: 1841–1849. [DOI] [PubMed] [Google Scholar]
- 29. Motl RW, Suh Y, Weikert M, et al. Fatigue, depression, and physical activity in relapsing-remitting multiple sclerosis: Results from a prospective, 18-month study. Mult Scler Relat Disord 2012; 1: 43–48. [DOI] [PubMed] [Google Scholar]
- 30. Nourbakhsh B, Azevedo C, Nunan-Saah J, et al. Longitudinal associations between brain structural changes and fatigue in early MS. Mult Scler Relat Disord 2016; 5: 29–33. [DOI] [PubMed] [Google Scholar]
- 31. Nagaraj K, Taly AB, Gupta A, et al. Depression and sleep disturbances in patients with multiple sclerosis and correlation with associated fatigue. J Neurosci Rural Pract 2013; 4: 387–391. [DOI] [PMC free article] [PubMed] [Google Scholar]
- 32. Putzki N, Katsarava Z, Vago S, et al. Prevalence and severity of multiple-sclerosis-associated fatigue in treated and untreated patients. Eur Neurol 2008; 59: 136–142. [DOI] [PubMed] [Google Scholar]
- 33. Neuberger GB. Measures of fatigue: The fatigue questionnaire, fatigue severity scale, multidimensional assessment of fatigue scale, and short form-36 vitality (energy/fatigue) subscale of the short form health survey. Arthritis Rheum 2003; 49: S175–S183. [Google Scholar]
- 34. Polman CH, Reingold SC, Banwell B, et al. Diagnostic criteria for multiple sclerosis: 2010 revisions to the McDonald criteria. Ann Neurol 2011; 69: 292–302. [DOI] [PMC free article] [PubMed] [Google Scholar]