G protein-coupled receptors (GPCRs) form the major receptor family encoded by the human genome (~800 genes), but there is limited diversity of heterotrimeric G proteins through which they couple (16 genes of the α subunit). With each human cell containing multiple GPCRs and multiple G proteins, the molecular determinants that govern the specificity of G protein coupling are unclear. Structural determinants in the coupling of GS to four different GPCRs have been elucidated1–4, but there is a lack of molecular detail into how the other G protein classes couple. Here we present the electron cryo-microscopy (cryo-EM) structure of the serotonin 5-HT1B receptor (5-HT1BR) bound to the agonist donitriptan and coupled to an engineered GO heterotrimer. 5-HT1BR is in an active state with the intracellular half of the receptor in a similar conformation observed for the β2-adrenoceptor (β2AR)3 and the adenosine A2A receptor (A2AR)1 coupled to GS. The GO-receptor interface is considerably smaller than that observed for the GS interface and the gap between the receptor and the β subunit precludes molecular contacts, unlike that observed for GS-coupled receptors. This probably arises due to the subtle differences in interactions between the C-terminus of the GO α subunit compared to GS. The molecular variation between the interfaces of GO and GS coupled to GPCRs may contribute significantly to differences in both coupling specificity and the kinetics of signalling.
Heterotrimeric G proteins are divided into four subfamilies5, GS, Gi/o, Gq and G12/13 and are composed of an α, β and γ subunits. Agonist-bound GPCRs couple to a G protein predominantly through the α subunit, Gα, with relatively few contacts to the β subunit and none to the γ subunit. The overall structure of α subunits in the inactive GDP-bound state is highly conserved6 and they undergo similar conformational changes upon coupling to GPCRs7. This is characterised by a disorder-to-order transition of the C-terminal half of the α5 helix, that adopts an α-helical conformation upon binding into the cytoplasmic cleft of an activated GPCR8. The key role of the α5 helix in G protein coupling to GPCRs has long been recognised through mutagenesis studies, which is consistent with it forming 70% of the interactions between Gα and β2AR3. The amino acid sequence of the α5 helix C-terminus is highly conserved within a G protein subfamily, but it is distinct between different subfamilies. The key role this region plays in determining specificity is indicated by the possibility of changing the coupling specificity of a G protein by mutating the C-terminal region to match that of a different G protein9. However, other regions of the α subunit can also determine specificity and very often mutations do not transfer simply from one G protein to another10. Many receptors couple to more than one different G protein, and this coupling may appear different depending upon whether coupling is measured temporally or in an end point assay11. The structure of β2AR coupled to heterotrimeric GS transformed our understanding of how G proteins couple and are activated by GPCRs3, but it does not address the issue of G protein specificity. We have therefore determined the structure of 5-HT1BR coupled to heterotrimeric GO to allow a comparison between how GS and GO couple.
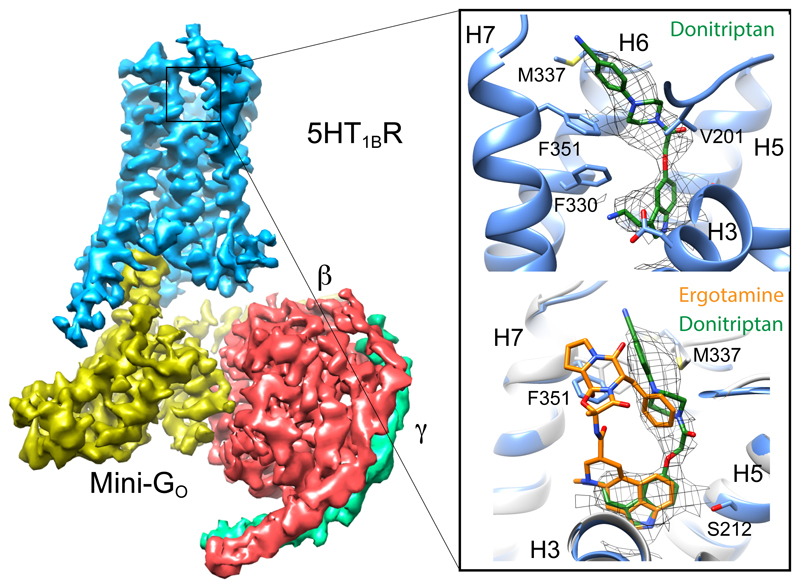
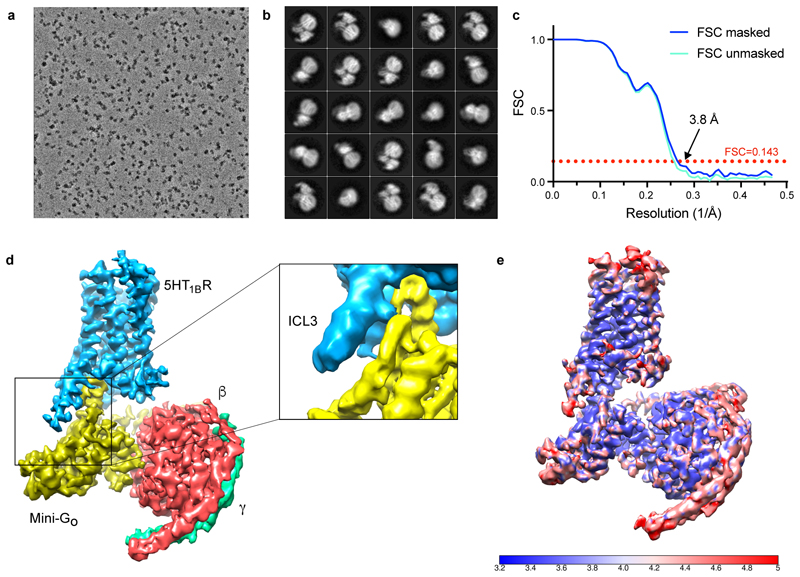
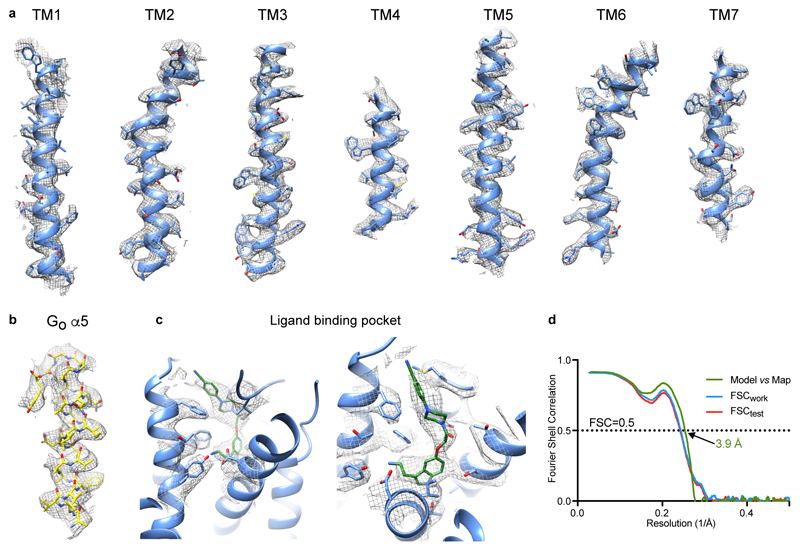
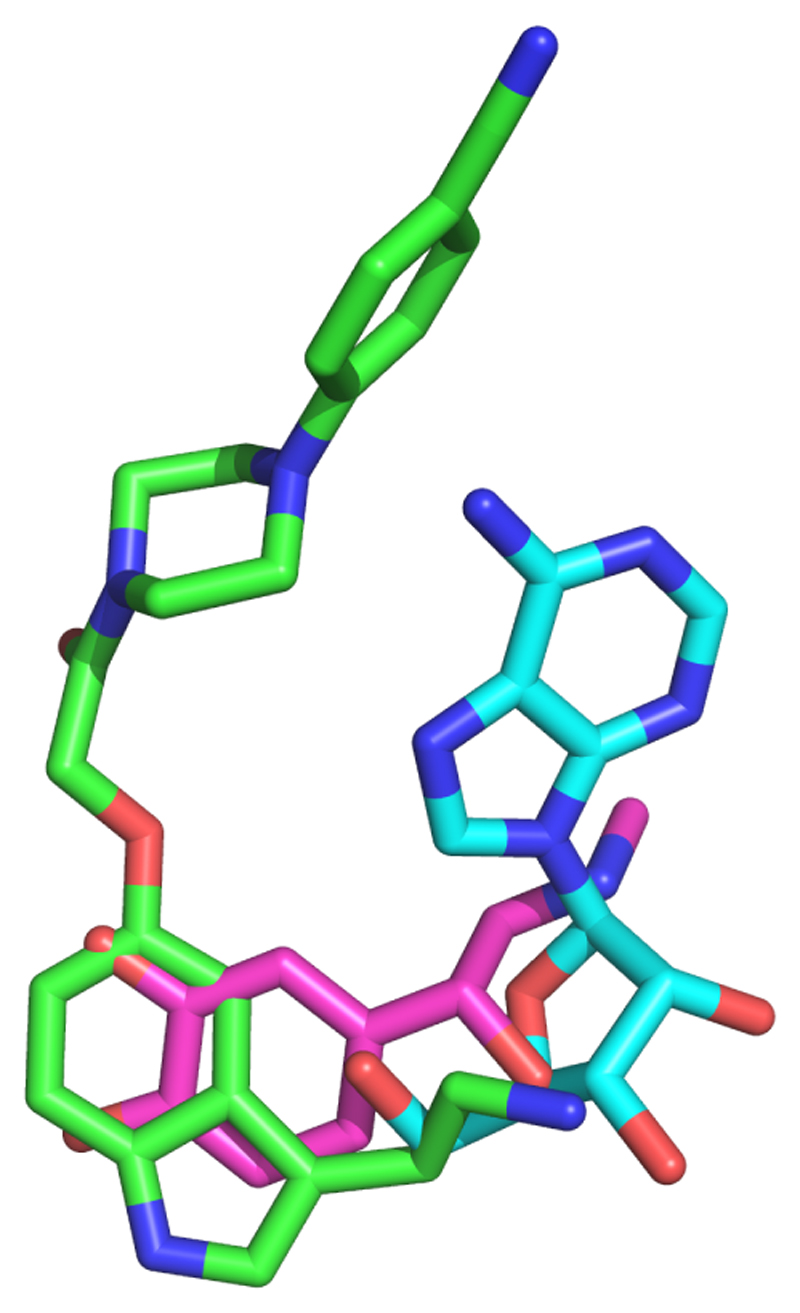
There are thirteen GPCRs in the serotonin receptor family12 and they are all found in the central nervous system where they play key roles in all aspects of behaviour13. A number of structures of 5-HT receptors have been determined in either inactive or active-intermediate states14–16. 5-HT1BR couples to Gi/o and binds the agonist donitriptan with high-affinity17. GO is the most abundant G protein in the brain and an engineered GO, mini-GO, was developed to form a heterotrimer with the βγ subunits, which can bind and stabilise the agonist-activated 5-HT1BR10. The individual protein components were expressed, purified and assembled into a complex containing 5-HT1BR, donitriptan, mini-GO, β1 and γ2 subunits (see Methods). After gel filtration, the complex was vitrified on electron microscopy grids and the structure determined by single-particle analysis to an overall resolution of 3.8 Å (Extended Data Fig. 1-4 and Extended Data Table 1), with clear density for the majority of side chains and the agonist donitriptan (Fig. 1; Extended Data Fig. 2). Donitriptan occupies the orthosteric binding site and the serotonin-like moiety of the ligand binds in a region analogous to that found for the native agonists adrenaline18 and adenosine19 (Fig 1 and Extended Data Fig. 5). Donitriptan binds in a different mode compared to the ergot family of alkaloids, such as ergotamine and dihydroergotamine15 (Fig. 1). The binding site is formed from amino acid residues in transmembrane helices 3, 5, 6 and 7 (H3, H5, H6 and H7) and extends into the extracellular region to make contacts with H6, H7 and extracellular loop 2 (ECL2). Donitriptan is bound primarily by van der Waals contacts and limited polar interactions with Thr1343.37 and Asp1293.32, similar to the binding mode of ergotamine. However donitriptan and ergotamine lie on opposite faces of the binding pocket with different rotamers of Phe3517.35 and Met3376.58 to accommodate the different ligands. The resolution at the ligand binding pocket is slightly lower than for the core of the complex and there are limitations in the interpretation of the experimental data (see Methods and Extended Data Fig 2).
Figure 1. Overall cryo-EM reconstruction of the 5-HT1BR–GO heterotrimer complex.
The density for the cryo-EM map (sharpened with a B factor of -200) is coloured according to the subunit. The inset shows the orthosteric binding pocket in 5-HT1BR (light blue) with donitriptan depicted as sticks (green, carbon) and its density in the cryo-EM map. The lower panel shows a superposition of ergotamine-bound 5-HT1BR (pale grey, PDB ID 4IAR)15 and donitriptan-bound 5-HT1BR (pale blue). Donitriptan (green, carbon) and ergotamine (orange, carbon) are depicted as sticks.
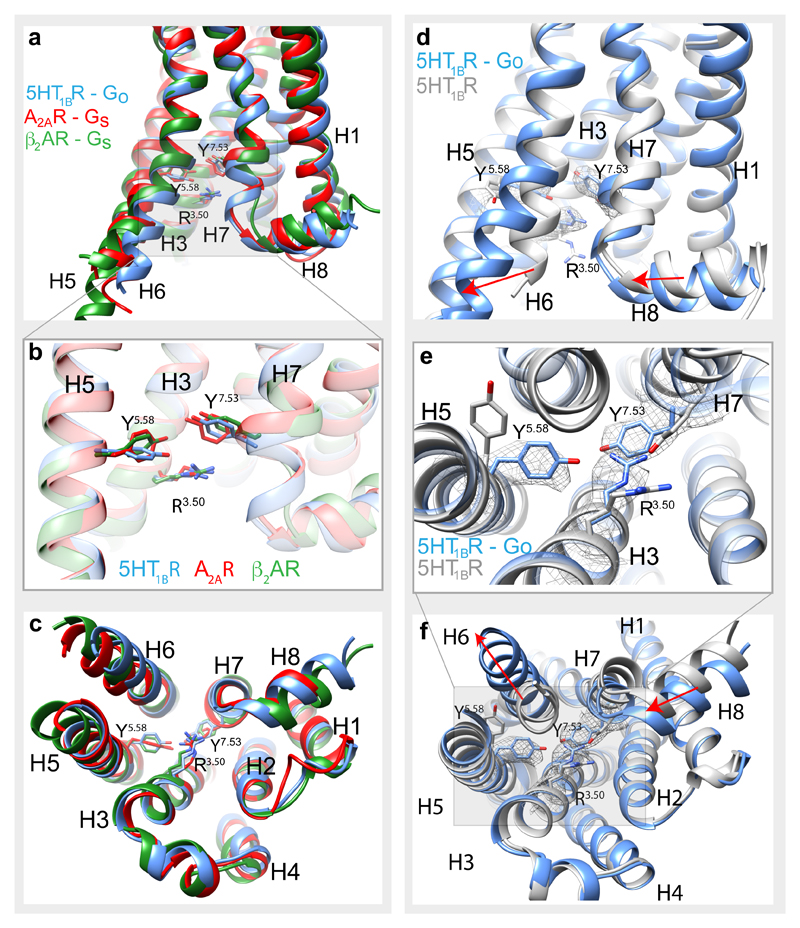
The overall conformation of 5-HT1BR in the cryo-EM structure is consistent with the receptor being in a fully active state. Superposition with the active states of β2AR3 and A2AR1 shows a high degree of conservation of the cytoplasmic halves of the receptors (Fig. 2). In addition, rotamers of key conserved amino acid residues (Pro5.50, Ile3.40, Phe6.44)8 in the activated receptors are virtually identical, suggesting that 5-HT1BR has attained a fully active state. The structure of a 5-HT1BR-BRIL fusion was determined previously bound to the agonist ergotamine and was suggested to be in an active intermediate state due to the partial movement of H6 and partial rotamer changes of the key amino acid residues15. Comparison of the GO-coupled 5-HT1BR with the ergotamine-bound 5-HT1BR shows an 8 Å shift of the cytoplasmic end of H6 (Cα of Lys311), an inward shift of H7/H8 by 2 Å (Cα of Glu374) and rotamer changes of Arg3.50, Tyr5.58 and Tyr7.53 (Fig. 2). Interestingly, the extracellular half of the receptor that forms the orthosteric binding pocket does not change significantly in conformation upon the transition from the active intermediate state to the active G protein-coupled state. This was also observed in conformations of A2AR20, but is different from that observed in β2AR3, which has a different energy landscape21.
Figure 2. GO-coupled 5-HT1BR is in an active conformation.
a-c, Superposition of G protein-bound receptors: 5-HT1BR (blue), A2AR (red)1 and β2AR (green)3 based on H3, H5 and H6. Key amino acid residues involved in receptor activation are displayed as sticks. d-f, Superposition of GO-coupled 5-HT1BR (blue) and the active-intermediate state of 5-HT1BR bound to ergotamine (pale grey), based on alignment of the whole receptor. Conformational changes involved in receptor activation are highlighted (red arrows) and key residues are shown as sticks with the density from the cryo-EM map (mesh). a and d, view parallel to the membrane plane; b and e, enlarged view of the conserved core of the receptors; c and f, view from the cytoplasmic face of the membrane.
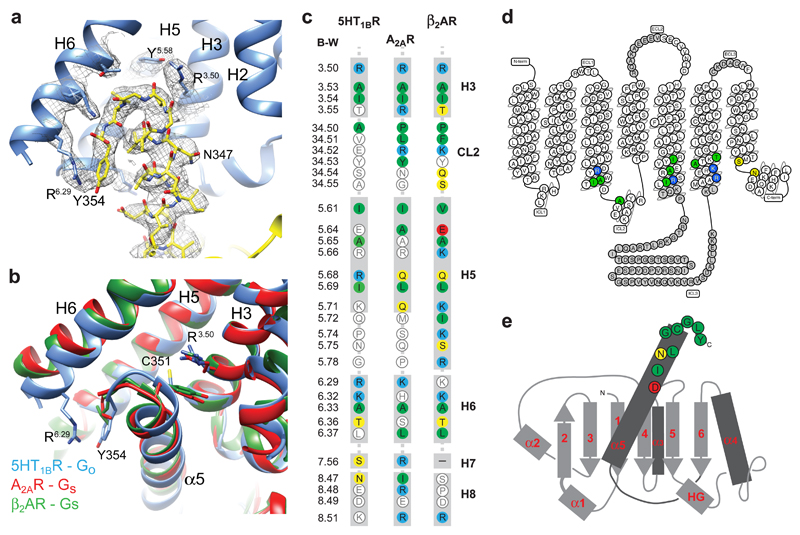
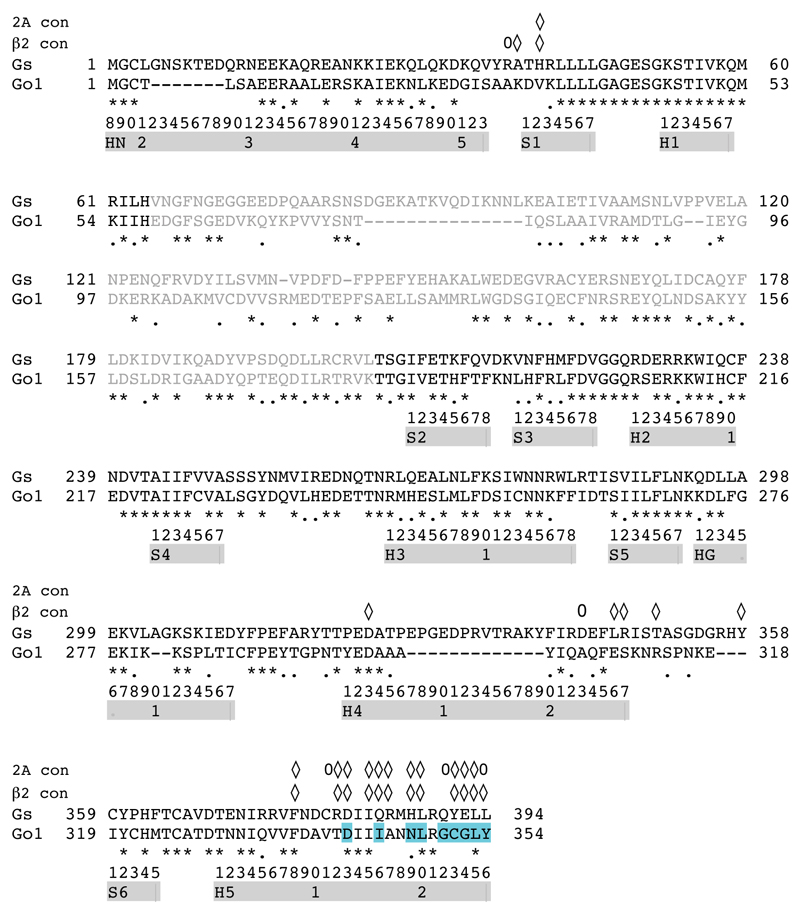
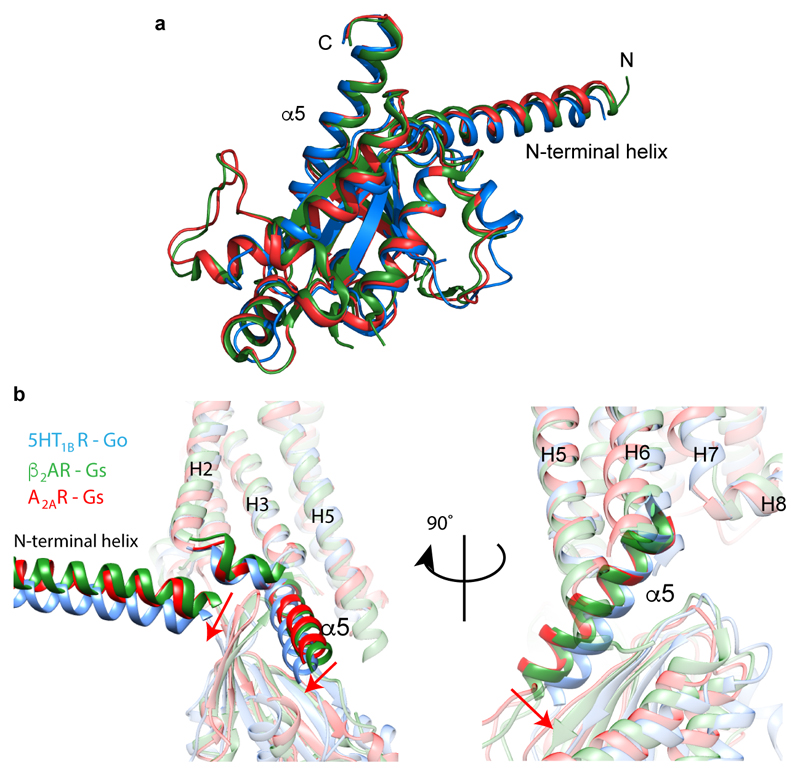
The architecture of 5-HT1BR coupled to GO is superficially similar to that of the β2AR-GS and A2AR-GS complexes1,3, but there are critical differences in the details. The interface between 5-HT1BR and GO is composed of 9 amino acid residues from 5-HT1BR and 13 from the α subunit of GO. This compares with 24 residues from β2AR and 20 in A2AR that make contact to, respectively, 17 and 22 residues in GαS (Fig. 3). Thus the surface area of GO in contact with the receptor is only 822 Å2, compared to 1260 Å2 for β2AR and 1135 Å2 for A2AR. All the receptor contacts made by GO are from residues in the α5 helix. In contrast, contacts to β2AR and A2AR by GαS also involve regions in S1, S2/S3 and H4/S6 (Extended Data Fig. 6). The overall conformation of GαS and GαO coupled to the receptors is very similar (Extended Data Fig. 7). However, inspection of an alignment between the cytoplasmic halves of 5-HT1BR, β2AR and A2AR shows that the α5 helix of GαO is positioned differently within the receptor compared to GαS (Fig. 3, Extended Data Fig. 7). There is a 9° or 11° tilt of the N-terminal end of the α5 helix away from the membrane plane (pivot point in the region of I344-N347 in GαO) compared to α5 coupled to β2AR and A2AR, respectively. The different tilt angles probably arise through the different positions of the C-terminal ~8 amino acid residues of the α5 helices within the receptor. This region contains the major specificity determinants between G proteins7. The final four amino acid residues in GαS are YH5.23ELLH5.26, compared to CH5.23GLYH5.26 in GαO (superscripts refer to the CGN system7), and they form a ‘wavy hook’ structure at the end of the α5 helix. In GαS, the π electrons of TyrH5.23 form extensive contacts with the positively charged Arg3.50, which forms the boundary between the cytoplasmic cleft where the α5 helix binds and the hydrophobic core of the receptor20. Similarly, in GO Cys351H5.23 interacts with Arg1473.50, although only through van der Waals interactions. Thus the α5 helix from both GO and GS penetrate GPCRs to the same degree. In contrast to GαS, in GαO the single amino acid residue that makes most contacts to the receptor is the C-terminal Tyr354H5.26, where the side chain stacks against Arg3086.29 in 5-HT1BR and also makes a weak polar interaction with the same residue. In GαS the terminal amino acid Leu394H5.26 makes only very few contacts with β2AR and is disordered in the A2AR-GS structure. In the A2AR-mini-GS crystal structure, there are extensive contacts between Glu394H5.24 and three Arg residues in the H7/H8 region of the receptor20; this residue is Gly352H5.24 in GO and makes only minor contacts to the receptor. Although it appears from the cryo-EM structure that all the major contacts between 5-HT1BR and GαO are mediated by the α5 helix of GαO, there is weak density for H5 and H6 of 5-HT1BR that extends towards the α4 helix in GαO (Extended Data Figure 1). It is known that mutations in α4 can affect coupling to 5-HT1BR22, but it is unclear from the structure whether this is because direct contacts to the receptor were removed or whether there was a secondary effect of the mutation on the structure of GαO.
Figure 3. GO coupling to the 5-HT1BR.
a, C-terminal end of GαO (yellow sticks) inserted into the cytoplasmic cleft of 5-HT1BR (blue cartoon). Cryo-EM density is depicted as a mesh. b, Superposition of 5-HT1BR (blue), A2AR (red)1 and β2AR (green)3 based on alignment of H3, H5 and H6. The different poses of the C-termini of GS and GO coupled to the respective receptors are shown. c, Amino acid residues in 5-HT1BR, A2AR and β2AR that make contact to the respective Gα subunits they are coupled to are shown in colours that reflect biophysical properties of the residues; green, hydrophobic; yellow, hydrophilic, red, acidic; blue, basic. Residues coloured in white do not make contact to the relevant Gα. The amino acid alignment was created in GPCRdb29 and secondary structural elements and the Ballesteros-Weinstein numbers30 are depicted. d, Snake plot of 5-HT1BR created in GPCRdb with residues making contact to GαO coloured according to their biophysical properties. Regions in grey were disordered in the cryo-EM map. e, Cartoon of secondary structural elements in GαO and amino acid residues that make contact to 5-HT1BR are depicted and coloured according to their biophysical properties.
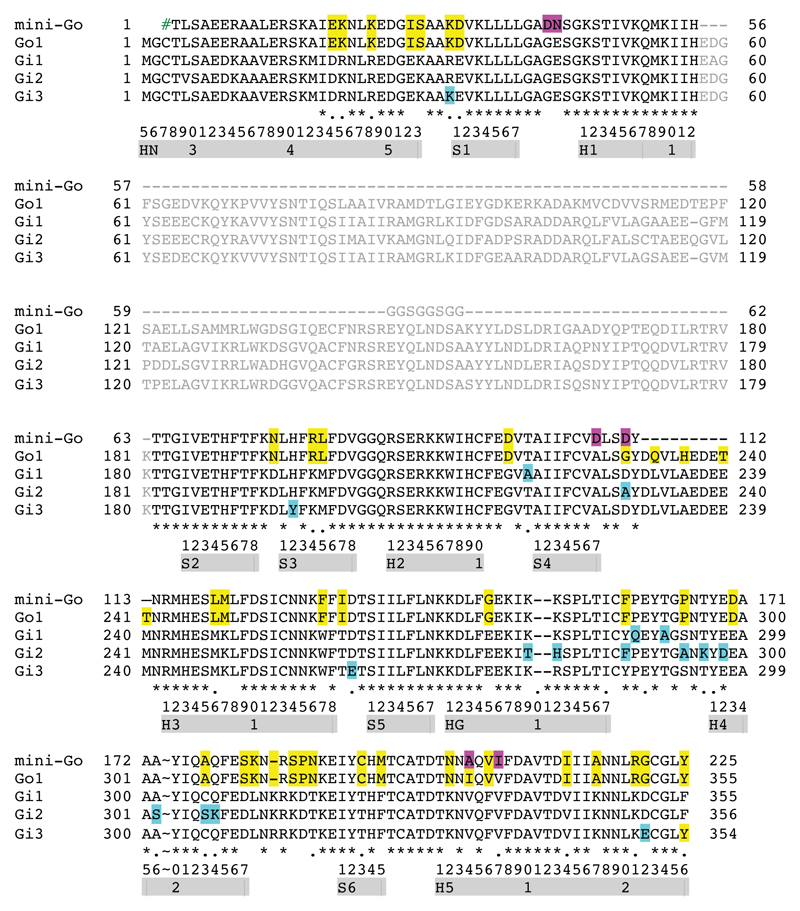
The coupling specificity determinants for G proteins are found predominantly at the C-terminus of Gα in the α5 helix and the wavy hook. The architecture of this region is virtually identical in GαS and GαO, but the differences in amino acid sequence (Extended Data Figs 6 & 8) results in GαS being bulkier than GαO in the terminal five residues (Extended Data Fig 9). This may be sufficient in some GO-specific GPCRs to prevent coupling of GS as the narrower crevice in the GPCR may exclude the wider end of GS. Conversely, the wider crevice in GS coupled receptors may allow coupling of GO, provided there are suitable residues lining the crevice to form a good interface. This last caveat raises the problem of predicting G protein coupling specificity. Although the structure and mechanism of GPCRs are highly conserved8,23, GPCRs have diversified significantly in humans so there is considerable sequence heterogeneity with apparently little or no specific amino acid conservation correlating with the subtype of G protein a receptor couples to24. In addition, there is the potential for different conformations of GPCRs25, which suggests that the mode of G protein coupling could be different between different receptors. This is observed with a transducin peptide coupled to opsin26, where there is a ~30° difference in angle between the α5 helix compared to the α5 helix of GO, even though the G proteins are in the same family. More structures will be required to evaluate the diversity of G protein coupling.
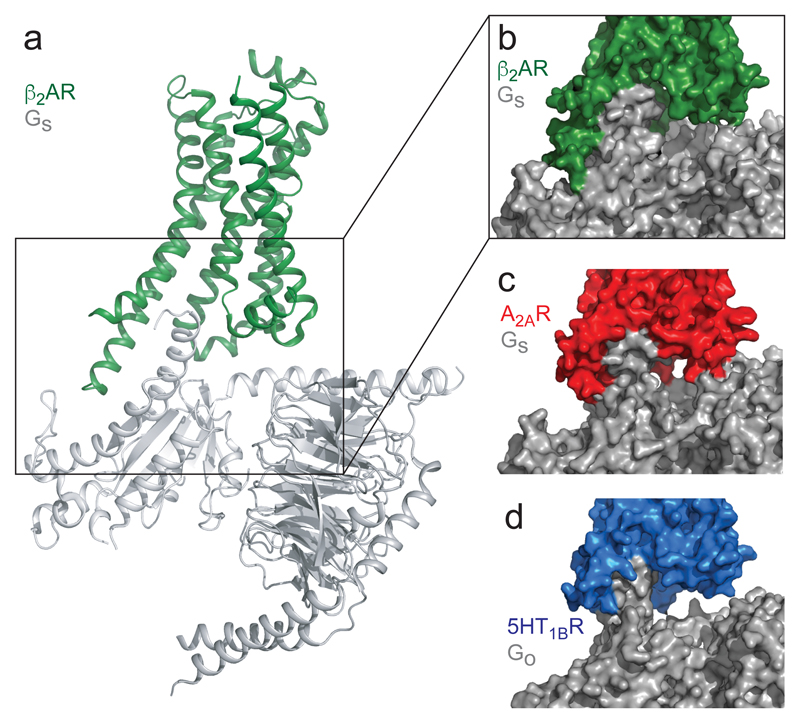
The specific differences in packing at the C-terminus of GO compared to GS have a disproportionate effect on the whole G protein due to their amplification through the different insertion angle of the α5 helix. This results in a change in the tilt of the whole G protein, which moves away from the membrane plane and results in a gap between the rest of the G protein and 5-HT1BR. Therefore there are no contacts between 5-HT1BR and Gβ subunits, and the only contacts made to Gα are with the α5 helix. This is in marked contrast to the relatively close packing of GS to both A2AR and β2AR (Fig 4). Given the conserved mechanism of GPCR23 and G protein activation7, it is likely that when considering other GPCRs activated by diffusible ligands the small interface between 5-HT1BR and GO is a common feature of the Gi/o family compared to GS. A likely consequence of the small receptor-Gi/o interface is that Gi/o may have a faster rate of dissociation than GS when compared with the same GPCR. The kinetics of all the steps in GPCR signalling pathways are thought to have a profound effect on dictating which particular signalling event results from agonist binding to a defined receptor in a specific cell type27,28. A combination of structural data and kinetic analyses will be essential to unravel the complexities of this system.
Figure 4. Comparison of GS coupling vs GO coupling.
a, Cartoon of β2AR (green) coupled to GS (PDB ID 3SN6)3. The α-helical domain of the Gα has been removed for clarity. b-d, surface rendered views of the interface between a receptor and G protein: b, β2AR (green) and GS; c, A2AR1 (red) and GS; d, 5-HT1BR (blue) and GO.
Methods
Expression and purification of 5-HT1BR
N-terminally truncated wild type human 5-HT1BR (residues 34-390) was modified to contain a C-terminal histidine tag (His10) and TEV protease cleavage site10. The L138W3.41 mutation was introduced to increase thermostability. Recombinant baculoviruses expressing 5-HT1BR were prepared using the flashBAC ULTRA system (Oxford Expression Technologies). Trichoplusia ni cells (Expression Systems; not authenticated by the authors and not tested for mycoplasma by the authors) were grown in suspension in ESF921 media (Expression Systems) to a density of 3x10⁶ cells/ml, infected with 5-HT1BR baculovirus and incubated for 48 h. Cells were harvested and membranes prepared by two ultracentrifugation steps in 20 mM HEPES pH7.5, 1 mM EDTA, 1 mM PMSF. Membranes were resuspended finally in 20 mM HEPES pH7.5, 500 mM NaCl, 5 mM MgCl2, 10 mM Imidazole, and Complete™ protease inhibitors (Roche) and flash frozen in liquid nitrogen and stored at -80°C.
Membranes from 2 L of cells were solubilised with 2% n-decyl-β-D-maltopyranoside (DM) on ice for 30 min in the presence of 1 μM donitriptan hydrochloride. The sample was clarified by ultracentrifugation and loaded onto a 5 ml Ni-NTA column (Generon). The column was equilibrated and sample loaded using buffer A (20 mM HEPES pH 7.5, 500 mM NaCl, 1 mM MgCl2, 50 mM imidazole, 1 μM donitriptan hydrochloride, 0.15% DM), and eluted with buffer B (20 mM HEPES pH 7.5, 100 mM NaCl, 1 mM MgCl2, 300 mM imidazole, 1 μM donitriptan hydrochloride, 0.15% DM). The eluate was concentrated using a 50 kDa cut-off Amicon centrifugal ultrafiltration unit (Millipore), and exchanged into desalting buffer (20 mM HEPES pH 7.5, 100 mM NaCl, 1 mM MgCl2, 1 μM donitriptan hydrochloride, 0.15% DM) using a PD10 column (GE Healthcare). 2.5 mg of TEV protease were added, and the sample was incubated on ice overnight. TEV protease was removed by negative purification on Ni2+-NTA resin. The sample was concentrated to ~1 ml and loaded onto a Superdex 200 column (GE Healthcare). Peak fractions corresponding to monomers of receptors were pooled and concentrated. A typical yield was 1-2 mg of pure 5-HT1BR per litre of culture.
Formation of a 5-HT1BR-heterotrimeric mini-GO complex
Purified 5-HT1BR was mixed with a 1.2-fold molar excess of mini-GO1β1γ2 in the presence of apyrase (0.2 U/mL) and the mixture was incubated on ice overnight10. The sample was loaded on to a Superdex 200 column. Peak fractions, containing the 5-HT1BR–mini-GO1β1γ2 complex, were pooled and concentrated to 4 mg/ml.
Cryo-grid preparation and data collection
Cryo-EM grids were prepared by applying 3 µl of sample (at a protein concentration of 2.2 mg/ml) on glow discharged holey gold grids (Quantifoil Au 1.2/1.3 300 mesh). Excess sample was removed by blotting with filter paper for 3-4 seconds prior to plunge-freezing in liquid ethane using a FEI Vitrobot Mark IV at 100% humidity and 4°C. Images were collected on a FEI Titan Krios microscope at 300kV using a Falcon III detector in electron counting mode and a Volta phase plate. EPU software (FEI) was used for automatic data collection. Data were collected in nine independent sessions to give a total of 5,737 movies. Each micrograph was collected as 75 movie frames at a dose rate of 0.5 e-/pixel/sec (0.4 e-/Å2 per frame) for 60 seconds, with a total accumulated dose of ~30 e-/Å2. The magnification used was 75,000x yielding a pixel size of 1.06 Å/pixel.
Data processing and model building
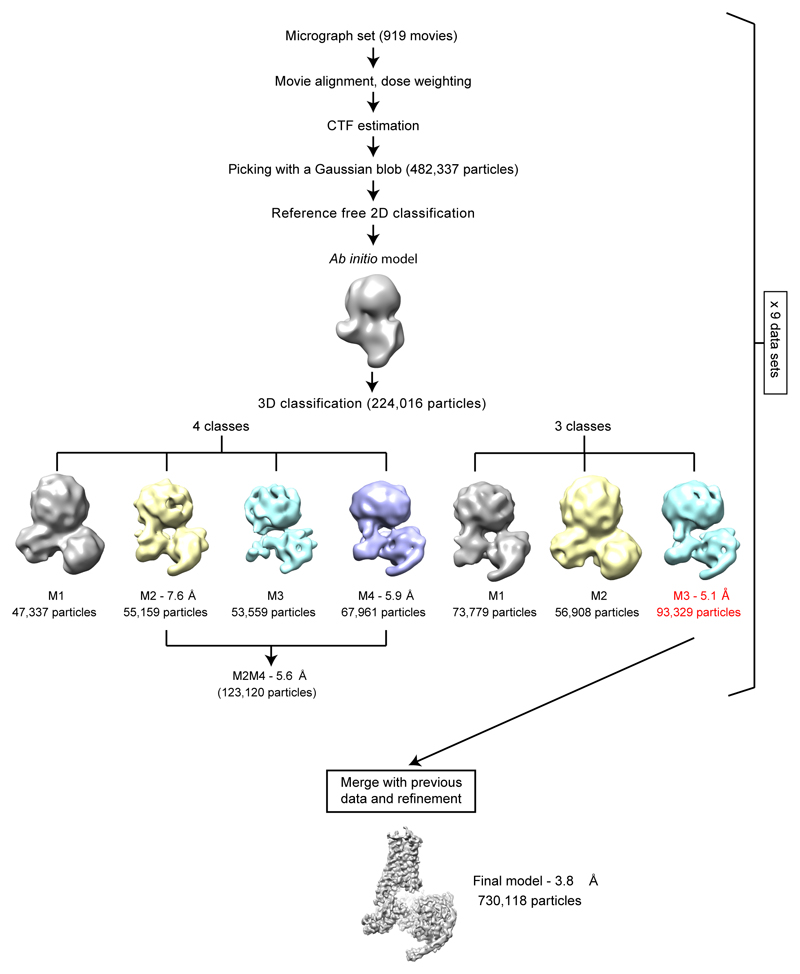
RELION-2.1 was used for all data processing31 unless otherwise specified. Since data were pooled from nine independent sessions we provide here the general strategy for data collection and processing, while precise particle numbers for a representative data set are presented in Extended Data Fig 3. Overall, drift, beam induced motion and dose weighting were corrected with MotionCor232 using 5 x 5 patches. CTF fitting and phase shift estimation were performed using Gctf-v0.1.0633 which yielded the characteristic pattern of phase shift accumulation over time for each position. Generally, 40 images were taken at each Volta phase plate position. Auto-picking was performed with a Gaussian blob as a template34 which readily resulted in optimal particle picking. Particles were extracted in a box of 150 pixels (159 Å) and inputted into a one or two reference-free 2D classification (if the majority of 2D classes had non-recognizable or low-quality features, then the selected particles belonging to quality classes were taken to a second round of 2D classification). An ab initio model was generated using 10,000 particles with RELION 2.135 in the first data collection and used throughout. The resulting particles after 2D classification where then used for 3D classification in both three and four classes simultaneously in order to check for consistency in 3D classification and to generate models with different numbers of particles. The models with best defined features were selected for refinement either on their own or together with a second class from the same 3D classification (if more than one quality model were present). The particles that reached the highest resolution after gold-standard resolution estimation were saved. Particles obtained in a similar fashion from the different sessions were then merged and refined together. During refinement, the low-pass filter effect of the Wiener filter in the regularised likelihood optimisation algorithm was relaxed through the use of a regularisation parameter (T=3). This allowed the refinement algorithm to consider higher spatial frequencies in the alignment of the individual particles. Nevertheless, both half-reconstructions were kept completely separately, and the final resolution estimate (at the post-processing stage in RELION) was based on the standard FSC between the two unfiltered half-reconstructions. The final model contained 730,118 particles and reached an overall resolution of 3.78 Å with side chains visible for most of the complex (Extended Data Figs 1 and 2). Local resolution estimates were calculated with Resmap36 showing a core of the protein at ~3.5 Å resolution and an extracellular region of the receptor and βγ N-termini at poorer resolution with the worst regions reaching ~5 Å (Extended Data Fig 1). Signal subtraction of the DM micelle did not improve the quality of the map upon refinement.
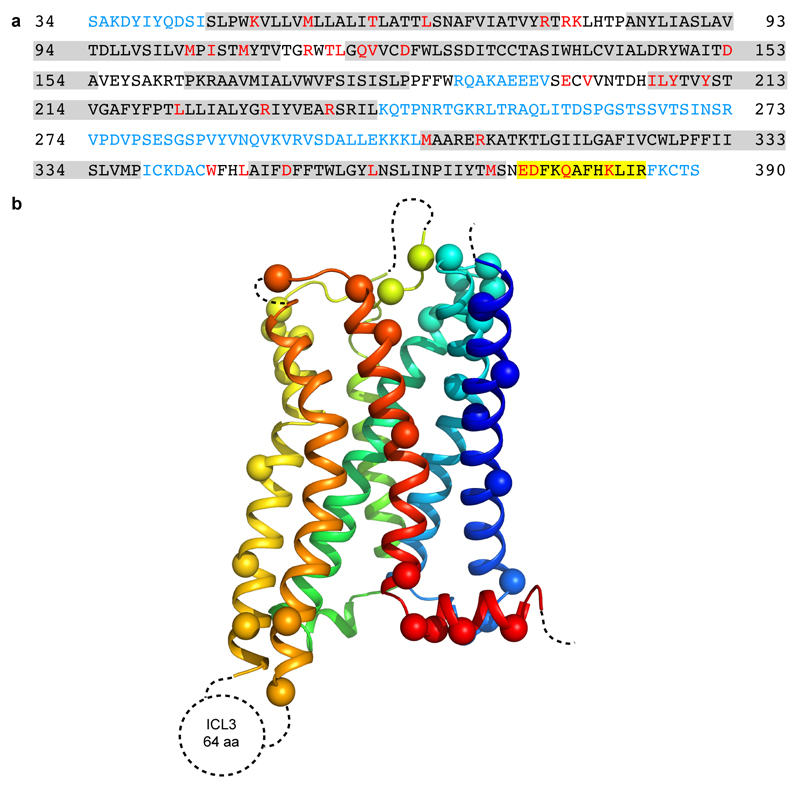
Model building and refinement was carried out using the CCP-EM software suite37. The 5-HT1BR-ergotamine crystal structure was used as a starting model (PDB ID 4IAR)15 for receptor building. 5-HT1BR was modelled from residue L45 to R385. Although density was present from Y38 and this region seems to adopt a similar conformation to the 5-HT1BR crystal structure, the poor resolution in this region prompted us to leave it unmodelled. Residues R188 to V196 in the ECL2 and I339 to C344 in ICL3 were flexible with absent or very poor map density and were therefore, not modelled. For the same reason residues K241 to L304 forming the large 5-HT1BR ICL3 loop were left unmodelled. Mini-GO was modelled from residue L5 to Y354 following native GαO numbering. Modifications in GαO to obtain mini-GO are explained in Nehme et al. (Extended Data Figure 7)10. Although β and γ subunits were modelled using the available crystal structures, poor density was found for both N-termini, with the whole of the γ subunit having poor density. For this reason the worst regions of these subunits were modelled as poly-alanine. Initial manual model building was performed in Coot38 following a jelly-body refinement in REFMAC539. Donitriptan coordinates and library were created with JLigand40 and manually fitted into the density using sphere real space refinement in Coot. Restraints were generated with ProSMART41 in order to maintain structural features in regions of poorer density. B factors were reset to 40 Å2 prior to refinement. The model then followed cycles of manual modifications in Coot and restraint refinement in REFMAC5. The final model achieved good geometry (Extended Data Table 1) with validation of model performed in Coot, Molprobity42 and EMRinger43. The goodness of fit of the model to the map was carried out using Phenix44 using a global model-vs-map FSC correlation (Extended Data Fig 2). Overfitting in refinement was monitored throughout using FSCwork/FSCtest45.
Note on limitations on the interpretation of density in the ligand binding pocket
The ligand binding pocket of 5-HT1BR is occupied by a single molecule of the agonist donitriptan. Despite the resolution varying between 3.8 Å to 4.3 Å in this region, estimated from the local resolution map (Extended Data Fig 1), the density allowed modelling of the position and orientation of donitriptan and the majority of the amino acid side chains in the pocket. However, the resolution limits the accuracy of the refined coordinates and care must be taken when analysing the precise details of any potential interactions. The best resolution is towards the centre of the membrane bilayer and gets worse towards the extracellular surface of the receptor. The ligand has been modelled using real space refinement taking into account the location of nearby residues as well as using a library of restraints with allowed conformations of donitriptan. The density allowed modelling of the position and orientation of the donitriptan molecule, with the indole group buried deep in the orthosteric binding pocket and the remainder of the ligand protruding towards the extracellular surface.
Clear interpretable density is found for large aromatic groups, while density is poorer for residues with smaller side chains such as Ser3346.55 and Ser2125.42. Tyr3597.43, Phe3306.51 and Phe3316.52 are positioned around the indole group at the base of the pocket and Phe3517.35 interacts with the donitriptan aromatic moiety at the most extracellular region. Met3376.58 is located in a region of poor density and has been modelled so that is oriented away from the pocket and interacting with the aromatic group of donitriptan. This was concluded based on interpretation of maps with different sharpening levels, but its rotamer cannot be assigned with confidence. The orientation of the primary amine on the serotonin moiety in donitriptan and the adjacent side chain of Asp1293.32 cannot be confidently assigned due to poor density. However, Asp1293.32 is absolutely conserved in all the human serotonin GPCRs and forms a hydrogen bond with ergotamine in the high-resolution crystal structure of 5-HT1BR. We have therefore modelled Asp1293.32 in a similar rotamer to make a potential hydrogen bond with this primary amine in donitriptan, despite the lack of density for both the primary amine and the carboxyl group of Asp1293.32.
Extended Data
Extended Data Figure 1. Cryo-EM single particle reconstruction of the 5-HT1BR–GO complex structure.
a, Representative micrograph (magnification 75,000x, defocus -0.6 μm) of the 5-HT1BR–GO complex collected using a Titan Krios with the Falcon III detector and Volta phase plate. b, Representative 2D class averages of the 5-HT1BR–GO complex. c, FSC curve of the final reconstruction showing an overall resolution of 3.8 Å using the gold-standard FSC of 0.143. Both masked and unmasked FSC curves are shown to highlight the lack of masking artefacts. d, Final reconstruction coloured by subunit showing a zoom on the weak density for ICL3. The zoomed region corresponds to a map sharpened with B = -50 to remove noise from lower density levels. e, Local resolution estimation of the 5-HT1BR map as calculated by Resmap.
Extended Data Figure 2. Cryo-EM map quality and model validation.
a, transmembrane helices of 5-HT1BR; b, the α5 helix of GO; c, donitriptan and the neighbouring side chains in the orthosteric binding site; d, Fourier shell correlation of the refined model versus the map (green curve) and FSCwork/FSCtest validation curves (blue and red curves, respectively).
Extended Data Figure 3. Flow-chart of data processing.
Micrographs were collected during nine sessions on the Titan Krios (either 24 h or 48 h) and each session was processed independently. The number of images and particles for one 48 h session is indicated on the flowchart as a guide. At the bottom of the figure, the final number of particles is shown. Each dataset was corrected separately for drift, beam induced motion and radiation damage. After CTF estimation, particles were picked using a Gaussian blob and submitted to either one or two rounds of reference-free 2D classification (see Methods). A 3D classification was performed on the selected particles using an ab initio model generated from ten thousand particles. Classification was performed in parallel in three and four classes. The models with best features were refined on their own; if there were two classes of similar high quality, these were then re-refined together (the resolution of the models refers to that after refinement and calculation of gold-standard FSC=0.143). The set of particles that obtained the best map quality and resolution were saved and merged with the best particles from other datasets. A final model with 730,118 particles was refined and achieved a global resolution of 3.78 Å.
Extended Data Figure 4. Modelling quality of the 5-HT1BR structure.
a, Amino acid sequence of 5-HT1BR construct used in the cryo-EM structure determination. Residues are colored according to how they have been modelled: black, good density allows the side chain to be modelled; red, limited density for the side chain present and therefore the side chain has been truncated to Cβ; blue, no density observed and therefore the residue was not modelled. Regions highlighted in grey represent the transmembrane α-helices and amphipathic helix 8 is highlighted in yellow. b, Model of 5-HT1BR showing the Cα positions of amino acid residues with poor density (spheres) and regions unmodelled (dotted lines).
Extended Data Figure 5. Superposition of donitriptan, adrenaline and adenosine.
5-HT1BR, β2AR3 and A2AR1 were superimposed (Pymol) over the whole of the receptor and the ligands coloured accordingly: green, donitriptan; pink, adrenaline; blue, adenosine.
Extended Data Figure 6. Comparison of the amino acid sequences of the α subunits of GO and GS.
Diamonds above the sequences identify the amino acid residues in Gαs where the side chains that make atomic contacts to residues in either β2AR (β2 con) or A2AR (2A con). Ovals above the sequences identify the amino acid residues in Gαs where only the main chain atoms make contacts to the receptor. Secondary structural elements are indicated as grey bars and the CGN system of numbering is shown.
Extended Data Figure 7. Similarity of Gα structures and the difference poses of the α5 helices in GαO and GαS coupled to receptors.
a, The structures of the α subunits coupled to 5-HT1BR, β2AR3 and A2AR1 were superimposed over the whole of their sequence in Pymol; blue, GαO coupled to 5-HT1BR; green, GαS coupled to A2AR; GαS coupled to β2AR. b, 5-HT1BR (blue), β2AR3 (green) and A2AR1 (red) were superimposed based on H3, H5 and H6. Two different views are shown with the red arrows indicating differences in orientation of GαS and GαO.
Extended Data Figure 8. Alignment of the amino acid sequences of GO and Gi α subunits.
Sequences in grey correspond to the α-helical region that do not make contact to GPCRs and was deleted during the construction of mini-GO. Secondary structural elements are depicted as grey bars with the CGN system shown to aid comparisons. Amino acids are highlighted as follows: pink, stabilizing residues required to generate mini-GO; yellow; residues in GαO that are different from residues conserved in all three Gαi sequences; blue, residues that are non-conserved in Gαi sequences. # represents the affinity tag on mini-Go used for purification (MGHHHHHHENLYFQG).
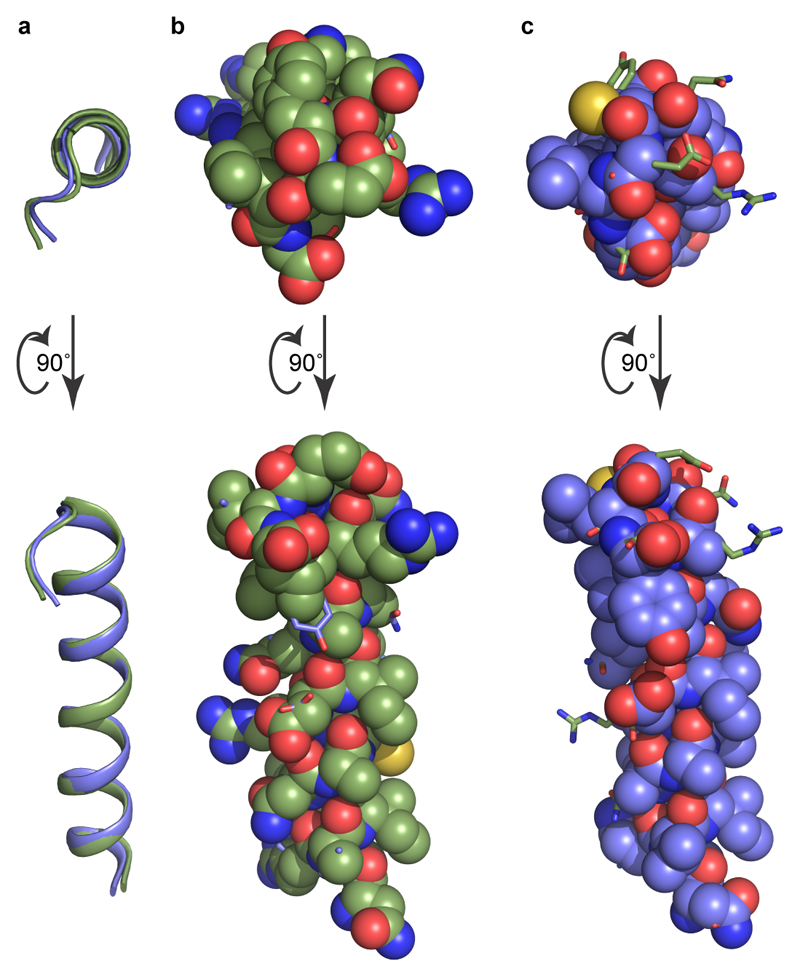
Extended Data Figure 9. Comparison between the α5 helices of GS and GO.
The α5 helices in the cryo-EM structures of A2AR-GS (carbon, green) and 5-HT1BR-GO (carbon, light blue) were aligned (Pymol) along their whole sequence and displayed in different poses: a, cartoon depiction; b, GS (green spheres), GO, (blue sticks); c, GO (blue spheres), GS, (green sticks).
Extended Data Table 1. Data collection and refinement statistics.
| 5-HT1B - MiniGOβγ (EMDB-4358) (PDB 6G79) |
|
|---|---|
| Data collection and processing | |
| Magnification | 75,000x |
| Voltage (kV) | 300 |
| Electron exposure (e-/Å2) | 30 |
| Defocus range (µm) | -0.3 to -1.0 |
| Pixel size (Å) | 1.06 |
| Symmetry imposed | CI |
| Initial particle images1 (no.) | 1,249,822 |
| Final particle images (no.) | 730,118 |
| Map resolution (Å) | 3.78 |
| FSC threshold | 0.143 |
| Map resolution range2 (Å) | ~3.4 to ~4.6 |
| Refinement | |
| Initial model used (PDB code) | 5G53, 3SN6 |
| Model resolution3 (Å) | 3.9 |
| FSC threshold | 0.5 |
| Map sharpening B factor (Å2) | -200 |
| Model composition | |
| Non-hydrogen atoms | 6053 |
| Protein residues | 6023 |
| Ligands | 30 |
| B factors (Å2) | |
| Protein | 97 |
| Ligand | 108 |
| R.m.s. deviations | |
| Bond lengths (Å) | 0.007 |
| Bond angles (°) | 1.02 |
| Validation | |
| MolProbity score | 1.07 |
| Clashscore | 0.61 |
| Poor rotamers (%) | 0.56 |
| EMRinger score | 2.34 |
| Ramachandran plot | |
| Favored (%) | 94.64 |
| Allowed (%) | 4.88 |
| Disallowed (%) | 0.48 |
After 2D classification
Local resolution range
Resolution at which FSC between map and model is 0.5
Supplementary Material
Acknowledgements
This work was funded by a grant from the European Research Council (EMPSI 339995), Heptares Therapeutics Ltd and core funding from the Medical Research Council [MRC U105197215]. We thank Julio Ortiz Espinosa and Ludovic Renault for their help in data collection at NeCEN; the data were essential for improving the sample used to collect the final dataset. We thank Sjors Scheres and Paula da Fonseca for useful discussions and Christos Savva and Giuseppe Cannone for microscopy technical support.
Footnotes
Author contributions
R.N. performed receptor expression, purification and complex formation. P.C.E. expressed and purified mini-GO and βγ. R.N and J.G-N. performed cryo-grid preparation. J.G-N. performed cryo-EM data collection, data processing and model building. J.G-N and C.G.T. carried out structure analysis and manuscript preparation. C.G.T. analysed data and managed the project. The manuscript was written by C.G.T and J.G-N., and included contributions from all the authors.
The authors declare the following competing interests: CGT is a shareholder, consultant and member of the Scientific Advisory Board of Heptares Therapeutics, who also partly funded this work.
Author information
Reprints and permissions information is available at www.nature.com/reprints.
Data availability. All data generated or analysed during this study are included in this published article and its Supplementary Information. The cryo-EM density map has been deposited in the Electron Microscopy Data Bank under accession code EMD-4358 and the coordinates have been deposited in the Protein Data Bank under accession number 6G79.
References
- 1.García-Nafría J, Lee Y, Bai X, Carpenter B, Tate CG. Cryo-EM structure of the adenosine A2A receptor coupled to an engineered heterotrimeric G protein. eLife. 2018;7:e35946. doi: 10.7554/eLife.35946. [DOI] [PMC free article] [PubMed] [Google Scholar]
- 2.Liang YL, et al. Phase-plate cryo-EM structure of a class B GPCR-G-protein complex. Nature. 2017;546:118–123. doi: 10.1038/nature22327. [DOI] [PMC free article] [PubMed] [Google Scholar]
- 3.Rasmussen SG, et al. Crystal structure of the beta2 adrenergic receptor-Gs protein complex. Nature. 2011;477:549–555. doi: 10.1038/nature10361. [DOI] [PMC free article] [PubMed] [Google Scholar]
- 4.Zhang Y, et al. Cryo-EM structure of the activated GLP-1 receptor in complex with a G protein. Nature. 2017;546:248–253. doi: 10.1038/nature22394. [DOI] [PMC free article] [PubMed] [Google Scholar]
- 5.Syrovatkina V, Alegre KO, Dey R, Huang XY. Regulation, Signaling, and Physiological Functions of G-Proteins. Journal of molecular biology. 2016;428:3850–3868. doi: 10.1016/j.jmb.2016.08.002. [DOI] [PMC free article] [PubMed] [Google Scholar]
- 6.Oldham WM, Hamm HE. Structural basis of function in heterotrimeric G proteins. Q Rev Biophys. 2006;39:117–166. doi: 10.1017/S0033583506004306. [DOI] [PubMed] [Google Scholar]
- 7.Flock T, et al. Universal allosteric mechanism for Galpha activation by GPCRs. Nature. 2015;524:173–179. doi: 10.1038/nature14663. [DOI] [PMC free article] [PubMed] [Google Scholar]
- 8.Venkatakrishnan AJ, et al. Molecular signatures of G-protein-coupled receptors. Nature. 2013;494:185–194. doi: 10.1038/nature11896. [DOI] [PubMed] [Google Scholar]
- 9.Oldham WM, Hamm HE. Heterotrimeric G protein activation by G-protein-coupled receptors. Nat Rev Mol Cell Biol. 2008;9:60–71. doi: 10.1038/nrm2299. [DOI] [PubMed] [Google Scholar]
- 10.Nehme R, et al. Mini-G proteins: Novel tools for studying GPCRs in their active conformation. PLoS One. 2017;12:e0175642. doi: 10.1371/journal.pone.0175642. [DOI] [PMC free article] [PubMed] [Google Scholar]
- 11.Masuho I, et al. Distinct profiles of functional discrimination among G proteins determine the actions of G protein-coupled receptors. Sci Signal. 2015;8:ra123. doi: 10.1126/scisignal.aab4068. [DOI] [PMC free article] [PubMed] [Google Scholar]
- 12.McCorvy JD, Roth BL. Structure and function of serotonin G protein-coupled receptors. Pharmacol Ther. 2015;150:129–142. doi: 10.1016/j.pharmthera.2015.01.009. [DOI] [PMC free article] [PubMed] [Google Scholar]
- 13.Berger M, Gray JA, Roth BL. The expanded biology of serotonin. Annu Rev Med. 2009;60:355–366. doi: 10.1146/annurev.med.60.042307.110802. [DOI] [PMC free article] [PubMed] [Google Scholar]
- 14.Wacker D, et al. Structural features for functional selectivity at serotonin receptors. Science. 2013;340:615–619. doi: 10.1126/science.1232808. [DOI] [PMC free article] [PubMed] [Google Scholar]
- 15.Wang C, et al. Structural basis for molecular recognition at serotonin receptors. Science. 2013;340:610–614. doi: 10.1126/science.1232807. [DOI] [PMC free article] [PubMed] [Google Scholar]
- 16.Yin W, et al. Crystal Structure of the huam 5-HT1B serotonin receptor bound to an inverse agonist. Cell Discovery. 2018;4:12. doi: 10.1038/s41421-018-0009-2. [DOI] [PMC free article] [PubMed] [Google Scholar]
- 17.Albert PR, Tiberi M. Receptor signaling and structure: insights from serotonin-1 receptors. Trends Endocrin Met. 2001;12:453–460. doi: 10.1016/s1043-2760(01)00498-2. [DOI] [PubMed] [Google Scholar]
- 18.Ring AM, et al. Adrenaline-activated structure of beta2-adrenoceptor stabilized by an engineered nanobody. Nature. 2013;502:575–579. doi: 10.1038/nature12572. [DOI] [PMC free article] [PubMed] [Google Scholar]
- 19.Lebon G, et al. Agonist-bound adenosine A2A receptor structures reveal common features of GPCR activation. Nature. 2011;474:521–525. doi: 10.1038/nature10136. [DOI] [PMC free article] [PubMed] [Google Scholar]
- 20.Carpenter B, Nehme R, Warne T, Leslie AG, Tate CG. Structure of the adenosine A(2A) receptor bound to an engineered G protein. Nature. 2016;536:104–107. doi: 10.1038/nature18966. [DOI] [PMC free article] [PubMed] [Google Scholar]
- 21.Lebon G, Warne T, Tate CG. Agonist-bound structures of G protein-coupled receptors. Curr Opin Struct Biol. 2012 doi: 10.1016/j.sbi.2012.03.007. [DOI] [PubMed] [Google Scholar]
- 22.Bae H, Cabrera-Vera TM, Depree KM, Graber SG, Hamm HE. Two amino acids within the alpha4 helix of Galphai1 mediate coupling with 5-hydroxytryptamine1B receptors. J Biol Chem. 1999;274:14963–14971. doi: 10.1074/jbc.274.21.14963. [DOI] [PubMed] [Google Scholar]
- 23.Venkatakrishnan AJ, et al. Diverse activation pathways in class A GPCRs converge near the G-protein-coupling region. Nature. 2016;536:484–487. doi: 10.1038/nature19107. [DOI] [PMC free article] [PubMed] [Google Scholar]
- 24.Flock T, et al. Selectivity determinants of GPCR-G-protein binding. Nature. 2017;545:317–322. doi: 10.1038/nature22070. [DOI] [PMC free article] [PubMed] [Google Scholar]
- 25.Kobilka BK, Deupi X. Conformational complexity of G-protein-coupled receptors. Trends Pharmacol Sci. 2007;28:397–406. doi: 10.1016/j.tips.2007.06.003. [DOI] [PubMed] [Google Scholar]
- 26.Scheerer P, et al. Crystal structure of opsin in its G-protein-interacting conformation. Nature. 2008;455:497–502. doi: 10.1038/nature07330. [DOI] [PubMed] [Google Scholar]
- 27.Grundmann M, Kostenis E. Temporal Bias: Time-Encoded Dynamic GPCR Signaling. Trends Pharmacol Sci. 2017;38:1110–1124. doi: 10.1016/j.tips.2017.09.004. [DOI] [PubMed] [Google Scholar]
- 28.Lane JR, May LT, Parton RG, Sexton PM, Christopoulos A. A kinetic view of GPCR allostery and biased agonism. Nat Chem Biol. 2017;13:929–937. doi: 10.1038/nchembio.2431. [DOI] [PubMed] [Google Scholar]
- 29.Isberg V, et al. GPCRdb: an information system for G protein-coupled receptors. Nucleic Acids Res. 2016;44:D356–364. doi: 10.1093/nar/gkv1178. [DOI] [PMC free article] [PubMed] [Google Scholar]
- 30.Ballesteros JA, Weinstein H. In: Methods in Neurosciences. Sealfon SC, Conn PM, editors. Vol. 25. Academic Press; 1995. pp. 366–428. [Google Scholar]
- 31.Kimanius D, Forsberg BO, Scheres SH, Lindahl E. Accelerated cryo-EM structure determination with parallelisation using GPUs in RELION-2. Elife. 2016;5 doi: 10.7554/eLife.18722. [DOI] [PMC free article] [PubMed] [Google Scholar]
- 32.Zheng SQ, et al. MotionCor2: anisotropic correction of beam-induced motion for improved cryo-electron microscopy. Nat Methods. 2017;14:331–332. doi: 10.1038/nmeth.4193. [DOI] [PMC free article] [PubMed] [Google Scholar]
- 33.Zhang K. Gctf: Real-time CTF determination and correction. J Struct Biol. 2016;193:1–12. doi: 10.1016/j.jsb.2015.11.003. [DOI] [PMC free article] [PubMed] [Google Scholar]
- 34.Fernandez-Leiro R, Scheres SHW. A pipeline approach to single-particle processing in RELION. Acta Crystallogr D Struct Biol. 2017;73:496–502. doi: 10.1107/S2059798316019276. [DOI] [PMC free article] [PubMed] [Google Scholar]
- 35.Scheres SH. RELION: implementation of a Bayesian approach to cryo-EM structure determination. J Struct Biol. 2012;180:519–530. doi: 10.1016/j.jsb.2012.09.006. [DOI] [PMC free article] [PubMed] [Google Scholar]
- 36.Kucukelbir A, Sigworth FJ, Tagare HD. Quantifying the local resolution of cryo-EM density maps. Nat Methods. 2014;11:63–65. doi: 10.1038/nmeth.2727. [DOI] [PMC free article] [PubMed] [Google Scholar]
- 37.Burnley T, Palmer CM, Winn M. Recent developments in the CCP-EM software suite. Acta Crystallogr D Struct Biol. 2017;73:469–477. doi: 10.1107/S2059798317007859. [DOI] [PMC free article] [PubMed] [Google Scholar]
- 38.Emsley P, Cowtan K. Coot: model-building tools for molecular graphics. Acta Crystallogr D Biol Crystallogr. 2004;60:2126–2132. doi: 10.1107/S0907444904019158. [DOI] [PubMed] [Google Scholar]
- 39.Murshudov GN, et al. REFMAC5 for the refinement of macromolecular crystal structures. Acta Crystallogr D Biol Crystallogr. 2011;67:355–367. doi: 10.1107/S0907444911001314. [DOI] [PMC free article] [PubMed] [Google Scholar]
- 40.Lebedev AA, et al. JLigand: a graphical tool for the CCP4 template-restraint library. Acta Crystallogr D Biol Crystallogr. 2012;68:431–440. doi: 10.1107/S090744491200251X. [DOI] [PMC free article] [PubMed] [Google Scholar]
- 41.Nicholls RA, Long F, Murshudov GN. Low-resolution refinement tools in REFMAC5. Acta Crystallogr D Biol Crystallogr. 2012;68:404–417. doi: 10.1107/S090744491105606X. [DOI] [PMC free article] [PubMed] [Google Scholar]
- 42.Chen VB, et al. MolProbity: all-atom structure validation for macromolecular crystallography. Acta Crystallogr D Biol Crystallogr. 2010;66:12–21. doi: 10.1107/S0907444909042073. [DOI] [PMC free article] [PubMed] [Google Scholar]
- 43.Barad BA, et al. EMRinger: side chain-directed model and map validation for 3D cryo-electron microscopy. Nat Methods. 2015;12:943–946. doi: 10.1038/nmeth.3541. [DOI] [PMC free article] [PubMed] [Google Scholar]
- 44.Adams PD, et al. PHENIX: a comprehensive Python-based system for macromolecular structure solution. Acta Crystallogr D Biol Crystallogr. 2010;66:213–221. doi: 10.1107/S0907444909052925. [DOI] [PMC free article] [PubMed] [Google Scholar]
- 45.Amunts A, et al. Structure of the yeast mitochondrial large ribosomal subunit. Science. 2014;343:1485–1489. doi: 10.1126/science.1249410. [DOI] [PMC free article] [PubMed] [Google Scholar]
Associated Data
This section collects any data citations, data availability statements, or supplementary materials included in this article.


