Abstract
PET image reconstruction is highly susceptible to the impact of Poisson noise, and if shorter acquisition times or reduced injected doses are used, the noisy PET data become even more limiting. The recent development of kernel expectation maximisation (KEM) is a simple way to reduce noise in PET images, and we show in this work that impressive dose reduction can be achieved when the kernel method is used with MR-derived kernels. The kernel method is shown to surpass maximum likelihood expectation maximisation (MLEM) for the reconstruction of low-count datasets (corresponding to those obtained at reduced injected doses) producing visibly clearer reconstructions for unsmoothed and smoothed images, at all count levels. The kernel EM reconstruction of 10% of the data had comparable whole brain voxel-level error measures to the MLEM reconstruction of 100% of the data (for simulated data, at 100 iterations). For regional metrics, the kernel method at reduced dose levels attained a reduced coefficient of variation and more accurate mean values compared to MLEM. However, the advances provided by the kernel method are at the expense of possible over-smoothing of features unique to the PET data. Further assessment on clinical data is required to determine the level of dose reduction that can be routinely achieved using the kernel method, whilst maintaining the diagnostic utility of the scan.
Index Terms: image reconstruction, PET-MR, positron emission tomography, dose reduction
I. Introduction
Neurological positron emission tomography (PET) provides insight into the functional and metabolic processes of the brain, and therefore is widely used in Alzheimer’s disease, epilepsy and oncology. The desire to reduce the radiation dose to the patient inherently leads to low-count measured data that has a high level of Poisson noise. The chosen reconstruction methodology is therefore key in recovering the radiotracer distribution whilst mitigating the impact of noise.
The widely used reconstruction methodology of maximum likelihood expectation maximisation (MLEM) [1] reconstructs noisy emission images from noisy PET projection data. Through the maximum a posteriori expectation maximisation (MAPEM) [2], [3] or penalised maximum likelihood (PML) [4] frameworks, prior information can be incorporated to constrain the reconstruction process. The prior information is used as a penalty term in the maximum likelihood objective, penalising differences in the reconstructed image relative to the a priori image distribution. Multiple forms of the Gibbs based priors have been investigated [5] such as the quadratic prior. The prior term can be extended to enforce similarity to a prior anatomical image [6]–[8] which leads to improved quantitative accuracy [9], [10] in comparison to the quadratic prior. A list of anatomically-based priors is given in [11]. The advance in simultaneous PET-MR [12] systems, further harnesses anatomical information through the excellent soft tissue contrast of neurological brain regions in co-registered MR images. In [18F]FDG scans the radiotracer uptake is delineated between the grey and white matter boundary, leading to similar structure in both PET and MR images. The MR-guided Bowsher prior [13], has demonstrated improved detail recovery and noise reduction compared to MLEM and other anatomical priors [10]. An alternative to using the prior image as a penalty is to extract spatial basis functions from the image [14] for reparameterisation. This can be achieved via the kernel [11], [15], [16], supervoxel [17] and dictionary based methods [18]–[20]. These methods all demonstrate reduced noise and improved detail retention for shared PET-MR structures. The kernel method in particular has improved ROI quantification relative to the Bowsher method [11], is simple to implement and has previously been employed for dynamic PET [15], [21], MR-guided PET [11], [16], fluorescence molecular tomography [22], [23] and diffuse optical tomography [24].
The noise mitigating properties of the kernel method can be applied in order to either: improve reconstructed image quality for normal count levels of PET data; or reconstruct low count data to an image quality comparable to that of a standard count level reconstructed image. Low count data corresponds to a reduced injected activity and hence a reduced patient dose for a fixed scan time. The ability to reduce patient dose can reduce the patients’ cancer risk, the cost per scan, and would widen the demographic of healthy volunteers and patients who can undergo PET scans. Previous work in this area has investigated reduced dose (low count) PET scans with the conventional MLEM reconstruction. This was undertaken for the applications of detecting oncological lesions [25], diagnosis of Alzheimer’s disease [26] and lung cancer screening [27]. These papers illustrate the clinical relevance of reduced dose PET scans, and the capability of reducing dose whilst maintaining diagnostic utility. The use of MAPEM anatomical regularisation for the reconstruction of reduced count data has also been investigated by [28], [29]. The kernel method provides an alternative way of using MR data for the reconstruction of reduced count PET data, with the advantage of the implementation simplicity and robustness of the EM optimization algorithm.
In this paper, the impact of the kernel parameters on the reconstructed images is studied. A kernel parameter selection process is employed to achieve closer to optimal noise mitigation properties of the kernel method on real data. For the selected parameters, the kernel method is applied to low count, reduced dose data. The kernel and MLEM methods are investigated for varied count and post smoothing levels.
II. Theory
MLEM, along with variants such as OSEM, is the most widely used type of reconstruction algorithm in PET imaging. It is an iterative algorithm that seeks to maximise the Poisson log likelihood between the emission image (x) and the PET projection data (m):
| (1) |
| (2) |
where A is the system matrix, r is the randoms, s is the scatters and q is the expectation of the projection data. This leads to the voxel-based update equation, where the voxel coefficients are updated at each iteration based on the ratio between the measured and expected projection data:
| (3) |
In this notation vector by vector division and multiplication correspond to elementwise operations. Due to the ill conditioned nature of the reconstruction problem and the low count statistics present in the projected data, the unconstrained MLEM reconstruction leads to noisy reconstructed images. In practise, the reconstruction is stopped prior to convergence and post reconstruction smoothing is applied to mitigate the impact of noise. This degrades both tissue contrast and resolution. Due to MLEM’s spatially-variant convergence rate, early termination also leads to spatially-variant regional quantification.
The kernel method [15] reparameterises the EM algorithm (KEM) into an alternative set of spatial basis functions (kernel matrix K) and coefficients (α). The standard MLEM algorithm is applied to directly find the maximum likelihood estimate of the kernel coefficients (α):
| (4) |
The emission image and the expected projection data are expressed in terms of these MR derived spatial basis functions:
| (5) |
The kernel method extracts spatial information from a co-registered MR image (MR-guided kernel method [11], [16]) to form the basis functions. The MR image is resampled to PET resolution. The kernel basis functions are constructed by comparing the feature vector (f) for a given voxel (j) to the feature vectors for all other voxels (l) within its spatial neighbourhood. The feature vector f j is the intensity of the MR voxels within a cubic patch centred on voxel j as described in [11]. For example, a feature vector f j with a patch length of 3, is a 3×3×3 cubic patch of voxels centred on voxel j, from which a 27×1 vector of voxel intensities is extracted. The feature vectors were normalised by their standard deviation, where σm(f) is the standard deviation for the mth element of each feature vector, over all voxels:
| (6) |
Each basis function is further sparsified by selecting only the k most similar voxels i.e. k feature space nearest neighbours (kNN) to contribute to the basis function. The Euclidean distance between feature vectors f j and f l (where the lth voxel lies within the neighbourhood of j) is used to determine the k nearest neighbours in feature space. All other voxels in the basis function are set to zero:
| (7) |
where κ(f j, f l) is the weighting of a neighbouring voxel l in the basis function of voxel j, based on the feature and spatial similarity:
| (8) |
where σ f and σs refer to the feature space and spatial standard deviation respectively. z is the position vector of the voxel. The kernel matrix is row normalised to account for the different number of basis functions each voxel contributes to. Failing to use row normalisation resulted in voxels that only contribute to very few basis functions (e.g. just their own) having anomalously high or low weights.
III. Phantom Simulation
A 3D and 2D PET-MR phantom were constructed from the BrainWeb [30] segmented T1 MR phantom. The 3D phantom has a grid size of 344 × 344 × 127 and voxel size 2.08626 mm × 2.08626 mm × 2.03125 mm, equivalent to that of the Siemens mMR scanner. A high intensity lesion was added to the PET phantom in the white matter of the frontal lobe, which was not present in the T1 image. The PET phantom was projected into sinogram space and rescaled with a total prompts count of 5 × 10⁸, and a randoms and scatter fraction of 20% each. The PET projection data of the ground truth was rescaled to 50%, 25%, 10%, 5% and 1% of the total counts, with Poisson noise applied subsequently. Gaussian white noise was also added to the T1 MR phantom. A transverse slice of the PET-MR phantom was used to form the 2D phantom, with the PET phantom projected into sinogram space, and rescaled to 3.3×10⁶ counts.
IV. Real Data
An [18F]FDG scan was obtained on a Siemens Biograph mMR PET-MR. The total prompt counts were 4.69 × 10⁸, with a scan duration of 23 minutes. The tracer activity at time of injection (81 minutes prior to start of image acquisition) was 229 MBq. A T1-weighted MPRAGE MR image was acquired simultaneously with the PET scan, from which the kernel basis functions were derived. The raw prompts and delays count data were randomly resampled (without replacement), producing resampled PET data from 1% to 50% of the original count level.
V. Parameter Selection
The kernel matrix is dependent on the: number of feature space nearest neighbours (k), patch size (p), neighbourhood size, spatial (σs) and feature vector (σ f) standard deviation. This corresponds to a high dimensional parameter space, that is not feasible to fully search, especially for 3D data. Prior work on the MR-guided kernel method for PET reconstruction [11], [16] selected parameters through a combination of empirical evidence and single-parameter line searches. The kernel method has also been employed for the reconstruction of fluorescence molecular tomography [22], [23] and diffuse optical tomography [24], with further evaluation of the kernel parameters. Due to the lack of consensus on parameter selection for previous work on the kernel method, and the dependency of parameter choice on the application, a separate parameter search is undertaken here.
In this paper the kernel method parameter selection was based on line searches of the parameter space using 3D real data. The real data parameter line search was initialised with parameters that minimised the whole brain NRMSE for multiple random lines searches using a 2D phantom.
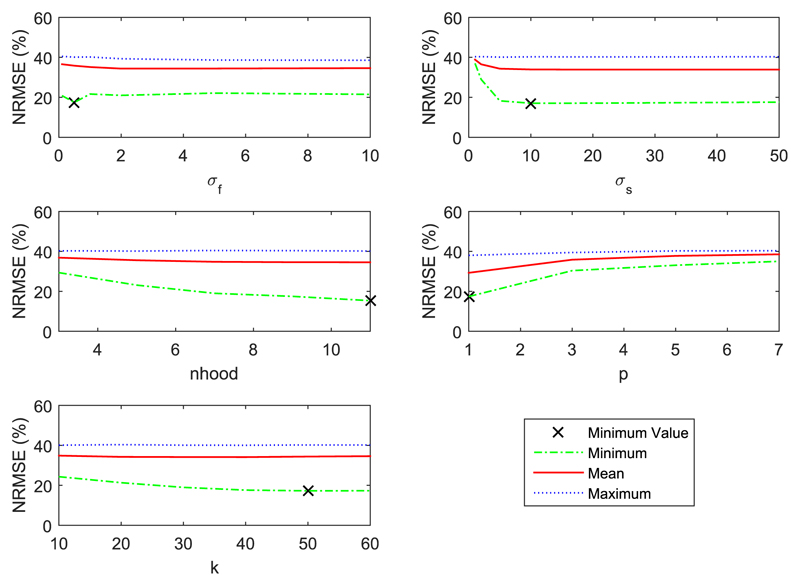
For the 2D phantom dataset a parameter line search was repeated 50 times for each parameter, with the four other fixed kernel parameters randomly selected for each repetition, Fig. 1. Whole brain NRMSE (9) (xGT is the ground truth) was used for the kernel parameter selection, which favours suppression of noise across the entire image. The choice of whole brain NRMSE may lead to over-smoothed images, and poor recovery of features unique to the PET data. Therefore, the choice of optimization error metric is highly application dependent. Region specific error metrics of tumour NRMSE, coefficient of variation and mean are calculated in subsequent sections to show the regional smoothing, noise reduction, and quantitative effect of the kernel method. The NRMSE is given by:
| (9) |
Fig. 1.
Repeated line search of each kernel parameter for a 2D simulated phantom. Each line search is repeated for 50 realisations of the other four fixed parameters. NRMSE refers to whole brain NRMSE.
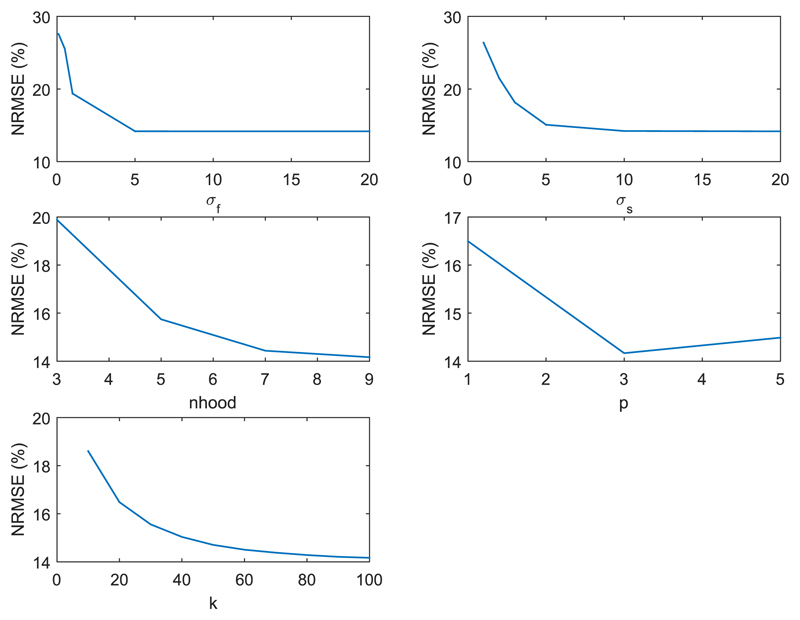
Due to the difference between the simulated brain phantom and real data, real 3D PET-MR data was used for a separate parameter search. A real data 1D line search for each of the five kernel parameters was undertaken, Fig. 2, with each parameter updated to the value that minimised the NRMSE. If any of the chosen parameter values were changed, the line search over all five parameters would be repeated, until the chosen parameters remained unchanged. The 3D real data line search was initialised with the simulation derived parameters. The NRMSE calculation for real data compared the kernel method applied to 1% of the FDG data, with the full count MLEM reconstruction as the ground truth, both post smoothed by 4mm. The scope of variation in the real data reconstructed images with respect to each parameter is shown in Fig. 3, at the maximum and minimum value of each parameter. The real data parameter search was repeated with an alternative 1% subset of the PET data, and returned the same parameters, Table 1. These parameters correspond to large basis functions that supress noise, at the expense of over smoothing possible PET unique features.
Fig. 2.
Parameter line search for real 3D FDG data, initialised using the parameters determined from the 2D setup. Multiple cycles of the individual 1D parameter line search is undertaken until each parameter value remains unchanged. These graphs show the 1D parameter search for each parameter for the last cycle over all parameters.
Fig. 3.

The reconstructed KEM image using the maximum and minimum kernel parameter value in the range of each parameter. The left image (for each parameter) corresponds to the reconstructed image using the smallest kernel parameter value in the range, and the right image is reconstructed image using the largest kernel parameter. The remaining fixed kernel parameters are the 3D chosen parameters stated in Table 1.
Table I.
Kernel parameters that minimise whole brain NRMSE for the 2D and 3D parameter selection methods. For implementation, neighbourhood size is reduced to 7 and the k parameter is varied with respect to count level. Neighbourhood and patch size are sampled over the range stated for the odd numbers only. The k parameter is sample in intervals of 10. The standard deviation parameters are unevenly sampled in the given range, with a greater number of lower values investigated.
| Parameter Names | 2D Chosen Parameters | 2D Parameter Range | 3D Chosen Parameters | 3D Parameter Range |
|---|---|---|---|---|
| σf | 0.5 | 0.1-10 | 20 | 0.1-20 |
| σs | 10 | 1-50 | 20 | 1-20 |
| Neighbourhood | 11 | 3-11 | 9 | 3-9 |
| Patch Size | 1 | 1-7 | 3 | 1-5 |
| k | 50 | 10-60 | 100 | 10-100 |
For implementation, the neighbourhood size was reduced to 7, due to computational speed and to prevent long range voxel correlations. The number of k nearest neighbours k was used as the tuning parameter for amount of MR constraint, i.e. lower dose PET images were reconstructed with higher k value kernels.
VI. Methods and Results
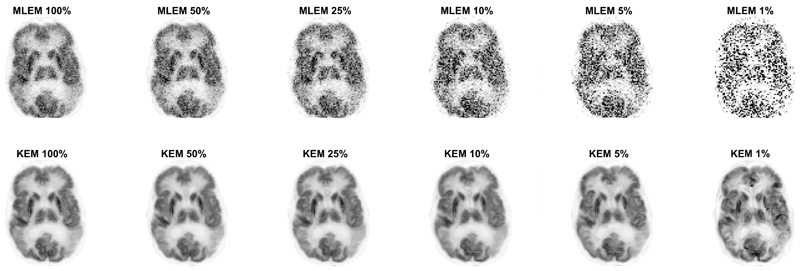
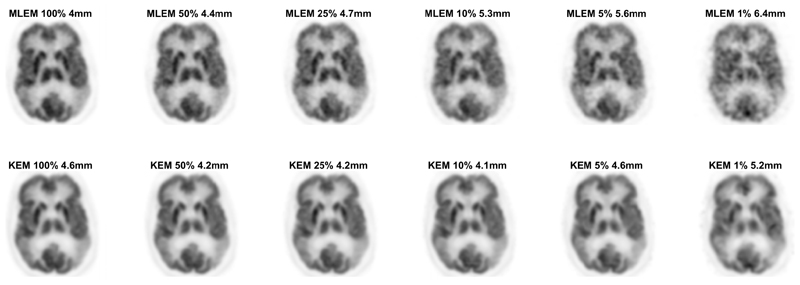
The kernel and MLEM methods were evaluated again for real patient [18F]FDG data, at multiple count levels. The reduced dose reconstructed images for the KEM and MLEM methods with no post-reconstruction smoothing are shown in Fig. 9. The standard full dose MLEM reconstruction underwent 4mm post reconstruction smoothing to reduce the impact of noise [12], [31]. To match the noise level for the reduced dose images, the whole brain NRMSE between the reduced dose image and the full dose MLEM image (4mm post reconstruction smoothed) was calculated for a series of smoothing widths applied to the reduced dose image. The smoothing width for the low dose image that minimized the NRMSE was then determined through interpolation and applied to each image, Fig. 10.
Fig. 9.
2D slice of the KEM and MLEM reconstruction of the 3D FDG data resampled at varying count levels. Reconstruction shown at 100 iterations. Kernel parameters used are stated in Table 1. k value varied with count level (10, 25, 25, 50, 50, 50 respectively).
Fig. 10.
2D slice of the KEM and MLEM reconstruction of the 3D FDG data resampled at varying count levels. All images have undergone post reconstruction smoothing, with the FWHM stated above each image. The width of the FWHM was chosen to minimise the NRMSE between the reduced dose image and the full count MLEM data, with 4mm post reconstruction smoothing. Reconstruction shown at 100 iterations.
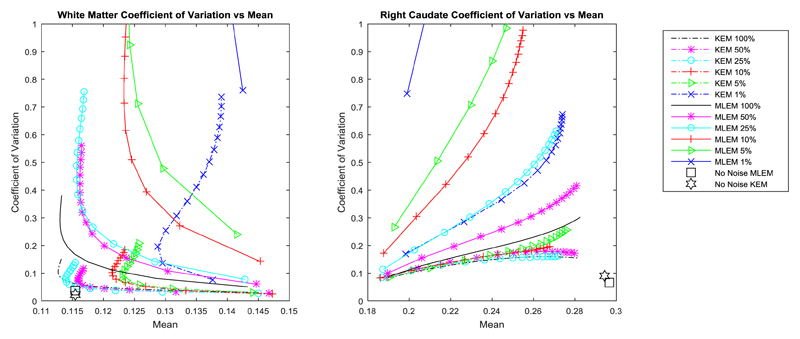
The whole brain NRMSE deviation between the KEM or MLEM reconstruction of reduced dose data and the full dose MLEM reconstruction (at 300 iterations) is investigated (Fig. 11) with respect to post reconstruction smoothing and iteration number. As before, the low dose reconstruction and the full dose MLEM reconstructions are both smoothed according to the level indicated on the axis. Fig. 12, shows the coefficient of variation vs mean values for the right caudate and a white matter region.
Fig. 11.
Whole brain NRMSE between smoothed reduced dose reconstruction and the MLEM reconstruction of the full dose data at 300 iterations. Both the reduced dose reconstruction and the full dose reference are smoothed by the specified FWHM. The results are shown for different iteration numbers
Fig. 12.
Coefficient of variation vs mean value for a white matter region and the right caudate, calculated from the KEM and MLEM reconstructions of the real data.
VII. Discussion
The MLEM images of low dose data with no post reconstruction smoothing applied, Fig. 4 and Fig. 9, were highly degraded at reduced dose levels for both simulated and real PET FDG data. In comparison, the KEM images of the low dose data are visually less noisy, and retain many detailed structures present in the noise free or high count data MLEM reconstructed images. For the KEM reconstruction of the 1% data an unrealistic recovery of MR features can be seen in both the simulated and real data KEM reconstructions. The application of post reconstruction smoothing, shown in Fig. 10, reduces the impact of noise for the low dose MLEM images, and removes the artificial looking MRI structures from the kernel images. The kernel reconstructions of low-dose data still maintain closer visual similarity to the full dose equivalent, than the corresponding MLEM reconstruction. Features such as the caudate, putamen and thalamus are clear in the kernel method, to a reduced dose level of 5%, which is not achievable for MLEM. For the 1% kernel and MLEM reconstructions, visual differences can be seen compared to the full dose reconstruction, e.g. the increased asymmetry of the thalamus and the poor recovery of the putamen. This illustrates a potential limitation for the level of dose reduction achievable using the kernel method.
Fig. 4.
2D slice of the MLEM and KEM reconstructions for reduced dose data of the 3D phantom. Reconstructions shown from 1% to 100% of the full count data, at 100 iterations. Kernel parameters used are stated in Table 1. k value varied with count level (10, 25, 25, 50, 50, 50 respectively). Tumour present in the PET data is not present in the T1 image. The location of the tumour is indicated by the red arrow.
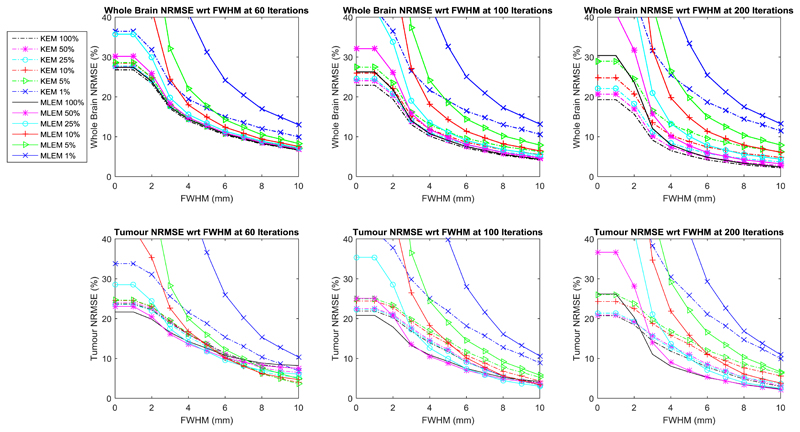
For the simulated data, the KEM reconstructed image of 100% of the data provides the lowest whole brain NRMSE, Fig. 5, irrespective of post reconstruction smoothing. The kernel reconstruction of 10% of the data has comparable whole brain NRMSE to the MLEM reconstruction of 100% of the data (for simulated data, at 100 iterations). The NRMSE of the KEM reconstructed images are also very closely grouped (between the 100%-5% dose levels), demonstrating that the kernel method is relatively insensitive to reduced dose. However, the increase in post reconstruction smoothing level unsurprisingly reduces the improvement of the kernel method over MLEM, at the expense of resolution. Similar trends are also seen for the real data NRMSE in Fig. 11, where both the kernel method and MLEM are compared to the MLEM image of 100% dose data, at 300 iterations. In Fig. 11, the NRMSE curves for the kernel reconstructed images are also tightly grouped as was the case for the simulated data. The use of the MLEM reconstructed image of 100% data as the real data reference image in the NRMSE calculation, makes it unfair to directly compare the KEM and MLEM NRMSE values. This is particularly true for high count levels, and for low levels of post reconstruction smoothing, where the MLEM reconstructed images will inherently be more like the chosen reference image. For these cases, the simulated data provide a more reliable assessment of the performance of the different methods.
Fig. 5.
Whole brain and tumour NRMSE between smoothed reduced dose reconstruction and the MLEM reconstruction of the noise free data at 300 iterations, for the 3D phantom data. Both the reduced dose reconstruction and the full dose reference are smoothed by the specified FWHM. The results are shown for different iteration numbers.
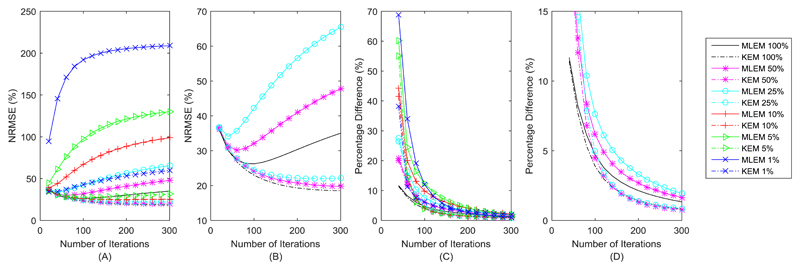
Figure 6A and Fig. 6B showed the variation of the KEM and MLEM whole brain NRMSE curves with respect to iteration number, with the minimum kernel NRMSE value outperforming the minimum MLEM NRMSE value for a given count level. MLEM shows a steep rise in NRMSE values at high iteration numbers, in comparison the KEM NRMSE values at high iteration numbers remain closer to their minimum value. This indicates the kernel method’s relative insensitivity to iteration number (for high count data). For reconstructed images of lower count data, the minimum NRMSE value occurs at earlier iteration numbers. Figure 6C and Fig. 6D show that the kernel method tends to converge faster than the MLEM reconstruction for the same count data, with the kernel method for any count level (except 1% data), converging at a similar rate.
Fig. 6.
Panels A and B show the variation in whole brain NRMSE with respect to iteration number. B shows the higher count data only. C and D show the average pixel RMS percentage difference between iterations (shown for steps of 20) for each method. D shows the higher count data only.
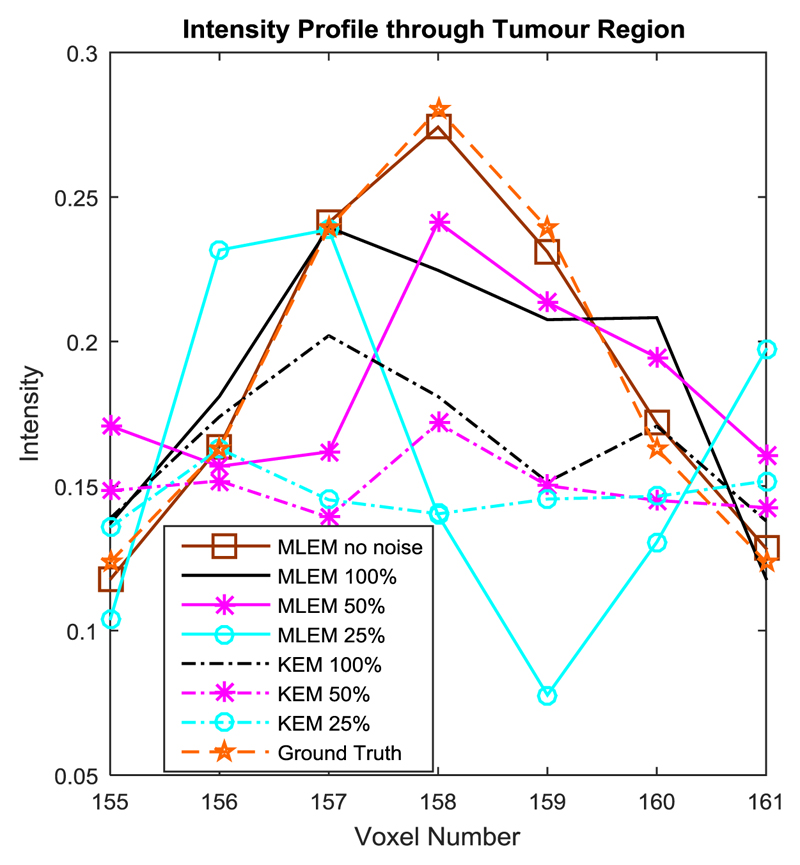
The kernel method is outperformed by the MLEM reconstruction of the high intensity lesion in the simulated data, in terms of NRMSE and visually. Figure 8 showed the suppression of the tumour region reconstructed by the kernel method (at all count levels) in comparison to the MLEM method. The MLEM reconstructions of this region are also impacted by noise at lower count levels, and are therefore not shown. This agrees with the findings of [11] and demonstrates a clear limitation in the MR-guided kernel method in the recovery of features unique to the PET data.
Fig. 8.
Horizontal intensity profile through the tumour region in the frontal white matter region, at 100 iterations.
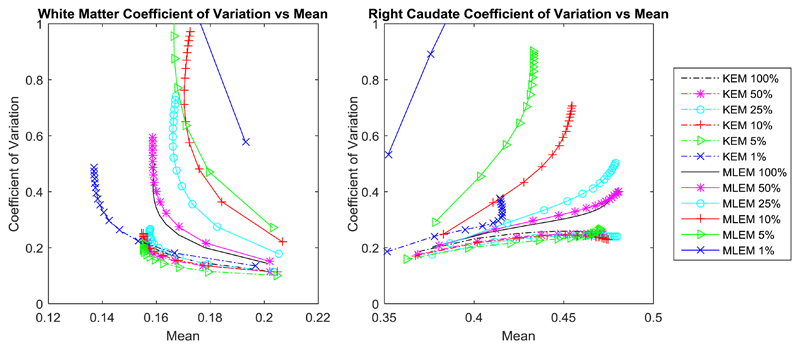
The regional error metrics also show a clear reduction in noise (coefficient of variation) for the KEM reconstruction of both simulated and real data, as was seen in Fig. 7 and Fig. 12 respectively. For the right caudate, the KEM mean values of the reduced dose simulated data are shown to be closer to the true value compared to MLEM at reduced doses. There is a similar pattern between the simulated and real data curves, from which it can be inferred that the KEM mean values of the reduced dose real data are closer to the true mean value for the right caudate region. For real data, the KEM mean value of the right caudate for the different dose level reconstructed images (5%-100%) are within 5.7% of one another. For the white matter region, the KEM mean values for real data are also closely grouped within 5.9% of one another, between the 100% and 5% data levels. This demonstrates the minimal impact of dose reduction on the quantitative reconstruction values of the kernel method.
Fig. 7.
Coefficient of variation vs mean value for a white matter region and the right caudate, calculated for the KEM and MLEM reconstructions of the simulated data. The corresponding value for the MLEM reconstruction of the no noise data at 300 iterations is shown by the single black square, with the KEM reconstruction of the no noise data shown by the black star. The ground truth value for the caudate region and the white matter region are 0.306 and 0.116 respectively.
VIII. Limitations
The kernel method has demonstrated improvements in the reconstruction of low dose data from both a visual and quantitative standpoint. However, although visually little impact is seen in the kernel reconstruction of reduced dose data (down to 5%), small deviations in the NRMSE values for the real data reconstructions are seen for all reduced count levels. The impact of the slight variation in the KEM reconstruction of the reduced dose data should be assessed by a clinician, to determine to what count level the low count kernel images remain diagnostically comparable to the full count reconstructions.
In addition, the MR-guided kernel method is adversely affected through incorrect anatomical guidance, as shown here and in the literature [11]. The robustness of the kernel method has been demonstrated to some extent by Baikejiang et al [23], but incorrect anatomical guidance still leads to evident visual blurring. The kernel method can be susceptible to the following forms of anatomical misguidance at any given region in the image: 1) a PET feature that is not present in the MR, 2) an MR feature that is not present in the PET, 3) features in both the PET and MR which do not match. These three cases are now considered in turn.
A PET feature that is not present in the MR leads to suppression of the PET unique feature by the kernel method. Choosing parameters that result in smaller basis functions will reduce the suppression of such features, but at the expense of increased noise. Similarly, for penalised methods (e.g. the Bowsher prior), the over-smoothing of PET unique features can be reduced through varying the hyper parameter value. In both cases, reducing the influence of the anatomical image reduces the noise suppression properties.
A MR feature that is not present in the PET, will have only a limited impact on the KEM reconstruction method. MR features which are not present in the PET data will lead to inappropriate PET basis functions, the coefficients for these basis functions are estimated from the PET data only. Therefore, provided such basis functions are located within homogeneous regions of the PET image, the additional MR features will not have an adverse impact on the reconstructed PET image. Similarly, for penalised methods, mismatching MR features will just cause constrained regions of smoothing in homogeneous PET regions.
Finally, for the case of PET and MR features that do not match, the PET data will be blurred by the MR-shaped basis functions. This issue can again be mitigated through the selection of parameters that produce small, compact basis functions, which can represent unique PET features.
To extend the kernel method to other applications, such as oncology and non-FDG tracers would require these issues to be addressed.
IX. Conclusion
To summarise, the kernel method shows clear improvement in the retention of detail and reduction of noise for reduced dose reconstructions in comparison to MLEM. The kernel reconstruction of 10% of the data had comparable whole brain NRMSE to the MLEM reconstruction of 100% of the data (for simulated data, at 100 iterations). For regional metrics, the kernel method at reduced count levels (corresponding to reduced dose levels) attained a reduced coefficient of variation and more accurate mean values compared to MLEM. For real data, the KEM mean value of the right caudate for the different dose level reconstructed images (5%-100%) are within 5.7% of one another. Although reconstruction of reduced dose data with the kernel method leads to reduced noise and close quantitative correspondence to the full dose reconstruction, further assessment on clinical data is required to determine the level of dose reduction that can be routinely achieved whilst maintaining the diagnostic utility of the scan.
Acknowledgments
This work was funded by the King’s College London & Imperial College London EPSRC Centre for Doctoral Training in Medical Imaging (EP/L015226/1), and supported by the Wellcome EPSRC Centre for Medical Engineering at King’s College London (WT 203148/Z/16/Z) and by the EPSRC grant number EP/M020142/1. According to the EPSRC’s policy framework on research data, figures and data supporting this study are openly available at 10.5281/zenodo.1041423
References
- [1].Shepp LA, Vardi Y. Maximum Likelihood Reconstruction for Emission Tomography. IEEE Trans Med Imaging. 1982 doi: 10.1109/TMI.1982.4307558. [DOI] [PubMed] [Google Scholar]
- [2].Mumcuoglu EU, Leahy RM, Cherry SR. Bayesian reconstruction of PET images: methodology and performance analysis. Phys Med Biol Phys Med Biol. 1996;41(41):1777–1807. doi: 10.1088/0031-9155/41/9/015. [DOI] [PubMed] [Google Scholar]
- [3].Green PJ. Bayesian Reconstructions From Emission Tomography Data Using a Modified EM Algorithm. IEEE Trans Med IMAGING. 1990 Mar;9(1) doi: 10.1109/42.52985. [DOI] [PubMed] [Google Scholar]
- [4].Green PJ. On Use of the EM for Penalized Likelihood Estimation On Use of the EM Algorithm for Penalized Likelihood Estimation. J R Stat Soc. 1990;52(3):443–452. [Google Scholar]
- [5].Hebert T, Leahy R. A Generalized EM Algorithm for 3-D Bayesian Reconstruction from Poisson Data Using Gibbs Priors. IEEE Trans Med Imaging. 1989 doi: 10.1109/42.24868. [DOI] [PubMed] [Google Scholar]
- [6].Tang J, Tsui BMW, Rahmim A. Bayesian PET image reconstruction incorporating anato-functional joint entropy. 2008 5th IEEE International Symposium on Biomedical Imaging: From Nano to Macro; 2008. pp. 1043–1046. [Google Scholar]
- [7].Nuyts J. The use of mutual information and joint entropy for anatomical priors in emission tomography. 2007 IEEE Nuclear Science Symposium Conference Record; 2007. pp. 4149–4154. [Google Scholar]
- [8].Ehrhardt MJ, Thielemans K, Pizarro L, Atkinson D, Ourselin S, Hutton BF, Arridge SR. Joint reconstruction of PET-MRI by exploiting structural similarity. Inverse Probl. 2014;31(1):15001. [Google Scholar]
- [9].Vunckx K, Atre A, Baete K, Reilhac A, Deroose CM, Van Laere K, Nuyts J. Evaluation of three MRI-based anatomical priors for quantitative PET brain imaging. IEEE Trans Med Imaging. 2012 doi: 10.1109/TMI.2011.2173766. [DOI] [PubMed] [Google Scholar]
- [10].Bai B, Li Q, Leahy RM. Magnetic resonance-guided positron emission tomography image reconstruction. Semin Nucl Med. 2013 doi: 10.1053/j.semnuclmed.2012.08.006. [DOI] [PMC free article] [PubMed] [Google Scholar]
- [11].Hutchcroft W, Wang G, Chen KT, Catana C, Qi J. Anatomically-aided PET reconstruction using the kernel method. Phys Med Biol. 2016;61(18):6668–6683. doi: 10.1088/0031-9155/61/18/6668. [DOI] [PMC free article] [PubMed] [Google Scholar]
- [12].Delso G, Furst S, Jakoby B, Ladebeck R, Ganter C, Nekolla SG, Schwaiger M, Ziegler SI. Performance Measurements of the Siemens mMR Integrated Whole-Body PET/MR Scanner. J Nucl Med. 2011;52(12):1914–1922. doi: 10.2967/jnumed.111.092726. [DOI] [PubMed] [Google Scholar]
- [13].Bowsher JE, Yuan Hong, Hedlund LW, Turkington TG, Akabani G, Badea A, Kurylo WC, Wheeler CT, Cofer GP, Dewhirst MW, Johnson GA. Utilizing MRI Information to Estimate F18-FDG Distributions in Rat Flank Tumors. IEEE Symp Conf Rec Nucl Sci 2004. 2004;4(C):2488–2492. [Google Scholar]
- [14].Elad M, Milanfar P, Rubinstein R. Analysis versus synthesis in signal priors. European Signal Processing Conference; 2006. [Google Scholar]
- [15].Wang G, Qi J. PET image reconstruction using kernel method. IEEE Trans Med Imaging. 2015;34(1):61–71. doi: 10.1109/TMI.2014.2343916. [DOI] [PMC free article] [PubMed] [Google Scholar]
- [16].Novosad P, Reader AJ. MR-guided dynamic PET reconstruction with the kernel method and spectral temporal basis functions. Phys Med Biol. 2016 doi: 10.1088/0031-9155/61/12/4624. [DOI] [PubMed] [Google Scholar]
- [17].Jiao J, Markiewicz P, Burgos N, Atkinson D, Hutton BF, Arridge SR, Ourselin S. Detail-Preserving PET Reconstruction with Sparse Image Representation and Anatomical Priors. Inf Process Med Imaging. 2015 doi: 10.1007/978-3-319-19992-4_42. [DOI] [PubMed] [Google Scholar]
- [18].Tang J, Wang Y, Yao R, Ying L. Sparsity-Based Pet Image Reconstruction Using Mri Learned Dictionaries. 2014;1:1087–1090. [Google Scholar]
- [19].Chen S, Liu H, Shi P, Chen Y. Sparse representation and dictionary learning penalized image reconstruction for positron emission tomography. Phys Med Biol. 2015;60 doi: 10.1088/0031-9155/60/2/807. [DOI] [PubMed] [Google Scholar]
- [20].Tahaei MS, Reader AJ. Patch-based image reconstruction for PET using prior-image derived dictionaries. Phys Med Biol. 2016;61(18):6833–6855. doi: 10.1088/0031-9155/61/18/6833. [DOI] [PubMed] [Google Scholar]
- [21].Spencer B, Qi J, Badawi RD, Wang G. Dynamic PET Image reconstruction for parametric imaging using the HYPR kernel method. 2017;10132:101324W. [Google Scholar]
- [22].Zhao Y, Baikejiang R, Li C. Application of kernel method in fluorescence molecular tomography. 2017:100570P. doi: 10.1117/1.JBO.22.5.055001. [DOI] [PMC free article] [PubMed] [Google Scholar]
- [23].Baikejiang R, Zhao Y, Fite BZ, Ferrara KW, Li C. Anatomical image-guided fluorescence molecular tomography reconstruction using kernel method. J Biomed Opt. 2017;22(5):55001. doi: 10.1117/1.JBO.22.5.055001. [DOI] [PMC free article] [PubMed] [Google Scholar]
- [24].Baikejiang R, Zhang W, Li C. Gaussian kernel based anatomically-aided diffuse optical tomography reconstruction. 2017;10059:1005912. [Google Scholar]
- [25].Seith F, Schmidt H, Kunz J, Kuestner T, Gatidis S, Nikolaou K, la Fougère C, Schwenzer NF. Simulation of tracer dose reduction in 18 F-FDG-Positron emission tomography / magnetic resonance imaging (PET/MRI): Effects on oncologic reading, image quality and artifacts. 2017 doi: 10.2967/jnumed.116.184440. [DOI] [PubMed] [Google Scholar]
- [26].Herholz K, Evans R, Anton-Rodriguez J, Hinz R, Matthews JC. The effect of 18F-florbetapir dose reduction on region-based classification of cortical amyloid deposition. Eur J Nucl Med Mol Imaging. 2014;41(11):2144–2149. doi: 10.1007/s00259-014-2842-3. [DOI] [PubMed] [Google Scholar]
- [27].Schaefferkoetter JD, Yan J, Soderlund TA, Townsend DW, Conti M, Tam JKC, Soo R, Tham I. Quantitative Accuracy and Lesion Detectability of Low-Dose FDG-PET for Lung Cancer Screening. J Nucl Med. 2016:1–26. doi: 10.2967/jnumed.116.177592. [DOI] [PubMed] [Google Scholar]
- [28].Loeb R, Navab N, Ziegler SI. Direct Parametric Reconstruction Using Anatomical Regularization for Simultaneous PET/MRI Data. IEEE Trans Med Imaging. 2015 Nov;34(11):2233–2247. doi: 10.1109/TMI.2015.2427777. [DOI] [PubMed] [Google Scholar]
- [29].Mehranian A, Belzunce MA, Niccolini F, Politis M, Prieto C, Turkheimer F, Hammers A, Reader AJ. PET image reconstruction using multi-parametric anato-functional priors. Phys Med Biol. 2017 Jul;62(15):5975–6007. doi: 10.1088/1361-6560/aa7670. [DOI] [PubMed] [Google Scholar]
- [30].Cocosco C, Kollokian V, Kwan RK, Pike GB, Evans AC. BrainWeb?: Online Interface to a 3D MRI Simulated Brain Database. 3-rd Int Conf Funct Mapp Hum Brain. 1997;5(4):S425. [Google Scholar]
- [31].Karlberg AM, Sæther O, Eikenes L, Goa PE. Quantitative comparison of PET performance-Siemens Biograph mCT and mMR. EJNMMI Phys. 2016 Dec;3(1):5. doi: 10.1186/s40658-016-0142-7. [DOI] [PMC free article] [PubMed] [Google Scholar]


