Abstract
Background
Previous studies have examined and documented fluctuations in urine metabolites in response to disease processes and drug toxicity affecting glomerular filtration, tubule cell metabolism, reabsorption, oxidative stress, purine degradation, active secretion and kidney amino acylase activity representative of diminished renal function. However, a high-throughput assay that incorporates metabolites that are surrogate markers for such changes into a kidney dysfunction panel has yet to be described.
Methods
A high-performance liquid chromatography-tandem mass spectrometry (HPLC-MS/MS) assay for the quantification of ten metabolites associated with the Krebs cycle, purine degradation, and oxidative stress in human urine was developed and validated. Normal values were assessed in healthy adult (n=120) and pediatric (n=36) individuals. In addition, 9 pediatric renal transplant recipients patients were evaluated before and after initial dosing of the immunosuppressant tacrolimus in a proof-of-concept study.
Results
The assay met all predefined acceptance criteria. The lower limit of quantification ranged from 0.1 to 1000 µmol/l. Inter-day trueness and imprecisions ranged from 91.4–112.9% and 1.5–12.4%, respectively. The total assay run time was 5.5 minutes.
Concentrations of glucose, sorbitol, and trimethylamine oxide (TMAO) were elevated in pediatric renal transplant patients (n=9) prior to transplantation as well as before and immediately after initial dosing of tacrolimus. One month post-transplant urine metabolite patterns matched those of healthy children (n=36).
Conclusions
The LC-MS/MS assay will provide the basis for further large-scale clinical studies to explore these analytes as molecular markers for the patients with renal insufficiency.
Keywords: High-performance liquid chromatography- tandem mass spectrometry (HPLC-MS/MS), urine metabolomics, kidney dysfunction markers, normal values, tacrolimus nephrotoxicity
1. Introduction
Targeted metabolomics assays focusing on a particular subset of metabolites that are characteristic for specific pathways, have proven valuable in monitoring organ function [1]. A major advantage with respect to nephrology is the use of urine, an easily obtainable biofluid that is considered a proximal matrix for monitoring kidney function, which also directly and indirectly reflects systemic changes [2]. Unlike current clinical chemistry and biochemistry diagnostics which are usually based on a limited set of biomarkers that are closely correlated with one functional aspect of the organ in question, targeted metabolomics multiplexing assays allow for the investigation of several biochemical pathways simultaneously [2]. As a result, in recent years the interest in metabolomics in nephrology has expanded to include not only a wide range of disease processes from diabetic nephropathy to renal cell carcinoma but also the monitoring of kidney function following renal transplantation [2–4]. Although metabolomics has yet to receive as much interest as proteomics in the field of renal transplantation, several studies have been performed to assess the biochemical effects of immunosuppressant’s on the kidney using both targeted and non-targeted metabolomics strategies have shown promising potential [5–9]. Of particular interest is a study showing changes in the urine metabolite profiles of healthy individuals within the first 4 h after a single 5 mg/kg dose of cyclosporine (in its Neoral formulation, Novartis Pharma) [5]. This study demonstrated how rapidly the kidney responds following a dose of calcineurin inhibitor (CNI) and how urine metabolite patterns can reflect biochemical changes in the kidney [2,5]. These studies in combination with other previous studies [4,9] suggested that, in addition to established kidney function markers such as creatinine and uric acid, it will be of clinical value to also monitor changes in Krebs cycle intermediates (citrate, succinate, oxoglutarate, and lactate), markers of oxidative stress (trimethylamine oxide (TMAO), reabsorption (glucose, sorbitol), as well as active secretion and kidney amino acylase activity (hippurate) [3,5,9,10]. Although various combinations of these markers have previously been examined using nuclear magnetic resonance (NMR), gas chromatography-mass spectrometry (GC-MS), and liquid chromatography-mass spectrometry (LC-MS), to our knowledge no high-performance liquid chromatography- tandem mass spectrometry-based (LC-MS/MS) assay to simultaneously analyze all of these metabolites in human urine [3,5,9,11,12] has been published yet.
2. Materials and Methods
2.1 Matrix
As a result of high circulating concentrations of each metabolite, the assay was validated in 1/5000 diluted human urine amended with 40 nmol/l NaOH buffer. Urine samples were collected from healthy individuals. The use of de-identified samples for assay development, validation, calibration, and quality control purposes was considered “exempt” by the Colorado Multiple-Institutional Review Board (COMIRB). Urine samples from healthy individuals used to assess normal ranges were from Bioreclamation.
2.2 Chemicals and Reagents
Solvents and reagents (HPLC grade acetonitrile, water, sodium hydroxide, and formic acid 99%) used for sample preparation and as mobile phases were purchased from Fisher Scientific and used without further purification. Sodium citrate, sodium lactate, glucose, sorbitol, uric acid, creatinine, sodium succinate, TMAO, hippuric acid, and oxoglutarate reference materials were from Sigma Aldrich. The internal standards, d-4 succinate, d-5 hippurate, d-3 creatinine, d-6 glucose, and d-9 TMAO were purchased from Cambridge Isotopes.
2.3 Preparation of Stock and Working Solutions
Stock solutions for citrate, succinate, hippurate, TMAO, uric acid, glucose, sorbitol (10 mmol/l), and creatinine, as well as oxoglutarate and lactate (100 mmol/l) were prepared in 40 nmol/l NaOH buffer and stored at −80°C. Working solutions for quality control samples and standard curves were prepared by dilution of the stock solutions with 1/5000 diluted human urine.
2.4 Preparation of Internal Standard
The internal standard solution containing 200 µmol/l of each deuterated standard was prepared in 40 nmol/l sodium hydroxide (NaOH) aqueous buffer and was stored at −80°C. Each internal standard was used for quantification of the following compounds based on similar retention times: glucose, oxoglutarate, sorbitol (d-6 glucose), TMAO (d-9 TMAO), creatinine (d-3 creatinine), hippuric acid, lactic acid, uric acid (d-5 hippurate), citrate and succinate (d-4 succinate).
2.5 Preparation of Calibrators and Quality Control Samples
Calibrators and quality control samples were prepared by enriching 1/5000 diluted human urine in 40 nmol/l NaOH aqueous buffer with known concentrations of the reference materials. The calibration curve and quality control samples were generated by pipetting a series of 1:1 and 0.75:1.25 dilutions. Four hundred and eighty microliters of each calibrator and quality control sample was transferred into an HPLC vial and 20 µL of internal standard solution corresponding to a final concentration of 4 µmol/l internal standard was added. The samples were then vortexed using a Fisher Scientific pulsing vortex mixer for 30 sec and loaded into the autosampler for analysis.
2.6 Method of Extraction
Twenty-five microliters of human urine was diluted 1/40 in 40 nmol/l NaOH aqueous buffer. Four hundred and eighty µL of the diluted sample was then transferred to an HPLC vial and 20 µl of internal standard solution was added. Samples were then vortexed for thirty seconds and loaded into the autosampler for analysis.
2.7 HPLC-MS/MS Assay
All samples were analyzed on a Agilent 1100 series HPLC (Agilent Technologies) interfaced with a positive/negative electrospray API 4000 tandem mass spectrometer (Applied Biosystems). Analytes were separated using a 150×3 mm Luna HILIC, 3 µm column (Phenomenex) at an HPLC solvent flow rate of 450 µl/min. The solvents were 0.1% aqueous formic acid (mobile phase A) and acetonitrile (mobile phase B). The gradient was: 0–1 min 5% acetonitrile, 1.0–3.5 min 5% acetonitrile to 15% acetonitrile, 3.5–4.5 100% acetonitrile. The column was then re-equilibrated to starting conditions (5% acetonitrile) between 4.6 and 5.5 min. The mass spectrometry parameters were identical for both positive (0 – 1.79 min) and negative (1.8 – 5.5 min) periods and were as follows; ion source gas one: 40 psi, ion source gas two 45 psi, source temperature 500°C, collision gas 10 psi, curtain gas 20 psi, and ion source voltage +/− 4500V. Nitrogen of >99.99% purity was used as Collision Activated Dissociation (CAD) and curtain gas. Ion transitions and mass spectrometer settings for each compound can be seen in Table 1.
Table 1.
Ion transitions and mass spectrometer settings for each of the analytes.
| Period | Compound | Q1 Mass (Atomic mass unit) |
Q3 Mass (Atomic mass unit) |
Dwell time (milliseconds) |
Declustering Potential (Volts) |
Collision Energy (Volts) |
|---|---|---|---|---|---|---|
| Positive | TMAO | 76 | 58 | 50 | 50 | 15 |
| Positive | TMAO-d9 | 85 | 68 | 20 | 50 | 15 |
| Positive | Creatinine | 114 | 44 | 250 | 50 | 15 |
| Positive | Creatinine-d3 | 117 | 89.1 | 100 | 50 | 15 |
| Negative | Citrate | 191 | 111.1 | 50 | −55 | −17 |
| Negative | Succinate | 117 | 72.7 | 100 | −50 | −25 |
| Negative | Succinate-d4 | 120.9 | 76.6 | 75 | −50 | −15 |
| Negative | Glucose | 179.1 | 89.1 | 75 | −50 | −15 |
| Negative | Glucose-d6 | 185 | 92.1 | 75 | −50 | −20 |
| Negative | Sorbitol | 181 | 100.8 | 100 | −61 | −21 |
| Negative | Oxoglutarate | 144.6 | 100.6 | 100 | −60 | −12 |
| Negative | Uric Acid | 167 | 124 | 75 | −50 | −20 |
| Negative | Lactate | 89 | 43 | 250 | −35 | −18 |
| Negative | Hippurate | 178 | 134 | 75 | −50 | −15 |
| Negative | Hippurate-d5 | 183 | 139 | 75 | −50 | −15 |
2.8 Assay Validation
The assay was validated following the FDA Guidelines on Bioanalytical Method Validation [13] as considered fit-for-purpose. Calibration curves were constructed by plotting the peak area ratios of the corresponding analyte and internal standard against nominal analyte concentrations using the following 10 calibrators; 0.1, 0.25, 0.5, 1, 2.5, 5, 10, 25, 50, and 100 µmol/l for glucose, sorbitol, TMAO, citrate, succinate, uric acid, and hippurate and the following 10 calibrators 1, 2.5, 5, 10, 25, 50, 100, 250, 500, and 1000 µmol/l for creatinine, lactate, and oxoglutarate. To account for endogenous levels of each metabolite, the ratios of endogenous peak areas divided by the IS peak areas of non-enriched matrix (1/5000 diluted urine) were subtracted from area ratios of enriched samples (corrected analyte area/IS area ratio). For validation purposes 6 calibration curves were run on the first day followed by two calibration curves each day for the remaining nineteen days (n=38). Each calibration curve also contained a zero sample, containing endogenous levels of metabolites along with internal standard. Quality control samples were prepared at the following concentrations 0.15, 0.75, 3, 15, and 75 µmol/l (low/medium/high QC: 0.15, 3, 75 µmol/l) for glucose, sorbitol, TMAO, citrate, succinate, uric acid, and hippurate and 1.5, 7.5, 30, 150, and 750 µmol/l (low/medium/high QC: 1.5, 30, 750 µmol/l) for creatinine, lactate, and oxoglutarate. Six sets of quality control samples were prepared during the first day of validation and three additional sets for the remaining nineteen days (n=57). The lower limit of quantitation was the lowest calibrator that consistently showed ± 20% or less deviation from the nominal concentration as well as an imprecision of ≤ 20%. The upper limit of quantitation was set as the highest calibrator that consistently showed ± 15% or less deviation from the nominal concentration as well as an imprecision of ≤ 15%. The linearity of the method was investigated by calculation of the regression line using the least squares method. Trueness and imprecision were verified over twenty days. Intra-day and inter-day trueness and imprecision were calculated using the equations as set forth in applicable Clinical Laboratory Standards Institute guidelines [14].
2.9 Matrix Interferences, Ion Suppression/ Enhancement, Absolute Extraction Recoveries, Dilution Integrity and Exclusion of Carry-Over
To assess the potential effects of co-eluting matrix substances on ionization efficiency, human urine samples from 6 different healthy individuals were extracted and analyzed following the strategy as described by Matuszewski et al. [15]. In brief, extracted human urine samples were enriched with appropriate amounts of the analytes to result in all previously described quality control concentrations for each metabolite. Signal areas were compared to those of neat solutions containing corresponding amounts of the analytes. In addition, using a “post-column infusion” approach was used to assess potential matrix effects by infusing d3-creatinine, d9-TMAO, d6-glucose, d4-succinate and d5-hippurate (200µM dissolved in 40 nmol/l NaOH aqueous buffer) post-column via a tee connector at a rate of 50 µL/min using a syringe pump (Harvard Scientific, Holliston, MA). The extent of ion suppression was established by monitoring the signal intensities of the ion currents for all analytes in MRM mode at the retention times of analyte and IS after injection of extracted non-enriched and diluted urine samples collected from 6 different individuals.
To estimate absolute extraction recoveries, synthetic urine was prepared using a modified version of a protocol previously described by Kark et al. [16]. In brief, bovine serum albumin, potassium chloride, sodium chloride, sodium phosphate and urea were combined in distilled water (creatinine although present in the original protocol, was not added in order to maintain a matrix without analytes of interest). The synthetic urine solution was then enriched with previously described quality control concentrations (low, medium and high) for each analyte (n = 3) and compared to a freshly extracted set of quality control samples. Recovery [%] was calculated as: (MS/MS signal of metabolite in quality control samples)/ (MS/MS signal of corresponding amount of metabolite in artificial urine) · 100.
Dilution integrity was established by preparing urine samples containing 500 µmol/l citrate, succinate, hippurate, TMAO, uric acid, glucose, sorbitol and 5 mmol/l creatinine, lactate, and oxoglutarate. These samples were then diluted 1:25, 1:50, and 1:100 with 40 nmol/l NaOH (n=3). Potential carry-over was assessed by alternately analyzing calibrators spiked with concentrations of each analyte at the upper limit of quantitation (n= 6) followed by blank methanol samples.
2.10 Stability Testing
Bench top stabilities of each compound were tested using 1/5000 diluted urine and stock solutions (24 h). For diluted urine stability, quality control samples were prepared (n=12/concentration) at all previously described quality control concentrations. Six of the samples were measured immediately for all ten compounds (baseline) using a newly prepared calibration curve while the other 6 remained on the bench top over the test period. Then the remaining 6 samples were analyzed and accuracies were compared to the baseline samples. To test stock solution bench top stability, stock solutions for citrate, succinate, hippurate, TMAO, uric acid, glucose, sorbitol (1 mmol/l) and creatinine, oxoglutarate as well as lactate (10 mmol/l) were prepared freshly. Six sets of QC samples were prepared immediately from the newly made stocks at concentrations matching those described earlier. These samples were then analyzed using a newly made calibration curve while the original stocks were left on the bench for a period of 24 h. After the corresponding time had passed, the stocks were used to prepare another corresponding 6 sets of QC samples. These samples were then analyzed and compared to baseline.
Autosampler stability was determined by leaving extracted samples at all previously described quality control concentrations (n=3/concentration) for each compound in the auto sampler for 24 and 48 h at 4°C. Samples were re-analyzed using a newly made calibration curve.
Freeze-thaw stability was determined using QC samples with all previously described concentrations for each compound; n=3/ concentration. Samples were exposed to1, 2, and 3 freeze-thaw cycles using liquid nitrogen. These samples were then compared to freshly prepared QC samples at the corresponding concentrations.
To determine the long-term effects of sample storage at varying conditions, QC samples were prepared at all previously described concentrations. Samples were stored at 4°C for 24 h and 1 week, as well as −20°C and −80°C for 1 and 6 months (n=3). These samples were then analyzed with freshly prepared calibration curves.
Additionally, stability in undiluted urine was established by storing ten lots of urine obtained from healthy individuals at −80°C for 1 month. These samples were then diluted, extracted, analyzed and compared to baseline values.
2.11 Sample Analysis of Healthy Individuals
In order to assess the normal concentration ranges in healthy individuals, urine samples from 120 adults and 36 children were obtained from Bioreclamation and analyzed. For normalization purposes, urine osmolality was determined using an Advanced Instruments 3200 Micro-Osmometer (Norwood, MA). Demographics of these healthy individulals are listed in Table 2.
Table 2.
Patient demographics (age, gender and ethnicity) for healthy adults, healthy children and pediatric renal transplant recipients included in this study.
| Period | Compound | Q1 Mass (Atomic mass unit) |
Q3 Mass (Atomic mass unit) |
Dwell time (milliseconds) |
Declustering Potential (Volts) |
Collision Energy (Volts) |
|---|---|---|---|---|---|---|
| Positive | TMAO-d9 | 85 | 68 | 20 | 50 | 15 |
| Positive | Creatinine | 114 | 44 | 250 | 50 | 15 |
| Positive | Creatinine-d3 | 117 | 89.1 | 100 | 50 | 15 |
| Negative | Citrate | 191 | 111.1 | 50 | −55 | −17 |
| Negative | Succinate | 117 | 72.7 | 100 | −50 | −25 |
| Negative | Succinate-d4 | 120.9 | 76.6 | 75 | −50 | −15 |
| Negative | Glucose | 179.1 | 89.1 | 75 | −50 | −15 |
| Negative | Glucose-d6 | 185 | 92.1 | 75 | −50 | −20 |
| Negative | Sorbitol | 181 | 100.8 | 100 | −61 | −21 |
| Negative | Oxoglutarate | 144.6 | 100.6 | 100 | −60 | −12 |
| Negative | Uric Acid | 167 | 124 | 75 | −50 | −20 |
| Negative | Lactate | 89 | 43 | 250 | −35 | −18 |
| Negative | Hippurate | 178 | 134 | 75 | −50 | −15 |
| Negative | Hippurate-d5 | 183 | 139 | 75 | −50 | −15 |
2.12 Clinical Sample Analysis
Patient samples were obtained from an ongoing longitudinal, one-arm, single-centre clinical trial currently including 9 de-novo single kidney transplant patients. The study protocol had been approved by the Colorado Multi-institutional Review Board (COMIRB, Aurora, CO). After informed consent/ assent, 10 mL urine was collected from each patient prior to transplantation (baseline), immediately following the transplant but before initial dosing of Tacrolimus (pre-dose) as well as 4, 8, 12 h, and 1, 3, 7, and 14 days, and 1 and 3 months after initial dosing. All samples were collected in the Children's Clinical Research Organization Clinical Trials Unit (Children’s Hospital of Colorado). The study was conducted in accordance with the rules of good clinical practice and in compliance with all other applicable national and international guidances and regulations. Inclusion criteria were: age 1–18 y, renal transplant and planned tacrolimus-based immunosuppression, informed consent from either parent/guardian, informed assent from children ages 7–17 y. Exclusion criteria were treatment with a calcineurin inhibitor within 12 weeks before transplantation and previous transplant(s). A total of 81 samples collected from 9 patients were analysed and results were compared to those of the aforementioned 36 healthy children. Patient demographics are listed in Table 2.
2.13 Statistical Analysis
One-way analysis of variance (ANOVA) was used to test for differences among patients. Statistical significance was set at p ≤ 0.05. If not mentioned otherwise, results are presented as mean ± standard error. Statistical analyses were performed using SPSS, ver.21.0 (IBM/SPSS)
3. Results
3.1 HPLC-MS/MS Assay
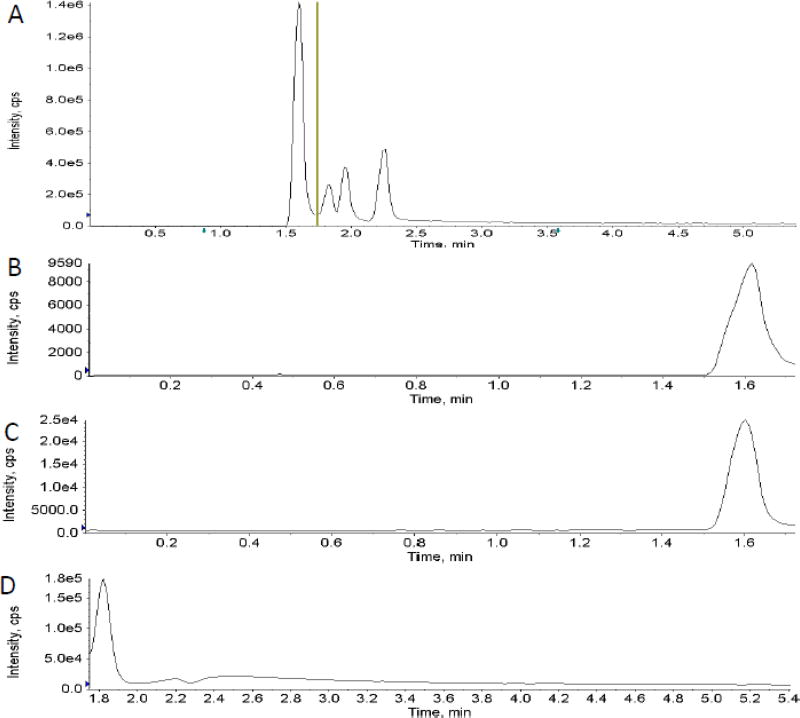
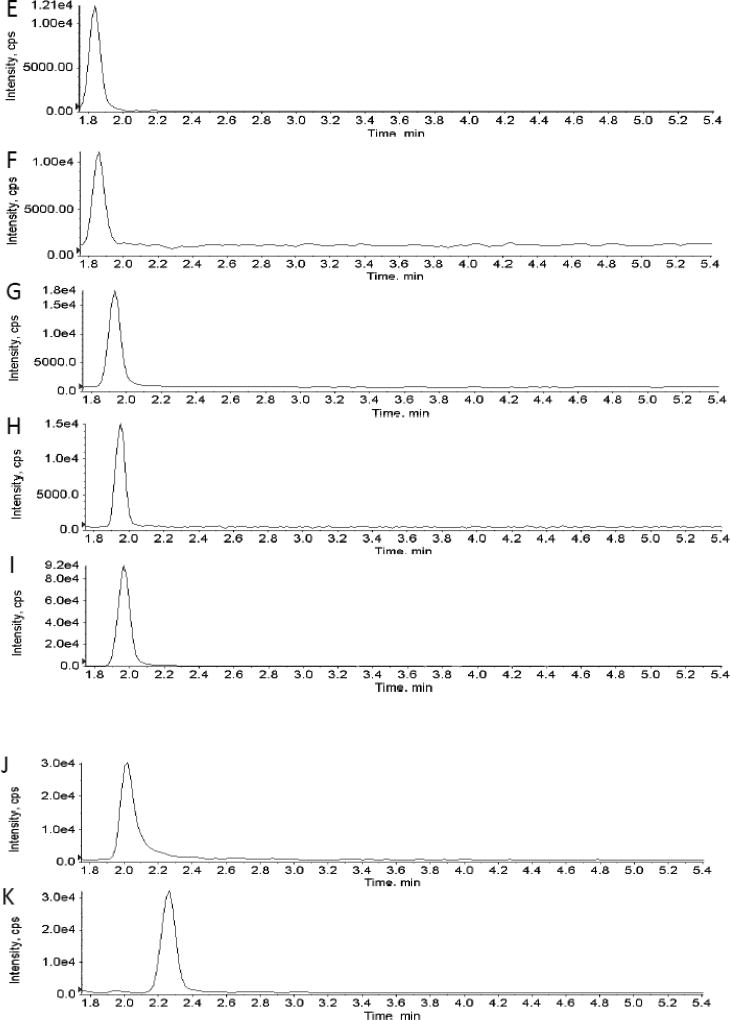
Testing of different fitting methods for the calibrators indicated that quadratic curve fit with 1/x weighting gave the best results for all ten analytes. The lowest and highest amount of each analyte in a sample that could be quantitatively determined with suitable precision and accuracy was defined as the lower limit of quantification (LLOQ) and the upper limit of quantification (ULOQ). The correlation coefficients (r) for the calibration curves were r2 ≥ 0.99 with a concentration range of 0.1 (LLOQ) – 100 µmol/l (ULOQ) for glucose, sorbitol, TMAO, succinate, and hippurate, 1 (LLOQ) – 100 µmol/l (ULOQ) for uric acid and citrate, as well as 1 (LLOQ) - 1000 µmol/l (ULOQ) for creatinine, oxoglutarate, and lactate (Table 3). Mean trueness and imprecision for each analyte was within predefined acceptance criteria of 85% – 115% of the nominal concentration and 15 % (coefficient of variance), respectively, as seen in Table 3. A representative total ion chromatogram (TIC) showing both positive and negative period segmented analysis as well as extracted ion chromatograms for each analyte is shown in Fig. 1 A–K.
Table 3.
Intra and inter-day trueness and imprecision, LLOQ, ULOQ and limits of detection (LOD) for each analyte.
| Analyte | Lower limit of quantificatio n (µmol/l) |
Upper limit of quantificatio n (µmol/l) |
Intra-day Trueness ± Coefficien t of variance (%) |
Inter-day Trueness ± Coefficien t of variance (%) |
||||
|---|---|---|---|---|---|---|---|---|
| Low QC | Mid QC |
High QC |
Low QC | Mid QC |
High QC |
|||
| 0.15,1.5 µmol/l |
3,30 µmol/ l |
75,75 0 µmol/ l |
0.15,1.5 µmol/l |
3,30 µmol/ l |
75,75 0 µmol/ l |
|||
| TMAO | 0.1 | 100 | 113.2 ± 3.4 | 105.4 ± 1.9 | 103.5 ± 1.8 | 102.6 ± 6.9 | 99.4 ± 5.2 | 100.8 ± 6.5 |
| Creatinine | 1 | 1000 | 106.7 ± 5.4 | 102.5 ± 1.4 | 107.3 ± 3.0 | 97.8 ± 11.4 | 99.4 ± 5.4 | 99.9 ± 5.7 |
| Citrate | 1 | 100 | 111.2 ± 2.3 | 103.9 ± 4.4 | 106.3 ± 4.0 | 100.2 ± 9.1 | 99.6 ± 7.0 | 102.1 ± 5.8 |
| Succinate | 0.1 | 100 | 108.4 ± 3.1 | 100.9 ± 3.4 | 109.2 ± 4.1 | 100.9 ± 9.4 | 101.4 ± 6.1 | 97.7 ± 4.9 |
| Glucose | 1 | 1000 | 109.0 ± 5.2 | 108.6 ± 5.1 | 102.4 ± 3.7 | 100.5 ± 6.4 | 100.2 ± 6.9 | 99.3 ± 8.2 |
| Sorbitol | 0.1 | 100 | 107.3 ± 6.2 | 107.7 ± 3.6 | 108.2 ± 4.7 | 98.6 ± 9.4 | 99.7 ± 9.8 | 99.6 ± 7.8 |
| Oxoglutarate | 1 | 1000 | 108.6 ± 6.3 | 105.5 ± 2.6 | 104.2 ± 6.7 | 106.9 ± 6.6 | 103.2 ± 7.6 | 96.7 ± 8.7 |
| Uric Acid | 1 | 100 | 106.8 ± 5.6 | 101.7 ± 6.9 | 112.2 ± 3.7 | 101.6 ± 8.5 | 99.1 ± 7.7 | 96.4 ± 7.3 |
| Lactate | 1 | 1000 | 109.0 ± 4.7 | 107.6 ± 3.4 | 103.6 ± 7.6 | 100.7 ± 8.0 | 102.1 ± 6.1 | 100.0 ± 5.8 |
| Hippurate | 0.1 | 100 | 104.9 ± 6.5 | 100.0 ± 7.4 | 107.4 ± 2.6 | 100.6 ± 7.5 | 98.8 ± 7.3 | 100.8 ± 7.1 |
Fig. 1.
Representative total ion chromatogram showing two period segmented analysis (A) as well as extracted ion chromatograms for each analyte (B–K).
No ion suppression/enhancement interfered with the detection and quantification of any metabolite as was determined by analysis of six separate lots of urine enriched with each analyte in addition to a post-column infusion experiment (Supplemental Data Table 1). None of the extracted samples were affected by 48-h storage in the autosampler at 4°C. In addition, three freeze-thaw cycles did not have an effect, with all analytes measuring within ±15% of the nominal concentration as shown in Supplemental Data Table 2.
The concentrations of all ten analytes in three dilution samples (1/25, 1/50, and 1/100) were found to be within predefined acceptance criteria (85–115%) with mean trueness ranging from 92.3 to 113.4% for all analytes.
Short-term storage of stock solutions and quality control samples under the conditions tested through 24 h did not have an effect on the integrity of the data. Long-term storage of quality control samples showed negligible degradation after one week of storage at 4°C as well as 6 months of storage at, −20°C and −80°C. (Table 4)
Table 4.
Mean trueness and imprecision for long-term storage of quality control samples at 4°C through 1 week as well as at −20°C and −80°C through 6 months.
| Analyte | Lower limit of quantificatio n (µmol/l) |
Upper limit of quantificatio n (µmol/l) |
Intra-day Trueness ± Coefficien t of variance (%) |
Inter-day Trueness ± Coefficien t of variance (%) |
||||
|---|---|---|---|---|---|---|---|---|
| Low QC | Mid QC |
High QC |
Low QC | Mid QC |
High QC |
|||
| 0.15,1.5 µmol/l |
3,30 µmol/ l |
75,75 0 µmol/ l |
0.15,1.5 µmol/l |
3,30 µmol/ l |
75,75 0 µmol/ l |
|||
| TMAO | 0.1 | 100 | 113.2 ± 3.4 | 105.4 ± 1.9 | 103.5 ± 1.8 | 102.6 6.9 ± | 99.4 ± 5.2 | 100.8 ± 6.5 |
| Creatinine | 1 | 1000 | 106.7 ± 5.4 | 102.5 ± 1.4 | 107.3 ± 3.0 | 97.8 ± 11.4 | 99.4 ± 5.4 | 99.9 ± 5.7 |
| Citrate | 1 | 100 | 111.2 ± 2.3 | 103.9 ± 4.4 | 106.3 ± 4.0 | 100.2 ± 9.1 | 99.6 ± 7.0 | 102.1 ± 5.8 |
| Succinate | 0.1 | 100 | 108.4 ± 3.1 | 100.9 ± 3.4 | 109.2 ± 4.1 | 100.9 ± 9.4 | 101.4 ± 6.1 | 97.7 ± 4.9 |
| Glucose | 1 | 1000 | 109.0 ± 5.2 | 108.6 ± 5.1 | 102.4 ± 3.7 | 100.5 ± 6.4 | 100.2 ± 6.9 | 99.3 ± 8.2 |
| Sorbitol | 0.1 | 100 | 107.3 ± 6.2 | 107.7 ± 3.6 | 108.2 ± 4.7 | 98.6 ± 9.4 | 99.7 ± 9.8 | 99.6 ± 7.8 |
| Oxoglutarate | 1 | 1000 | 108.6 ± 6.3 | 105.5 ± 2.6 | 104.2 ± 6.7 | 106.9 ± 6.6 | 103.2 ± 7.6 | 96.7 ± 8.7 |
| Uric Acid | 1 | 100 | 106.8 ± 5.6 | 101.7 ± 6.9 | 112.2 ± 3.7 | 101.6 ± 8.5 | 99.1 ± 7.7 | 96.4 ± 7.3 |
| Lactate | 1 | 1000 | 109.0 ± 4.7 | 107.6 ± 3.4 | 103.6 ± 7.6 | 100.7 ± 8.0 | 102.1 ± 6.1 | 100.0 ± 5.8 |
| Hippurate | 0.1 | 100 | 104.9 ± 6.5 | 100.0 ± 7.4 | 107.4 ± 2.6 | 100.6 ± 7.5 | 98.8 ± 7.3 | 100.8 ± 7.1 |
Analysis of urine from ten healthy individuals stored at −80°C for one month showed negligible differences with all analytes measuring within ±15% of the baseline concentrations.
3.2 Assessment of Normal Ranges in Healthy Individuals
The results of the analysis of 120 urine samples from healthy adults are shown in Supplemental Data Table 3 with measurements normalized to urine osmolality and reported as the ratio (µmol/l / mOsm). The data analysis showed that all analytes tested were not normally distributed and therefore ranges were determined non-parametrically with 95% confidence intervals as set forth in Clinical Laboratory Standards Institute guideline C28-A3 [17]. Normal ranges found in the 120 urine samples tested were as follows, citrate (all µmol/l / mOsm): 0.338 (95% CI=0.096–0.703) to 5.667 (95% CI=4.524–16.829), creatinine: 7.700 (95% CI=4.569– 0.892) to 11.122 (95% CI=39.651–96.634) glucose: 0.683 (95% CI=0.336–0.892) to 71.642 (95% CI=11.559–194.618), hippurate: 0.329 (95% CI=0.242–0.435) to 11.178 (95% CI=7.018– 24.289), lactate: 0.011 (95% CI=0.005–0.015) to 0.678 (95% CI=0.410–0.947), oxoglutarate 0.024 (95% CI=0.016–0.034) to 1.103 (95% CI=0.609–5.025), sorbitol 0.188 (95% CI=0.083– 0.294) to 5.498 (95% CI=2.497–5.700), succinate 0.051 (95% CI=0.035–0.065) to 1.544 (95% CI=0.783–5.607), TMAO 0.014 (95% CI=0.008–0.147) to 3.341 (95% CI=2.103–4.051) and uric acid 0.713 (95% CI=0.361–0.972) to 5.669 (95% CI=4.604–7.619) µmol/l / mOsm.
Data analysis revealed a near Gaussian distribution of reference values for healthy children for citrate and creatinine. Using a parametric method, the reference intervals for citrate and creatinine were determined to be from 0.272 (95% CI=0.090–0.634) to 3.275 (95% CI=2.912–3.637) (µmol/l / mOsm) and from 3.368 (95% CI=1.727–5.009) to 16.970 (95% CI=15.329–18.611) µmol/l / mOsm, respectively. For the remaining eight analytes, Box-Cox data transformation was required for Gaussian distribution. Using a transformed parametric method, the reference intervals for glucose, hippurate, lactate, oxoglutarate, sorbitol, succinate, TMAO and uric acid were found to be from 0.679 (95% CI=0.505–0.913) to 7.881 (95% CI=5.863–10.952), 0.489 (95% CI=0.366–0.653) to 5.378 (95% CI=4.027–7.182), 0.048 (95% CI=0.042–0.055) to 0.159 (95% CI=0.138–0.184), 0.038 (95% CI=0.029–0.051) to 0.413 (95% CI=0.310–0.550), 0.247 (95% CI=0.187–0.327) to 2.508 (95% CI=1.896–3.316), 0.114 (95% CI=0.092–0.141) to 0.679 (95% CI=0.548–0.843), 0.128 (95% CI=0.094–0.174) to 1.622 (95% CI=1.194–2.204) and 0.285 (95% CI=0.096–0.575) to 5.732 (95% CI=4.708–6.857) µmol/l / mOsm, respectively (Supplemental Data Table 3).
3.3 Clinical Sample Analysis
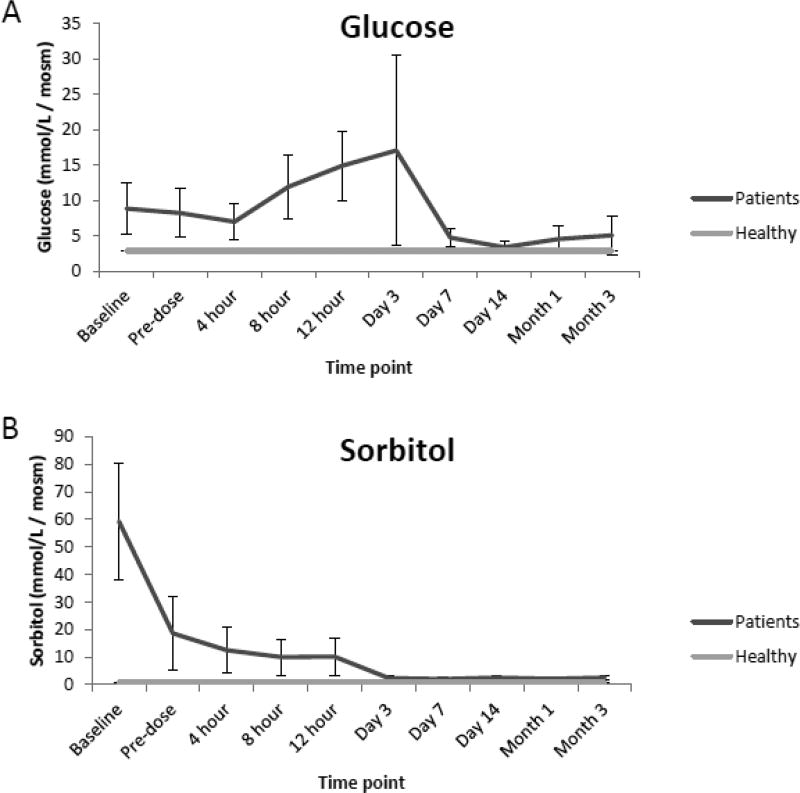
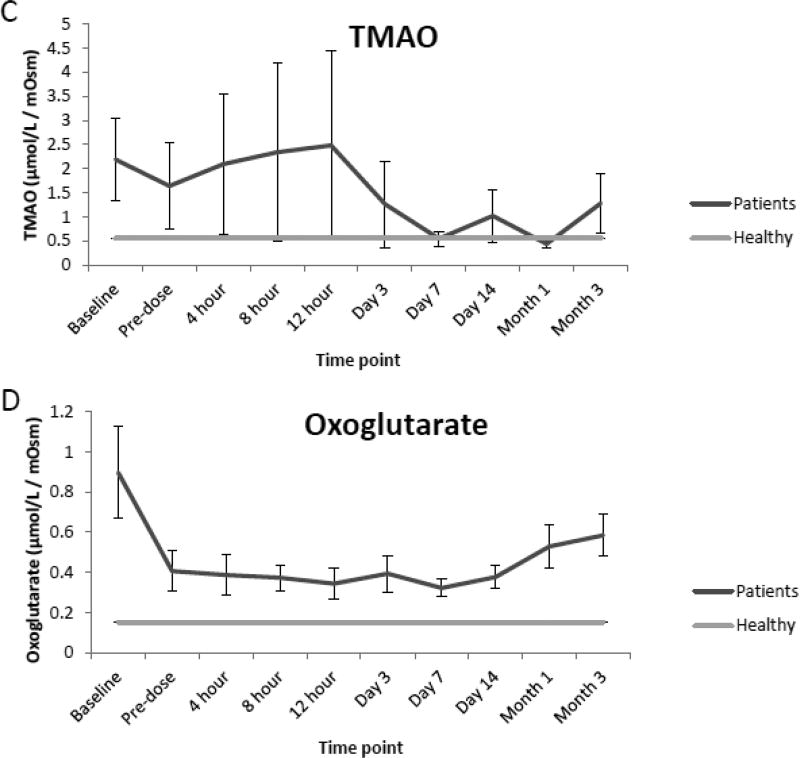
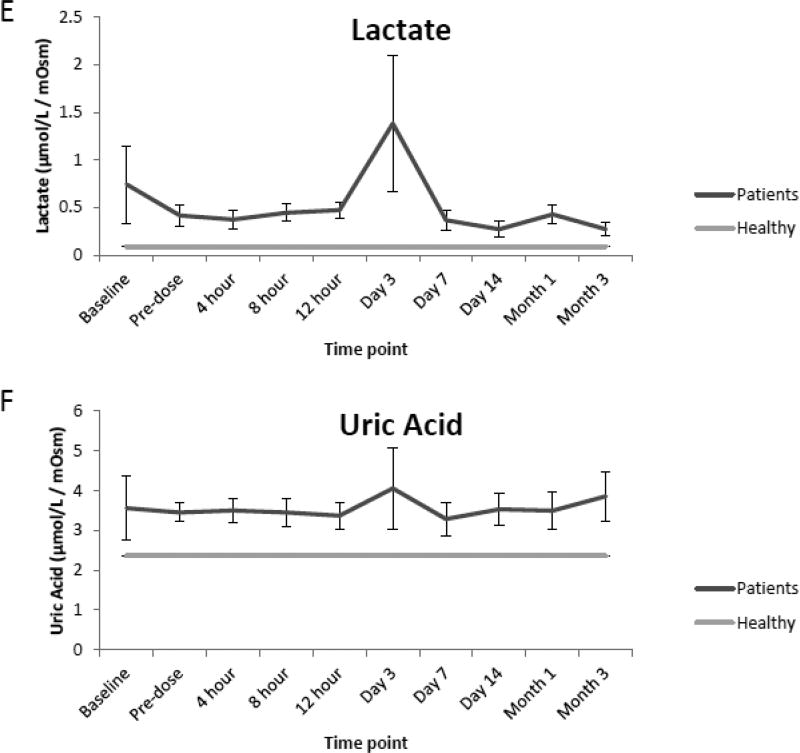
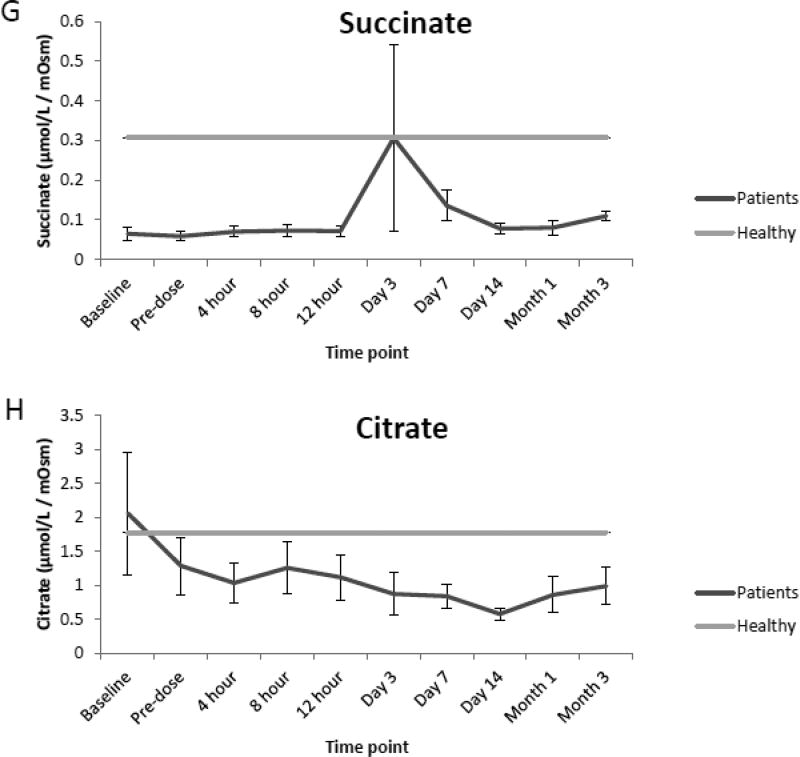
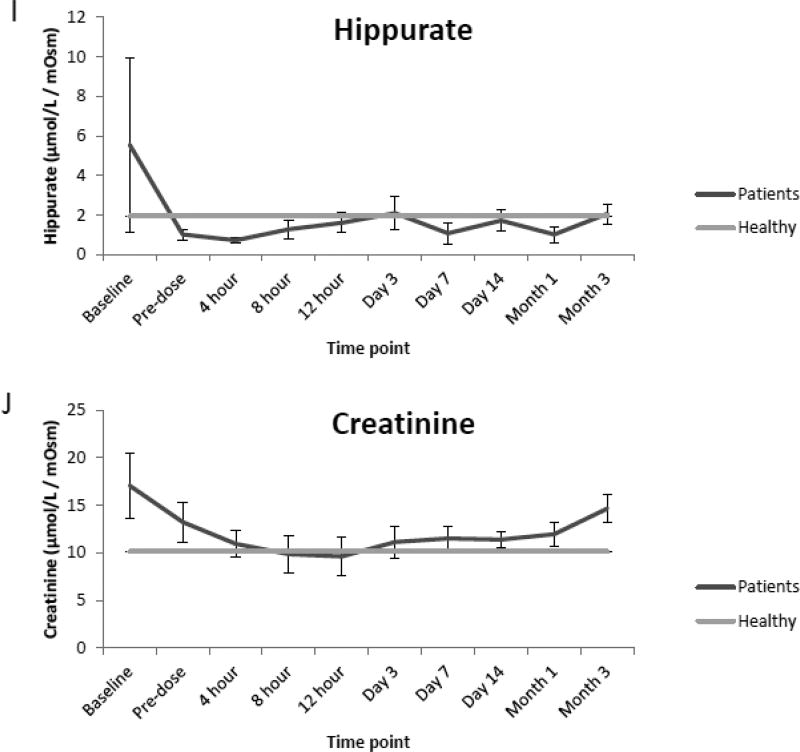
Compared to the normal ranges found in healthy children, analysis of urine from renal transplant recipients revealed elevated mean concentrations of glucose, sorbitol and TMAO preceding renal transplantation (baseline) as well as prior to (pre-dose) and immediately following initial dosing of tacrolimus (4,8,12 h, and day 1 and 3). However, as seen in Fig. 2 A, B, and C values for each analyte began to decrease over time (day 7, 14, month 1 and 3) and were comparable to normal ranges at the end of the evaluation period. Additionally, while mean concentrations of oxoglutarate, lactate and uric acid were elevated during the course of immunosuppressant dosing when compared to healthy children, mean concentrations of succinate and citrate were reduced as seen in Fig. 2 D, E, F, G and H. Mean concentrations of hippurate and creatinine displayed negligible differences when compared to healthy children throughout all time points. (Fig. 2 I and J).
Fig. 2.
Comparison of mean concentrations and standard errors of glucose (A), sorbitol (B), TMAO (C), (D) oxoglutarate, (E) lactate, (F) uric acid, (G) succinate, (H) citrate, (I) hippurate and creatinine (J) for healthy pediatric individuals (n=36) as well as pediatric renal transplant recipients prior to transplant (baseline) as well as before (pre-dose) and after initiation of tacrolimus treatment (4, 8 and 12 h, day 1, 3, 7, and months 1 and 3, n=9 patients).
4. Discussion
The application of combinatorial molecular marker strategies, which provide significantly more information than a single measurement and can thus be expected to have better specificity and detection power, has become an attractive approach for drug development and use as a diagnostic tool [2]. To date, several quantitative assays have been developed to simultaneously monitor changes in multiple urinary metabolites using a targeted mass spectrometry approach combined with liquid and gas chromatography separation techniques [12,18]. Although GC/MS has become the gold standard in targeted metabolite analysis due to its superior chromatographic resolution, this approach often involves extensive sample preparation combined with derivatization, extended analysis times, and/or lacks proper bioanalytical method validation following current guidelines [18]. A primary obstacle in LC-MS based metabolite analysis has been the ability to achieve chromatographic retention and separation, which allow for the separation of small polar analytes that are often not properly retained by standard reverse phase chromatography (RP) [18,19]. As an alternative, hydrophilic interaction chromatography (HILIC) offers a unique method for retention, separation and detection of polar metabolites [19,20]. Moreover, as previously described by Jandera et al. [21], many HILIC columns demonstrate a dual HILIC-RP retention mechanism, contingent upon the concentration of the organic solvent in the mobile phase. Taking advantage of this dual retention mechanism of the Luna HILIC column that has both oxyethylene and hydroxy bonded groups, the present assay was developed and validated under reversed phase conditions. This strategy resulted in superior chromatographic separation when compared to reversed phase columns or other HILIC columns using normal phase conditions. Additionally, the “dilute and shoot” sample preparation was fast and simple without extraction losses, yet it was not associated with significant matrix effects, an inherent risk of fast and simple sample preparation approaches. The simple sample preparation in combination with LC-MS/MS run times of 5.5 min resulted in an assay that allowed for high throughput of study and clinical samples.
After successful validation, normal ranges were established in healthy children and adults. Reference ranges for all ten metabolites in healthy adult individuals and children were unavailable for comparison. Normal ranges of creatinine, hippurate, citrate and uric acid in urine as determined in the present study were comparable to previously reported values in healthy adults [12,22,23] as well as the normal ranges of creatinine, hippurate, oxoglutarate and citrate in the urine of children [24].
The application of the assay to a clinical pilot study revealed elevated levels of several analytes in pediatric renal transplant recipients, primarily glucose, sorbitol, TMAO, oxoglutarate, lactate and uric acid when compared to healthy children. TMAO, a homeostatic rescue compound protective against the protein precipitory effects of uric acid, has previously been reported to increase in renal transplant patients and signify non-specific medullary injury and increased oxidative stress [5,11,25]. It was increased throughout early time-points following kidney transplantation and dosing of tacrolimus. In addition, the metabolite patterns in urine compared to healthy children were consistent with inhibition of the Krebs cycle. This is consistent with the known higher levels of oxygen radicals early after transplantation and treatment with calcineurin inhibitors [5]. Reactive oxygen species (ROS), lipid peroxidation, and antioxidant capacity have been associated with renal transplant patients in several previous studies [25,26].
As aforementioned mean concentrations of glucose, sorbitol as well as TMAO although elevated in the de novo pediatric transplant patients included in the pilot study, began to decrease over time and were similar to reference values near the end of the evaluation period. Although concentrations of hippurate and creatinine were elevated prior to renal transplantation, concentrations of both analytes displayed negligible differences when compared to reference values after kidney transplantation, suggesting stabilization of cell metabolism and function of the transplant kidney and improved kidney function.
The effects of kidney diseases on the urinary concentrations of the ten metabolites included in the present assay and their potential use as clinical diagnostic tools is summarized and discussed in references [1,3,6,29–31]. Nevertheless, the present targeted metabolomics panel has not yet been validated in prospective clinical trials. The availability of a validated, quantitative assay as here described will be a prerequisite for such studies.
5. Conclusion
A high throughput sensitive and specific LC-MS/MS assay for the quantification of ten molecular markers associated with renal function was developed and successfully validated. Moreover in addition to establishing reference values for both healthy adult individuals and children, the present study has provided first proof-of-concept that this multi-analyte LC-MS/MS assay is suitable for the analysis of clinical samples. A pilot study in pediatric transplant patients further supported the potential value of this targeted urine marker panel for monitoring kidney function after transplantation and the LC-MS/MS assay will be an important tool to further validate this marker panel in larger clinical trials.
Supplementary Material
Highlights.
An HPLC-MS/MS assay for the quantification of ten metabolites was developed.
Normal values assessed in healthy adult (n=120) and pediatric (n=36) individuals.
9 pediatric renal transplant recipients were evaluated during dosing of tacrolimus.
Acknowledgments
This work was supported by the United States National Institutes of Health (NIH), grant R01HD070511 and NIH/NCATS Colorado CTSI Grant Number UL1 TR001082.
Footnotes
Publisher's Disclaimer: This is a PDF file of an unedited manuscript that has been accepted for publication. As a service to our customers we are providing this early version of the manuscript. The manuscript will undergo copyediting, typesetting, and review of the resulting proof before it is published in its final citable form. Please note that during the production process errors may be discovered which could affect the content, and all legal disclaimers that apply to the journal pertain.
References
- 1.Wishart DS. Metabolomics: the principles and potential applications to transplantation. Am J Transplant. 2005;5:2814–2820. doi: 10.1111/j.1600-6143.2005.01119.x. [DOI] [PubMed] [Google Scholar]
- 2.Bohra R, Klepacki J, Klawitter J, Thurman JM, Christians U. Proteomics and metabolomics in renal transplantation-quo vadis? Transpl Int. 2013;26:225–241. doi: 10.1111/tri.12003. [DOI] [PMC free article] [PubMed] [Google Scholar]
- 3.Weiss RH, Kim K. Metabolomics in the study of kidney diseases. Nat Rev Nephrol. 2011;8:22–33. doi: 10.1038/nrneph.2011.152. [DOI] [PubMed] [Google Scholar]
- 4.Wang J, Zhou Y, Xu M, Rong R, Guo Y, Zhu T. Urinary metabolomics in monitoring acute tubular injury of renal allografts: a preliminary report. Transplant Proc. 2011;43:3738–3742. doi: 10.1016/j.transproceed.2011.08.109. [DOI] [PubMed] [Google Scholar]
- 5.Klawitter J, Haschke M, Kahle C, Dingmann C, Leibfritz D, Christians U. Toxicodynamic effects of ciclosporin are reflected by metabolite profiles in the urine of healthy individuals after a single dose. Br J Clin Pharmacol. 2010;70:241–251. doi: 10.1111/j.1365-2125.2010.03689.x. [DOI] [PMC free article] [PubMed] [Google Scholar]
- 6.Zhao YY. Metabolomics in chronic kidney disease. Clin Chim Acta. 2013;422:59–69. doi: 10.1016/j.cca.2013.03.033. [DOI] [PubMed] [Google Scholar]
- 7.Zhao YY, Cheng XL, Wei F, et al. Intrarenal metabolomics investigation of chronic kidney disease and its TGF-β1 mechanism in induced-adenine rats using UPLC Q-TOF/HSMS/MS(E) J Proteome Res. 2013;12:692–703. doi: 10.1021/pr3007792. [DOI] [PubMed] [Google Scholar]
- 8.Zhao YY, Liu J, Cheng XL, Bai X, Lin RC. Urinary metabonomics study on biochemical changes in an experimental model of chronic renal failure by adenine based on UPLC Q-TOF/MS. Clin Chim Acta. 2012;413:642–649. doi: 10.1016/j.cca.2011.12.014. [DOI] [PubMed] [Google Scholar]
- 9.Schmitz V, Klawitter J, Bendrick-Peart J, et al. Metabolic profiles in urine reflect nephrotoxicity of sirolimus and cyclosporine following rat kidney transplantation. Nephron Exp Nephrol. 2009;111:e80–91. doi: 10.1159/000209208. [DOI] [PubMed] [Google Scholar]
- 10.Klawitter J, Kushner E, Jonscher K, et al. Association of immunosuppressant-induced protein changes in the rat kidney with changes in urine metabolite patterns: a proteo-metabonomic study. J Proteome Res. 2010;9:865–875. doi: 10.1021/pr900761m. [DOI] [PMC free article] [PubMed] [Google Scholar]
- 11.Wishart DS. Metabolomics in monitoring kidney transplants. Curr Opin Nephrol Hypertens. 2006;15:637–642. doi: 10.1097/01.mnh.0000247499.64291.52. [DOI] [PubMed] [Google Scholar]
- 12.Gamagedara S, Shi H, Ma Y. Quantitative determination of taurine and related biomarkers in urine by liquid chromatography-tandem mass spectrometry. Anal Bioanal Chem. 2012;402:763–770. doi: 10.1007/s00216-011-5491-4. [DOI] [PubMed] [Google Scholar]
- 13.CDER (2001) U.S. Department of Health and Human Services, Food and Drug Administration, (CVM) CfDEaRaCfVM. Guidance for the Industry. Bioanalytical Method Validation. 2001 < http://www.fda.gov/cder/guidance>.
- 14.Institute. Evaluation of precision performance of quantitative measurement methods; Approved Guideline-Second Edition. CLS. [Google Scholar]
- 15.Matuszewski BK, Constanzer ML, Chavez-Eng CM. Strategies for the assessment of matrix effect in quantitative bioanalytical methods based on HPLC-MS/MS. Anal Chem. 2003;75:3019–3030. doi: 10.1021/ac020361s. [DOI] [PubMed] [Google Scholar]
- 16.Kark RM. A Primer of Urinalysis. New York: Harper & Row; 1964. [Google Scholar]
- 17.Institute CaLS, editor. CLSI, Defining, Establishing, and Verifying Reference Intervals in the Clinical Laboratory; Approved Guideline-Third Edition. Wayne, PA: 2008. [Google Scholar]
- 18.Kvitvang HF, Andreassen T, Adam T, Villas-Boas SG, Bruheim P. Highly sensitive GC/MS/MS method for quantitation of amino and nonamino organic acids. Anal Chem. 2011;83:2705–2711. doi: 10.1021/ac103245b. [DOI] [PubMed] [Google Scholar]
- 19.Rappold BA, Grant RP. HILIC-MS/MS method development for targeted quantitation of metabolites: practical considerations from a clinical diagnostic perspective. J Sep Sci. 2011;34:3527–3537. doi: 10.1002/jssc.201100550. [DOI] [PubMed] [Google Scholar]
- 20.Jian W, Xu Y, Edom RW, Weng N. Analysis of polar metabolites by hydrophilic interaction chromatography--MS/MS. Bioanalysis. 2011;3:899–912. doi: 10.4155/bio.11.51. [DOI] [PubMed] [Google Scholar]
- 21.Jandera P, Hajek T, Skerikova V, Soukup J. Dual hydrophilic interaction-RP retention mechanism on polar columns: structural correlations and implementation for 2-D separations on a single column. J Sep Sci. 2010;33:841–852. doi: 10.1002/jssc.200900678. [DOI] [PubMed] [Google Scholar]
- 22.Kwon W, Kim JY, Suh S, In MK. Simultaneous determination of creatinine and uric acid in urine by liquid chromatography-tandem mass spectrometry with polarity switching electrospray ionization. Forensic Sci Int. 2012;221:57–64. doi: 10.1016/j.forsciint.2012.03.025. [DOI] [PubMed] [Google Scholar]
- 23.Johnson DW. A flow injection electrospray ionization tandem mass spectrometric method for the simultaneous measurement of trimethylamine and trimethylamine N-oxide in urine. J Mass Spectrom. 2008;43:495–499. doi: 10.1002/jms.1339. [DOI] [PubMed] [Google Scholar]
- 24.Kaluzna-Czaplinska J. Noninvasive urinary organic acids test to assess biochemical and nutritional individuality in autistic children. Clin Biochem. 2011;44:686–691. doi: 10.1016/j.clinbiochem.2011.01.015. [DOI] [PubMed] [Google Scholar]
- 25.Serkova N, Fuller TF, Klawitter J, Freise CE, Niemann CU. 1H-NMR-based metabolic signatures of mild and severe ischemia/reperfusion injury in rat kidney transplants. Kidney Int. 2005;67:1142–1151. doi: 10.1111/j.1523-1755.2005.00181.x. [DOI] [PubMed] [Google Scholar]
- 26.Christians U, Schmitz V, Schoning W, Bendrick-Peart J, Klawitter J, Haschke M. Toxicodynamic therapeutic drug monitoring of immunosuppressants: promises, reality, and challenges. Ther Drug Monit. 2008;30:151–158. doi: 10.1097/FTD.0b013e31816b9063. [DOI] [PubMed] [Google Scholar]
- 27.Lanaspa MA, Andres-Hernando A, Rivard CJ, Dai Y, Li N, Berl T. ZAC1 is up-regulated by hypertonicity and decreases sorbitol dehydrogenase expression, allowing accumulation of sorbitol in kidney cells. J Biol Chem. 2009;284:19974–19981. doi: 10.1074/jbc.M109.001792. [DOI] [PMC free article] [PubMed] [Google Scholar]
- 28.Mohan P, Safi K, Little DM, et al. Improved patient survival in recipients of simultaneous pancreas-kidney transplant compared with kidney transplant alone in patients with type 1 diabetes mellitus and end-stage renal disease. Br J Surg. 2003;90:1137–1141. doi: 10.1002/bjs.4208. [DOI] [PubMed] [Google Scholar]
- 29.Niemann CU, Serkova NJ. Biochemical mechanisms of nephrotoxicity: application for metabolomics. Expert Opin Drug Metab Toxicol. 2007;3:527–544. doi: 10.1517/17425225.3.4.527. [DOI] [PubMed] [Google Scholar]
- 30.Wishart DS. Metabolomics: a complementary tool in renal ransplantation. Contrib Nephrol. 2008;160:76–87. doi: 10.1159/000125935. [DOI] [PubMed] [Google Scholar]
- 31.Christians U, Albuisson J, Klawitter J, Klawitter J. The role of metabolomics in the study of kidney diseases and in the development of diagnostic tools. In: Edelstein C, editor. Biomarkers of Kidney Disease. Elsevier; San Diego: 2010. pp. 39–100. [Google Scholar]
Associated Data
This section collects any data citations, data availability statements, or supplementary materials included in this article.


