Abstract
Preclinical evidence depicts the capacity of redaporfin (Redp) to act as potent photosensitizer, causing direct antineoplastic effects as well as indirect immune‐dependent destruction of malignant lesions. Here, we investigated the mechanisms through which photodynamic therapy (PDT) with redaporfin kills cancer cells. Subcellular localization and fractionation studies based on the physicochemical properties of redaporfin revealed its selective tropism for the endoplasmic reticulum (ER) and the Golgi apparatus (GA). When activated, redaporfin caused rapid reactive oxygen species‐dependent perturbation of ER/GA compartments, coupled to ER stress and an inhibition of the GA‐dependent secretory pathway. This led to a general inhibition of protein secretion by PDT‐treated cancer cells. The ER/GA play a role upstream of mitochondria in the lethal signaling pathway triggered by redaporfin‐based PDT. Pharmacological perturbation of GA function or homeostasis reduces mitochondrial permeabilization. In contrast, removal of the pro‐apoptotic multidomain proteins BAX and BAK or pretreatment with protease inhibitors reduced cell killing, yet left the GA perturbation unaffected. Altogether, these results point to the capacity of redaporfin to kill tumor cells via destroying ER/GA function.
Keywords: Golgi apparatus, Golgi‐targeting agents, photodynamic therapy, redaporfin, retrograde transport
Subject Categories: Autophagy & Cell Death, Cancer
Introduction
Photodynamic therapy (PDT) is a novel antineoplastic treatment modality. At the physicochemical level, the principle of PDT resides in the administration of a photosensitizer that itself is rather inert, yet acquires cytotoxic potential upon absorption of photons that cause the generation of reactive oxygen species (ROS), hence damaging cellular structures. At the practical level, the photosensitizing drug is injected systemically or intratumorally. After a defined time, named the drug‐to‐light interval (DLI), light with appropriate wavelength is applied to the targeted area. High DLI facilitates optimal redistribution of the compound into organellar, cellular, or subcellular compartments, whereas low DLI is mainly used to target the tumor vasculature. Photodynamic therapy allows to limit the overall side effects and to control the spatial and temporary extension of the treatment with unprecedented precision. It is minimally invasive with superior functional outcome as compared to surgery. Both in preclinical models and in the clinical context, PDT‐elicited anti‐tumor immunity has been observed (Agostinis et al, 2011; Dabrowski & Arnaut, 2015).
The first‐in‐class photosensitizer approved for clinical use in cancer treatment is porfimer. This hematoporphyrin derivative presented promising results in patients, despite limitations including low molar absorption, poor tissue penetration of light at 630 nm, and a rather long‐lasting photosensitivity, obliging patients to stay in the dark (Allison & Sibata, 2010). Some of these limitations were partially overcome by the second generation of photosensitizers including temoporfin, silicon phthalocyanine‐4, talaporfin, and verteporfin, which are endowed with intense absorption bands at longer wavelengths and shorter periods of photosensitivity (Allison & Sibata, 2010). The latest generation photosensitizers include the bacteriochlorins, padeliporfin, and redaporfin (Redp), which are currently under clinical evaluation. Major advantages include a high ROS quantum yield and absorption in high spectral regions (740–780 nm) that allow to treat relatively deep lesions. Fast clearance of padeliporfin limits PDT protocols to targeting of the tumor vasculature. In contrast, redaporfin is endowed with higher stability that is compatible with both long and short DLI (Arnaut et al, 2014). Redaporfin‐based PDT was shown to be effective in the treatment of immunocompetent mice bearing subcutaneous tumors with up to 85% of cure rate. Recently, phase I/II clinical trials have successfully been concluded in advanced head and neck cancer patients (NCT02070432). The anticancer effect of redaporfin‐based PDT was partially ascribed to the host immune system as the treatment efficacy dropped dramatically in immunodeficient mice (Rocha et al, 2015; Pucelik et al, 2016). Anti‐tumor immunity activated by redaporfin‐PDT inhibits the growth of distant (and non‐irradiated) lesions and protects cured mice from rechallenge with live cancer cells (Rocha et al, 2015; Pucelik et al, 2016). This immunostimulatory effect of redaporfin is reminiscent of that induced by hypericin (Hyp). Indeed, PDT with hypericin has been the first PDT to be shown to induce immunogenic cell death (ICD; Garg et al, 2012). Photodynamic therapy with hypericin triggers ICD through a pathway that involves endoplasmic reticulum (ER) stress (Garg et al, 2012), as indicated by the phosphorylation of eukaryotic translation initiation factor 2‐alpha (eIF2α) by the ER stress kinase eIF2α kinase 3 (EIF2AK3, best known as PERK) and the exposure of calreticulin at the cell surface (Galluzzi et al, 2012; Garg et al, 2012, 2016; Rufo et al, 2017). Indeed, the induction of ER stress appears to be required for the induction of ICD, as this has been shown for chemotherapy and radiotherapy as well (Obeid et al, 2007; Panaretakis et al, 2009; Kepp et al, 2014; Garg et al, 2015; Galluzzi et al, 2017).
Captivated by the aforementioned premises, we decided to investigate the cellular and molecular mechanisms through which redaporfin kills cancer cells. Here, we show that redaporfin specifically accumulated in the endoplasmic reticulum (ER) and, in addition, in the Golgi apparatus (GA). Light‐activated redaporfin causes selective damage to these subcellular compartments, elicits ER stress, and irreversibly compromises GA‐dependent secretion. Unexpectedly, the ER/GA compartment targeted by redaporfin appears to operate upstream of the mitochondrial pathway of apoptosis to cause cell killing.
Results
Phototoxic effects of redaporfin on Golgi apparatus and endoplasmic reticulum
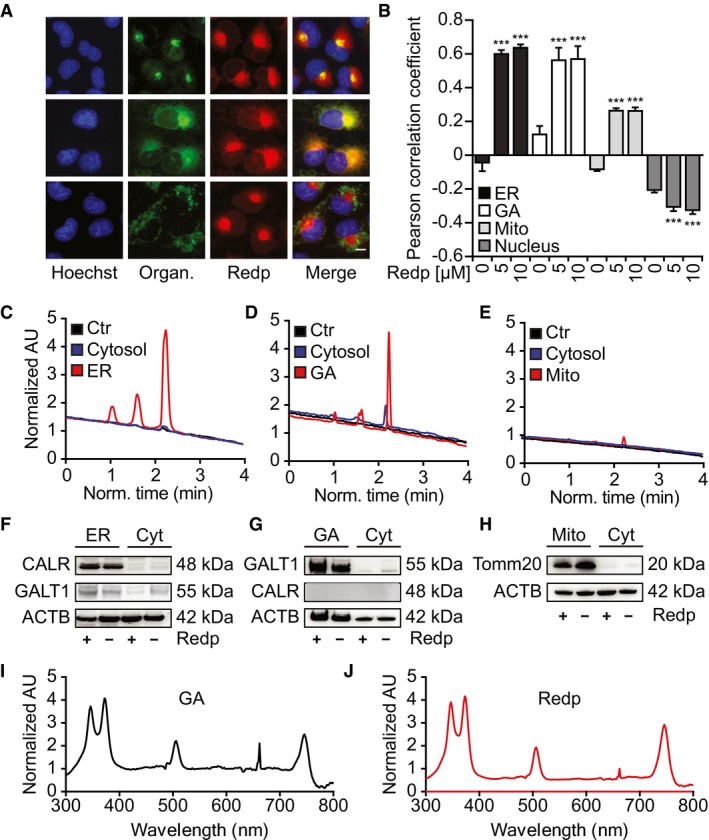
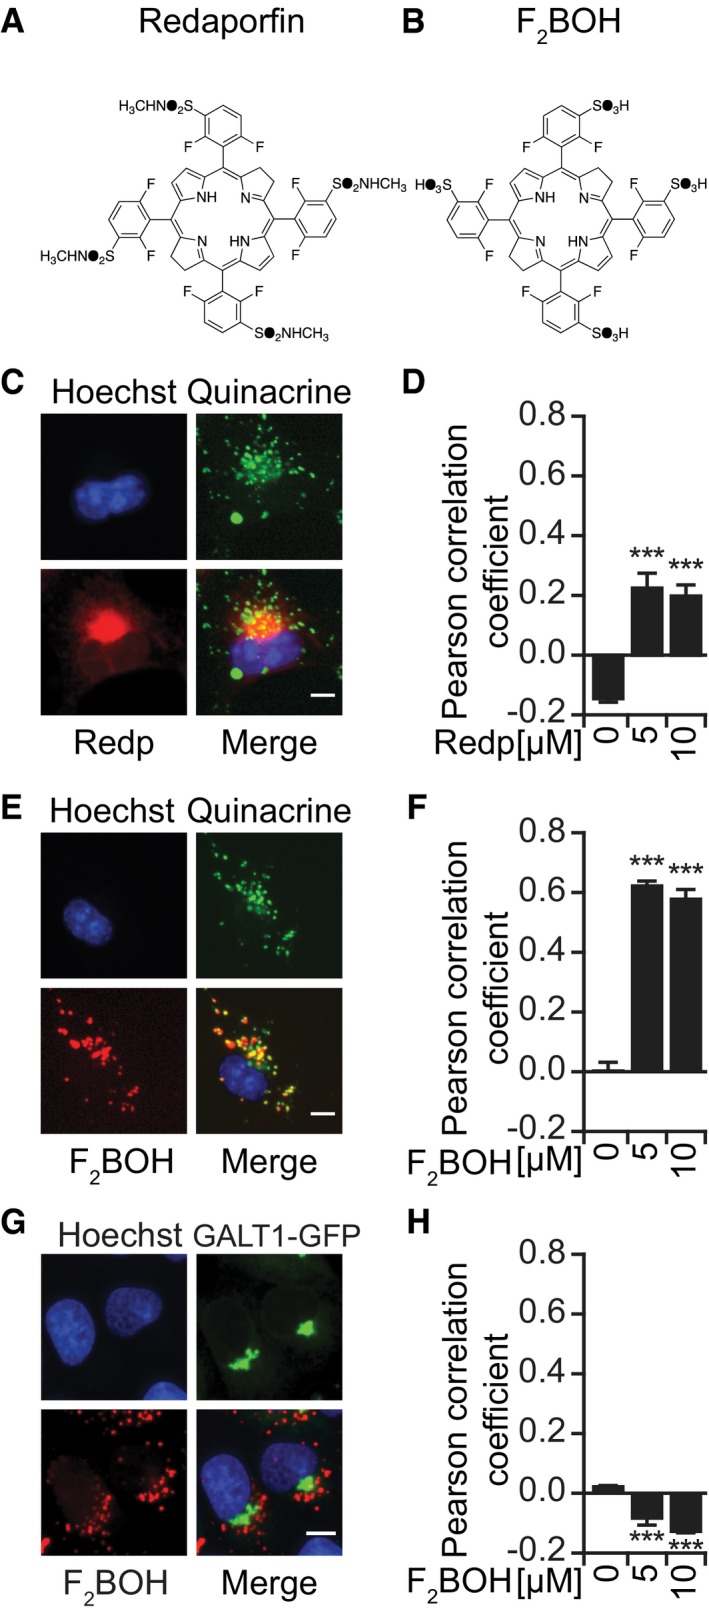
To determine the subcellular tropism of redaporfin, we loaded this agent into cells for 20 h (Appendix Fig S1A–D) and then visualized its distribution based on its fluorescent properties (excitation at 510 nm, emission of 750 nm; Arnaut et al, 2014). This 20‐h preincubation period with redaporfin effectively sensitizes the cells to PDT‐induced killing (Appendix Fig S1G and H). Fluorescence microscopy imaging revealed that redaporfin strongly colocalized with the GA and ER. Redaporfin‐emitted fluorescence spatially co‐distributed with the GA‐specific marker GALT1, stably expressed as a green fluorescent protein (GFP) fusion, and with the ER‐specific marker CALR‐GFP. Only minimal colocalization was observed with mitochondria visualized with MitoTracker Green or with lysosomes stained with quinacrine (Figs 1A and B, and EV1C and D; Appendix Fig S1E and F). Next, we asked whether dispersion of the GA would affect the subcellular localization of redaporfin. For this, we used brefeldin A (BFA), a natural antiviral compound synthesized by Eupenicillium brefeldianum that interrupts protein transport from the ER to the GA by abolishing the association of COP‐I protein with the Golgi membrane (Duden et al, 1991). Alternatively, we used golgicide A (GCA), a pharmacological inhibitor of the cis‐Golgi ArfGEF GBF1 that arrests the secretion of soluble and membrane‐anchored proteins (Saenz et al, 2009). Dispersion of the GA with BFA or GCA led to a redistribution of the redaporfin fluorescence toward a diffuse cytoplasmic pattern, while induction of GA fragmentation with nocodazole (Cole et al, 1996) caused redaporfin to relocalize into multiple cytoplasmic dots (Appendix Fig S1I and J). Subcellular fractionation confirmed the ER/GA tropism of redaporfin. Purified ER micelles and Golgi stacks (but not mitochondria contained in heavy membrane fractions) from redaporfin‐pretreated cells (Fig 1F–H) exhibited a distinct high‐pressure liquid chromatography (HPLC) peak of UV absorbance (Fig 1C–E) that corresponded in its spectrum to that of redaporfin (Fig 1I and J). F2BOH, a molecule chemically related to redaporfin where the peripheral sulfonamide (SO2NHCH3) groups were replaced by sulfonic acid (SO3H) groups (Fig EV1A and B), exhibited a different subcellular distribution without any ER/GA tropisms but instead a preferentially lysosomal localization, as determined by fluorescence microscopy (Fig EV1C–H). F2BOH is hydrophilic, with an n‐octanol:water partition coefficient P OW = 0.04, whereas redaporfin is lipophilic, P OW = 80 (Arnaut et al, 2014).
Figure 1. Redaporfin accumulates at sites of the ER and Golgi apparatus.
-
A, BCo‐occurrence of redaporfin (5 μM) with markers of the GA, ER, and mitochondria in U2OS cells (A) and their Pearson correlation coefficient (PCC) (B). Bars indicate means ± SD of triplicates of one representative experiment out of two repeats. Asterisks indicate significant differences with respect to untreated cells, ***P < 0.001 (one‐way ANOVA). Scale bar: 10 μm.
-
C–HDetection of redaporfin (5 μM) by HPLC‐UV in ER and Golgi fractions from U2OS cells incubated with redaporfin (C–E). Fractions were tested for purity by immunoblotting using CALR, GALT1, and TOMM20 antibodies (F–H).
-
I, JAbsorption spectra of redaporfin from the Golgi fraction and the pure standard.
Figure EV1. F2 BOH preferentially accumulates at acidic vesicles.
-
A, BMolecular structures of the halogenated bacteriochlorins, redaporfin (LUZ11) (A), and F2BOH (LUZ10) (B).
-
C–FRepresentative images of U2OS cells showing the co‐occurrence of redaporfin (C, D) and F2BOH (E, F) with acidic vesicles stained with quinacrine and the respective Pearson correlation coefficients. Scale bar: 10 μm.
-
G, HRepresentative images of U2OS‐GALT1‐GFP cells showing the lack of co‐occurrence of F2BOH with the GA (G) and the corresponding Pearson correlation coefficient (H). Scale bar: 10 μm.
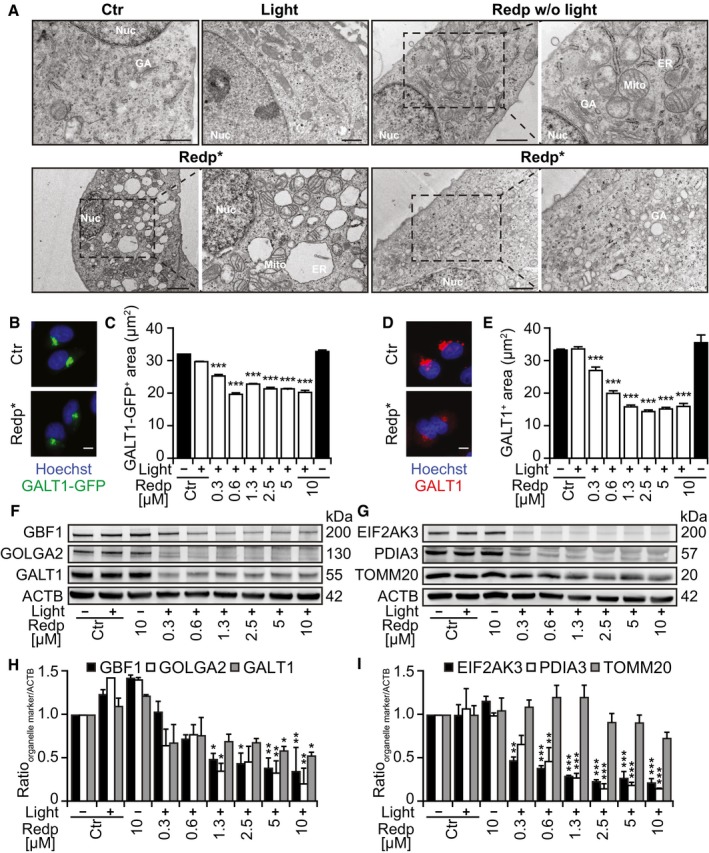
Next, we used transmission electron microscopy to examine the ultrastructural effects induced by redaporfin treatment followed by light illumination. While the non‐exposed, inactive drug failed to affect the structural morphology of any organelle, its exposure to light (i.e., PDT) resulted in marked alterations of the ER/GA compartment such as dilation and vacuolization of the ER as well as disorganization of Golgi cisterns (Fig 2A). Cells expressing the GA marker GALT1‐GFP exhibited a reduction in the fluorescent signal after PDT (Fig 2B and C), and similarly, endogenous GALT1 detected by immunofluorescence staining diminished post‐PDT (Fig 2D and E). The same effect was observed with hypericin, a photosensitizer that targets the ER and GA (Ritz et al, 2008; Appendix Fig S2A and B). In contrast, F2BOH (which targets lysosomes) did not cause any reduction in endogenous GALT1 visualized by immunofluorescence staining (Appendix Fig S2C and D). Quantitative immunoblots confirmed that PDT with redaporfin induced a reduction in the abundance of several GA proteins such as Golgi brefeldin A‐resistant guanine nucleotide exchange factor 1 (GBF1), golgin subfamily A member 2 (GOLGA2), and galactosyltransferase 1 (GALT1), as well as that of two ER proteins, eukaryotic translation initiation factor 2‐alpha (eIF2α) kinase 3 (EIF2AK3) and protein disulfide‐isomerase A3 (PDIA3). In contrast, no major decrease in mitochondrial import receptor subunit TOM20 homolog (TOMM20) or in the cytoskeleton protein β‐actin was observed (Fig 2F–I).
Figure 2. Ultrastructural changes of ER and Golgi after redaporfin‐PDT .
-
ARepresentative images of U2OS cells analyzed 6 h after redaporfin‐PDT by transmission electron microscopy. Additional negative controls included cells incubated with redaporfin (5 μM) without photoactivation or cells submitted to light irradiation in the absence of redaporfin. Nuc marks nucleus, ER marks endoplasmic reticulum, GA marks Golgi apparatus, and Mito marks mitochondria. Scale bar: 1 μm
-
B–ERepresentative images of U2OS‐GALT1‐GFP (B) and U2OS stained for GALT1 (D) 6 h after PDT with redaporfin (5 μM). Quantitative analysis represents the average area of GALT1+ Golgi structures per cell (C, E). Scale bars: 10 μm.
-
F–ISix hours after treatment of U2OS cells with PDT with redaporfin (5 μM), protein was collected and tested by immunoblotting for different GA‐, ER‐, or mitochondria‐specific proteins. Representative immunoblots (F, G) and densitometry data (H, I) are depicted.
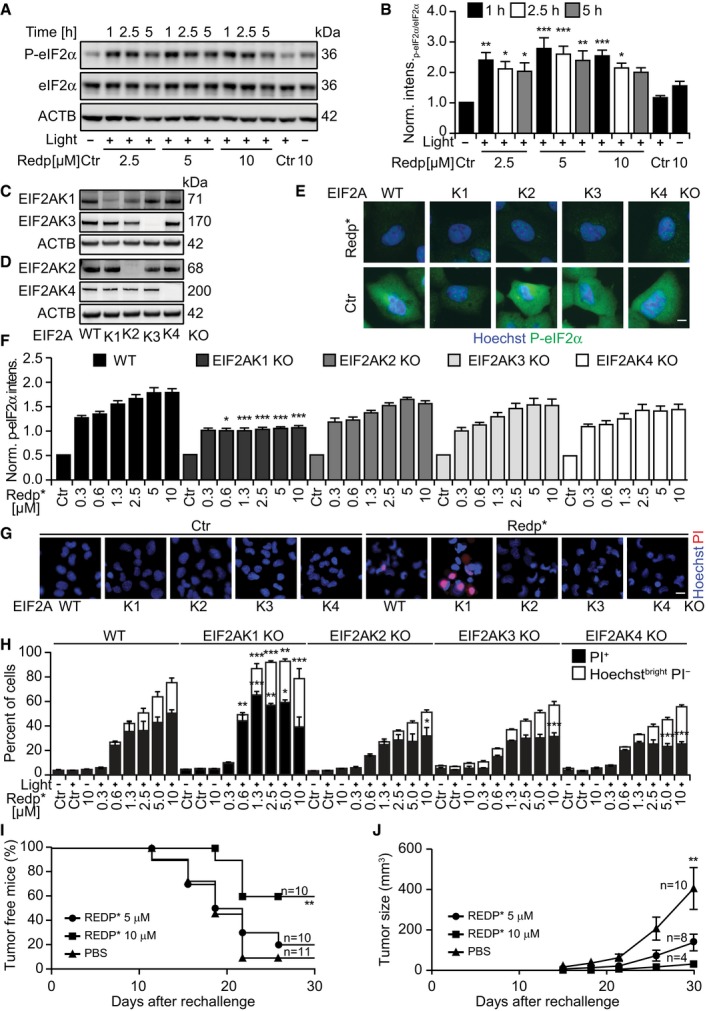
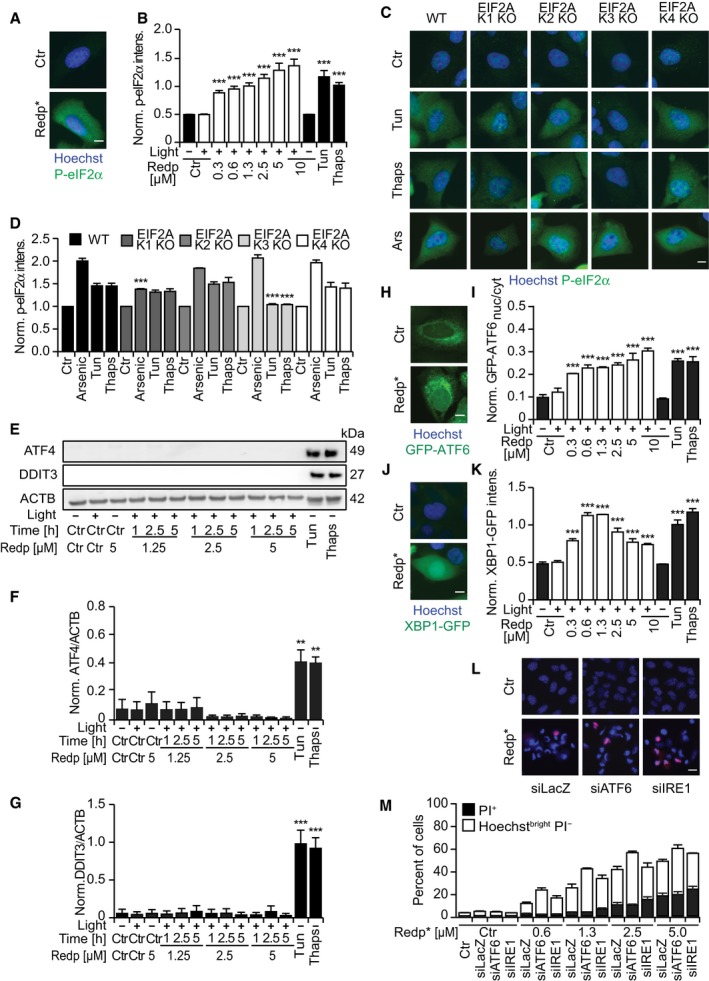
Redaporfin‐based PDT also induced signs of ER stress including phosphorylation of eIF2α detectable by immunoblot (Fig 3A and B) and immunofluorescence staining (Fig EV2A and B) as early as 1 h after the treatment. Systematic analysis of cells in which each of the four eIF2α kinases (EIF2AK1 to 4) was deleted by CRISPR/Cas9 technology (Fig 3C and D) revealed that the sole kinase responsible for eIF2α phosphorylation induced by redaporfin‐based PDT was EIF2AK1 (previously known as heme‐responsive inhibitor, HRI; Fig 3E and F), perhaps reflecting the molecular similarities between heme and redaporfin, which both bear porphyrin rings (Fig EV1A). Thus, redaporfin‐based PDT elicits eIF2α phosphorylation through a pathway that is different from canonical ER stressors such as thapsigargin (Thaps) and tunicamycin (Tun), yet similar to arsenite (Fig EV2C and D). Knockout of EIF2AK1 (but not that of EIF2AK2, EIF2AK3, or EIF2AK4) sensitized the cells to redaporfin‐dependent phototoxicity (Fig 3G–H). Redaporfin‐based PDT failed to elicit the activation of ATF4 and DDIT3, two transcription factors downstream of eIF2α phosphorylation (Fig EV2E–G). Nevertheless, biosensor cell lines measuring different arms of the unfolded stress response confirmed the induction of ER stress at the levels of ATF6, as indicated by the significant translocation to the nucleus of ATF6‐GFP and the IRE1–XBP1 axis, as indicated by the XBP1‐GFP reporter construct which only becomes visible when IRE1 mediates an in‐frame splicing (Fig EV2H–K). Knockdown of either ATF6 or IRE1 failed to sensitize the cells to redaporfin‐dependent phototoxicity (Fig EV2L and M). Although redaporfin‐mediated PDT led to a reduction in protein synthesis, this inhibition was not complete (Fig EV3). Redaporfin‐mediated ER damage was also associated with increased cytosolic Ca2+ levels (Appendix Fig S3).
Figure 3. Redaporfin‐PDT induces EIF2AK1‐mediated eIF2α phosphorylation.
-
A, BRepresentative immunoblot (A) and densitometry (means ± SEM of four independent experiments) of P‐eIF2α/eIF2α ratio (B) of cells collected at the indicated time points after redaporfin‐PDT.
-
C, DImmunoblots of U2OS cells KO for each of the eIF2α kinases: EIF2AK1 (C), EIF2AK2 (D), EIF2AK3 (C), and EIF2AK4 (D).
-
E, FRepresentative images of P‐eIF2α immunofluorescence in U2OS cells wild‐type or KO for each eIF2α kinase obtained 2.5 h after PDT with redaporfin (5 μM) (E) and quantitative analysis that represents cytoplasmic P‐eIF2α fluorescence signal (F). Scale bar: 10 μm.
-
G, HCytotoxicity of redaporfin‐mediated PDT in U2OS cells wild‐type or KO for each eIF2α kinase evaluated 6 h post‐irradiation by staining with PI and Hoechst 33342 (G) and the quantification of dying cancer cells (Hoechstbright and PI−) and dead cells (PI+ cells) (H). Scale bar: 20 μm.
-
I, JImmunogenicity of TC1 cells killed in vitro by redaporfin‐mediated PDT. Dead/dying TC1 cells were injected subcutaneously into immunocompetent mice followed by rechallenge with live/untreated TC1 cells one week later. Graphs report the evolution of tumor incidence over time as a Kaplan–Meier curve (I) and tumor growth in those mice that developed palpable neoplastic lesion (J).
Figure EV2. Redaporfin‐PDT induces an incomplete ER stress response characterized by the activation of ATF6 and IRE1 arms and phosphorylation of eIF2α, but no expression of the two transcription factors, ATF4 and CHOP.
-
A, BRepresentative images of U2OS cells stained for P‐eIF2α 2.5 h after PDT with redaporfin (5 μM) or after 6 h of incubation with tunicamycin (2.5 μM) and thapsigargin (2.5 μM) (A), and its quantitative analysis that represents cytoplasmic P‐eIF2α fluorescence signal (B). Scale bar: 10 μm.
-
C, DRepresentative images of P‐eIF2α immunofluorescence in U2OS cells wild‐type or KO for each eIF2α kinase after incubation with tunicamycin (2.5 μM, 6 h), thapsigargin (2.5 μM, 6 h), or arsenite trioxide (1 mM, 2 h) (C), and its quantitative analysis that represents cytoplasmic P‐eIF2α fluorescence signal (D). Scale bar: 10 μm.
-
E–GRepresentative immunoblots (E) and densitometry of ATF4 (F) and CHOP (G) of protein extracts collected from U2OS cells at the indicated time points after redaporfin‐PDT or after 12 h of incubation with tunicamycin (2.5 μM) or thapsigargin (2.5 μM).
-
H, IRepresentative images of U2OS cells expressing GFP‐ATF6 8 h after PDT with redaporfin (5 μM), tunicamycin (2.5 μM), and thapsigargin (2.5 μM) (H), and the quantitative analysis that reflects ATF6 translocation from the cytoplasm into the nucleus (I). Scale bar: 10 μm.
-
J, KRepresentative images of U2OS cells expressing XBP1‐GFP 20 h after PDT with redaporfin (5 μM), tunicamycin (2.5 μM), and thapsigargin (2.5 μM) (J), and quantitative analysis of XBP1 de novo expression based on cellular fluorescence (K). Scale bar: 10 μm.
-
L, MImpact of ATF6 and IRE1 silencing on the cytotoxicity of PDT with redaporfin (5 μM), which was evaluated at 6 h post‐irradiation by double staining with PI and Hoechst 33342 (L) and the quantification of dying (Hoechstbright and PI−) and dead cells (PI+ cells) (M). Scale bar: 20 μm.
Figure EV3. Partial inhibition of protein synthesis by redaporfin‐PDT .

-
A, BRepresentative images of newly synthesized proteins evaluated by detection of L‐azidohomoalanine in U2OS cells submitted to PDT with redaporfin (5 μM) in methionine‐free conditions and cycloheximide (CHX, 50 μM) (A), and quantitative analysis that depicts fluorescence signal on the cytoplasm (B).
eIF2α phosphorylation without the activation of ATF4 and DDIT3 was recently described as a hallmark of ICD (Bezu et al, 2018). Indeed, redaporfin‐based PDT induced other hallmarks of ICD such as plasma membrane calreticulin exposure, as well as the release of ATP and HMGB1 from cancer cells in vitro (Appendix Fig S4). Accordingly, redaporfin‐PDT‐killed TC1 lung cancer cells injected subcutaneously into syngeneic mice were able to fully protect a fraction of the animals against rechallenge with live TC1 cells (Fig 3I) and to reduce tumor growth in the remaining mice (Fig 3J).
Altogether, the aforementioned results indicate that redaporfin affects the structure, activity, and composition of the ER/GA compartment upon irradiation with light and that these alterations have functional consequences.
Redox stress and Golgi‐dependent phototoxicity of redaporfin
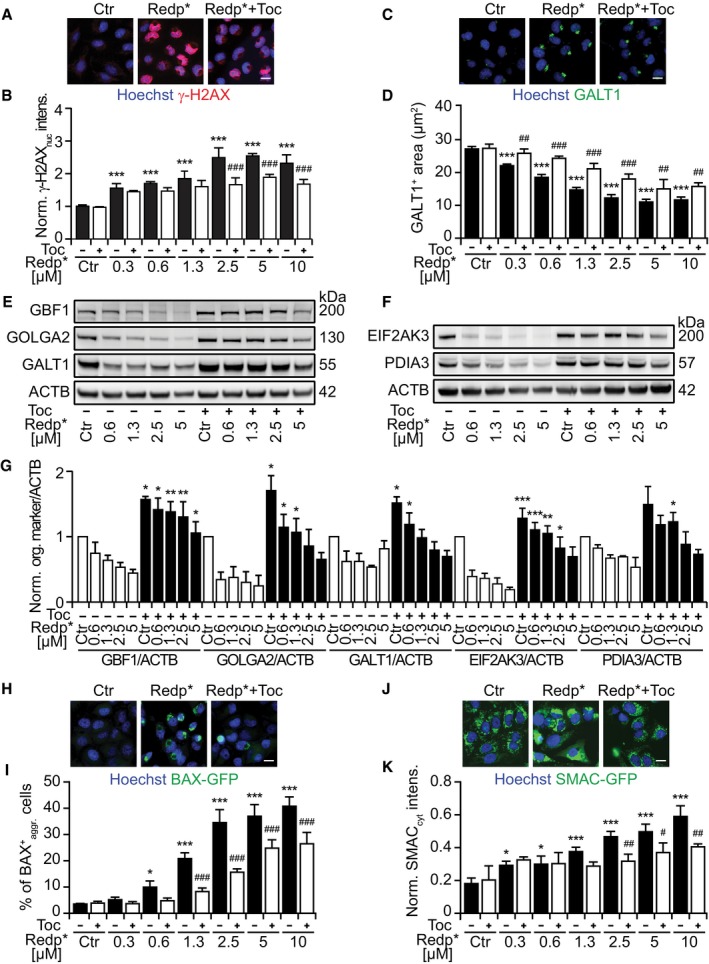
Photodynamic therapy involves the generation of reactive oxygen species (ROS; Arnaut et al, 2014). Accordingly, redaporfin exposure to light led to an increase in CellROX Green‐detectable ROS, a phenomenon that could be reversed by addition of the lipophilic antioxidant tocopherol (Toc; Appendix Fig S5A and B). Tocopherol also suppressed the activation of another ROS sensor, dihydroethidine (DHE), which is particularly sensitive to superoxide (Appendix Fig S5C–F). Accordingly, tocopherol inhibited the PDT‐mediated induction of γ‐H2AX DNA damage foci (Fig 4A and B, and Appendix Fig S5G and H), prevented the phototoxic effect of redaporfin‐based PDT (Appendix Fig S5I and J), and reduced the depletion of multiple proteins from the GA and the ER (Fig 4C–G). Beyond these effects, tocopherol inhibited the redaporfin‐based PDT‐induced translocation of the pro‐apoptotic protein BAX (visualized as a BAX‐GFP fusion protein) from the cytosol to mitochondria, as well as the mitochondrial release of second mitochondria‐derived activator of caspases (SMAC, visualized as a SMAC‐GFP fusion protein; Fig 4H–K). Hence, tocopherol prevented alteration of ER/GA morphology and blocked several manifestations of the intrinsic (mitochondrial) apoptotic cell death cascade.
Figure 4. The antioxidant tocopherol significantly attenuates the cytotoxicity mediated by redaporfin‐PDT .
-
A, BRepresentative images of U2OS cells stained for histone H2AX phosphorylation (γ‐H2AX), 6 h after PDT with redaporfin (5 μM), in the presence or absence of tocopherol (Toc; 500 μM) (A), and quantitative analysis based on the γ‐H2AX fluorescence in the nucleus (B).
-
C, DRepresentative images of U2OS cells, stained for GALT1 6 h after PDT with redaporfin (5 μM), in the presence or absence of Toc (500 μM) (C), together with the quantitative analysis that reflects the average area of GALT1+ Golgi structures per cell (D).
-
E–GImmunoblots and densitometry analysis for different GA (E, G) and ER proteins (F, G) of U2OS cells that were co‐incubated with redaporfin and Toc (1 mM) for 20 h. Protein extraction was performed 6 h after irradiation.
-
H, IRepresentative images of BAX‐GFP aggregation at mitochondria after PDT with redaporfin (5 μM), in the presence or absence of Toc (500 μM), 6 h after irradiation (H) alongside the percentage of cells presenting BAX‐GFP aggregation (I). Scale bar: 20 μm.
-
J, KRepresentative images of SMAC‐GFP release from mitochondria into the cytosol 6 h after PDT with redaporfin (5 μM), in the presence or absence of Toc (500 μM) (J). The increase in GFP in the cytoplasm, excluding the fluorescence intensity of mitochondria, was quantified and used as an indication of SMAC release (K).
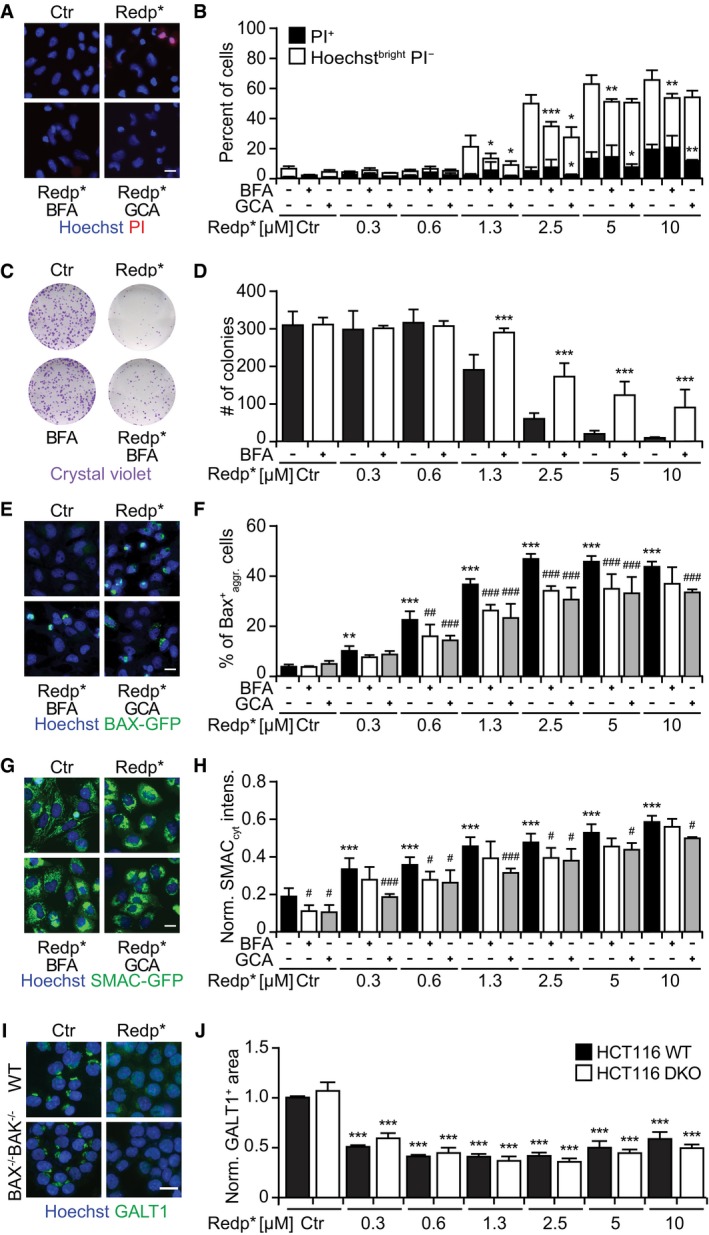
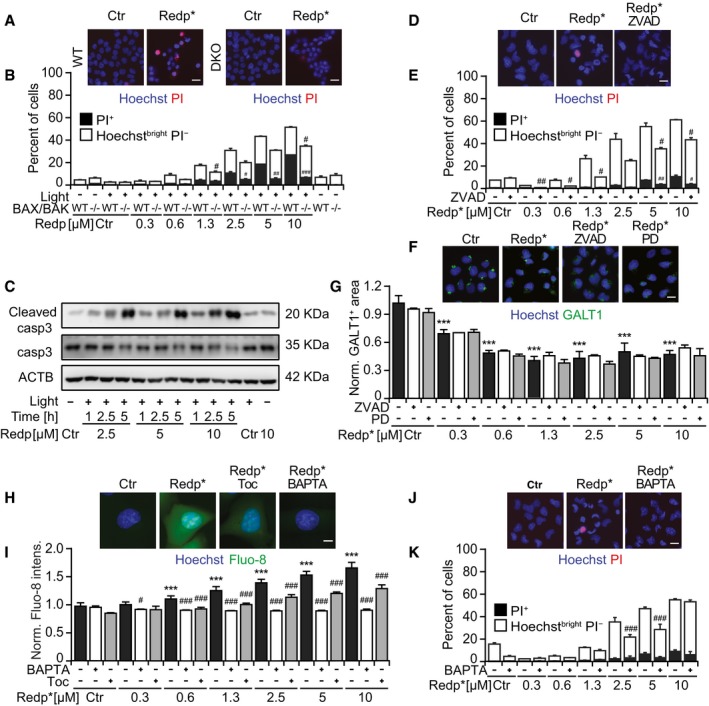
Next, we investigated the possibility that an intact GA may be needed to support redaporfin‐PDT toxicity. Both BFA and GCA partially reduced cell killing induced by redaporfin‐mediated PDT in U2OS cells (Fig 5A–D) as well as in three other cell lines (Appendix Fig S6). Brefeldin A and GCA inhibited the mitochondrial translocation of BAX‐GFP (Fig 5E and F) and reduced the mitochondrial release of SMAC‐GFP (Fig 5G and H). This suggested that the GA played a role upstream of the mitochondria in mediating redaporfin‐PDT. This is in agreement with the fact that cells lacking BAX and BAK were less susceptible to the acute cytotoxic effect of PDT with redaporfin (Fig EV4A and B) while, in contrast, removal of BAX and BAK had no effect on the PDT‐induced depletion of GALT1 (Fig 5I and J). While PDT was accompanied by caspase‐3 activation (Fig EV4C) and caspase inhibition with Z‐VAD‐fmk reduced cell killing (Fig EV4D and E), pretreatment with Z‐VAD‐fmk (or the calpain inhibitor PD150606) failed to impede the PDT‐induced GA destruction (Fig EV4F and G). Pretreatment of cells with the cell‐permeable calcium chelator BAPTA‐AM to prevent the PDT‐induced (and tocopherol‐inhibitable) rise in cytosolic Ca2+ (Fig EV4H and I) significantly reduced the level of cell death as well (Fig EV4J and K). These results plead in favor of the idea that BAX/BAK‐regulated processes operate downstream of PDT‐induced ER/GA effects.
Figure 5. GA damage is an upstream event to mitochondria‐mediated redaporfin‐PDT toxicity, which is slightly inhibited by BFA and GCA .
-
A, BCytotoxicity of redaporfin‐PDT, alone or in combination with brefeldin A or golgicide A, evaluated 6 h post‐irradiation by double staining with PI and Hoechst 33342 (A), and the quantification of dying (Hoechstbright and PI−) and dead cells (PI+ cells) (B). Brefeldin A (BFA, 5 μg/ml) or golgicide A (GCA, 5 μM) was added 4 h before irradiation and let presented until the end of the assay.
-
C, DRepresentative images of colonies observed 7 days after PDT, upon crystal violet staining (C), alongside the number of colonies (D).
-
E, FRepresentative images of BAX‐GFP aggregation at the level of mitochondria after PDT with redaporfin (5 μM), in the presence or absence of BFA or GCA, 6 h after cell irradiation (E) together with the percentage of cells presenting BAX‐GFP aggregation (F).
-
G, HRepresentative images of SMAC‐GFP release from mitochondria into the cytosol 6 h after PDT with redaporfin (5 μM), in the presence or absence of BFA or GCA (G). The increase in GFP in the cytoplasm, excluding the fluorescence intensity of mitochondria, was quantified and used as an indication of SMAC release (H).
-
I, JRepresentative images of HCT116/HCT116 BAX−/−BAK−/− treated with PDT with redaporfin (5 μM), followed by immunofluorescence of GALT1 (I), and the quantitative analysis that represents the average area of GALT1+ Golgi structures per cell (J).
Figure EV4. Reduced cytotoxicity of redaporfin‐PDT in the presence of the antioxidant Toc, the pan‐caspase inhibitor ZVAD, the calcium chelator BAPTA, and BAX/BAK knockout.
-
A, BViability of HCT116 and HCT116 BAX−/−BAK−/− cells after treatment with redaporfin‐based PDT. Scale bar: 20 μm.
-
CRepresentative immunoblot of cleaved caspase‐3 in TC1 cells collected at the indicated time points after redaporfin‐PDT.
-
D, EViability of U2OS cells after treatment with redaporfin‐PDT, in the presence of Z‐VAD‐fmk (ZVAD; 50 μM). Scale bar: 20 μm.
-
F, GRepresentative images of U2OS cells stained for GALT1, 6 h after PDT with redaporfin (5 μM), in the presence or absence of ZVAD (50 μM) or PD150606 (40 μM) (C), and the analysis that reflects the average area of GALT1+ Golgi structures per cell (D). Scale bar: 20 μm.
-
H, IRepresentative images of calcium release evaluated by means of Fluo‐8‐AM in U2OS cells incubated with redaporfin (5 μM) for 20 h, with an additional incubation of 4 h with Toc (250 μM) or BAPTA‐AM (5 μM) (H), and its quantification based on Fluo‐8‐AM fluorescence (I). Scale bar: 10 μm.
-
J, KViability of U2OS cells after treatment with redaporfin‐PDT, in the presence of BAPTA (5 μM). Scale bar: 20 μm.Viability was assessed 6 h after irradiation by staining the cells with the vital dye propidium iodide (PI) and the chromatin dye Hoechst 33342. Cell death was quantified according to phenotypic groups divided into dying (Hoechstbright PI−) and dead cells (PI+ cells).
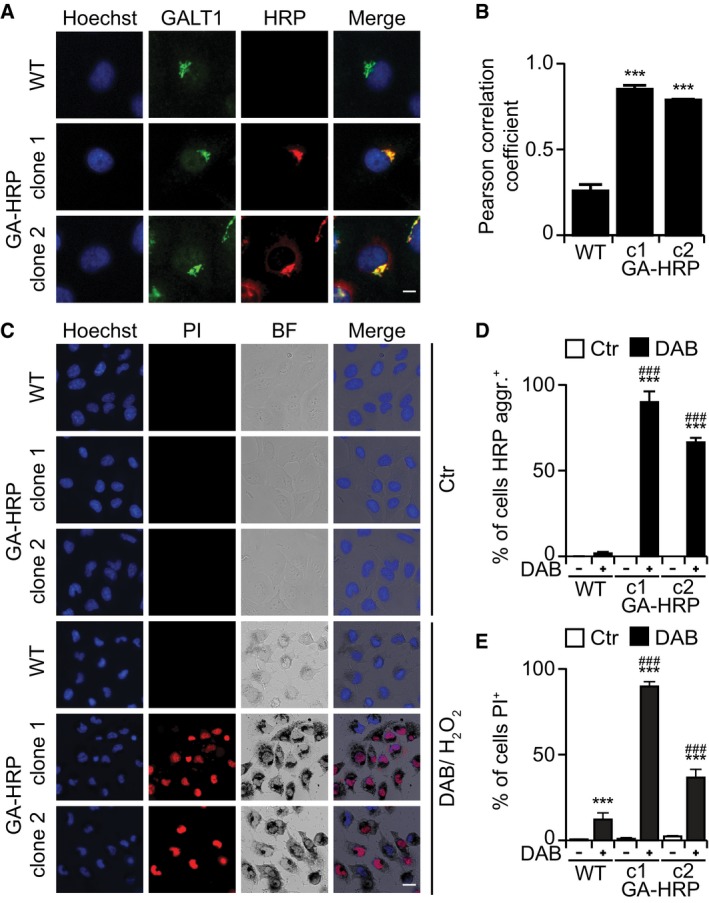
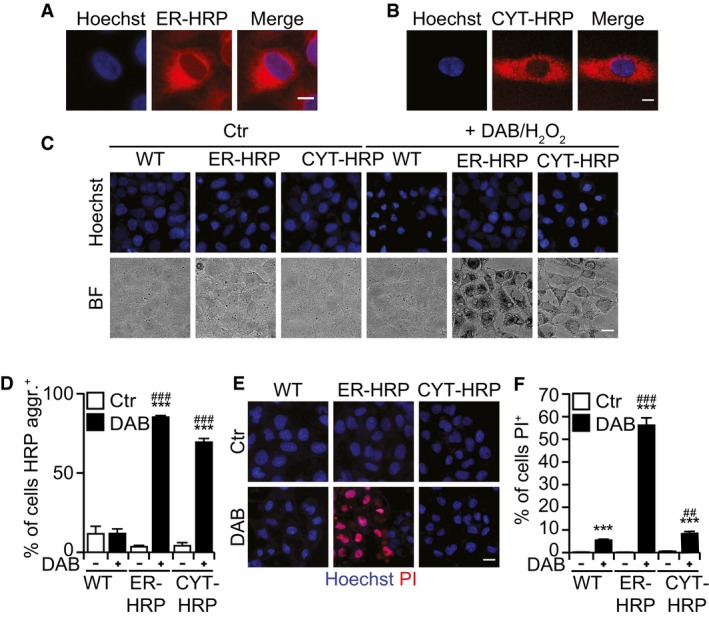
Collectively, these results suggest that redaporfin‐mediated PDT involves the local production of ROS causing toxic effects on the ER/GA that are relayed to mitochondria through the intrinsic pathway of apoptosis. Driven by this consideration, we asked whether organelle‐specific damage by ROS would be sufficient to kill cancer cells. To address this question, we targeted horseradish peroxidase (HRP) to distinct subcellular compartments and then treated the cells with a low H2O2 concentration (0.003%) and 3,3′‐diaminobenzidine (DAB). Importantly, when HRP was targeted to the GA by fusion with mannose II (and hence colocalized with GALT1; Jollivet et al, 2007; Fig 6A and B), it favored the oxidation and precipitation of DAB (which generates a brown pigment) and cell killing (Fig 6C–E). We also evaluated cells in which HRP was targeted either to the ER, by fusing it to CD74 (Fig EV5A), or to the cytosol (Fig EV5B). Although both HRP versions were functional and hence catalyzed DAB oxidation/precipitation in the presence of H2O2, only ER‐targeted (not cytosolic) HRP effectively sensitized cells to killing by low‐dose H2O2 (Fig EV5C–F). Hence, ROS‐mediated destruction of the ER and the GA is sufficient to cause cell killing.
Figure 6. Cytotoxicity of HRP‐dependent DAB polymerization occurring at the Golgi apparatus.
-
A, BTwo clones of U2OS cells that stably express HRP were stained for the GA marker GALT (A) showing extensive colocalization as determined by the Pearson correlation coefficient (B). Scale bar: 10 μm.
-
C–ECytotoxicity and DAB polymerization observed in U2OS‐GA‐HRP cells after treatment with DAB/H2O2 for 24 h at 37°C (C). Percentage of cells with DAB aggregates (D) and quantification of dead cells (PI+ cells) (E). DAB precipitates were observed by transmitted light microscopy, whereas cell viability was assessed by fluorescence microscopy upon double staining with PI and Hoechst. Scale bar: 20 μm.
Figure EV5. ER‐HRP and cytoplasmic HRP .
-
A, BCells that stably express HRP in the ER (A) or at cytoplasm (B). Scale bar: 10 μm.
-
C–FDAB polymerization after treatment with DAB/H2O2 for 24 h at 37°C (C), percentage of cells with DAB aggregates (D), and quantification of dead cells (PI+ cells) (E, F). Scale bar: 20 μm.
Redaporfin‐mediated PDT results in irreversible inhibition of conventional protein secretion
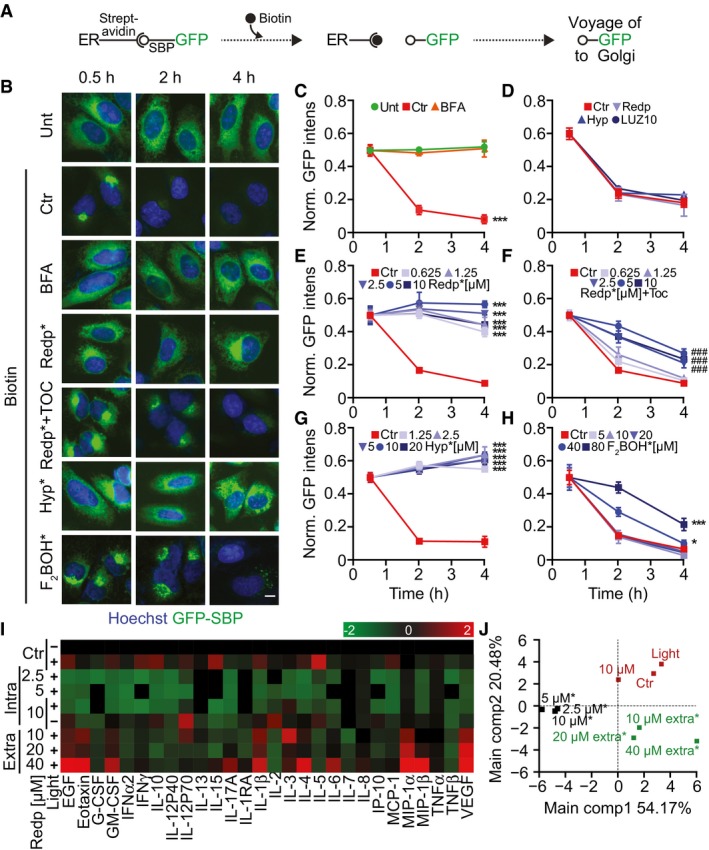
Given the role played by the ER/GA axis in mediating toxicity, we next investigated whether redaporfin might affect one of the most important ER/GA functions, which is the biosynthetic secretory pathway. For this, we took advantage of the retention using selective hooks (RUSH) system (Boncompain et al, 2012). In this system, streptavidin fused to a KDEL ER‐luminal localization signal was used as a hook to bind reversibly to a reporter protein containing a streptavidin‐binding peptide (SBP) fused to a GFP moiety (GFP‐SBP). At steady state, the hook retains the GFP‐tagged reporter in the ER through a SBP streptavidin–SBP interaction (Boncompain et al, 2012). Upon addition of biotin, which binds to streptavidin with subpicomolar affinity, the two proteins separate from each other (Fig 7A). The GFP‐SBP reporter proteins can undergo anterograde transport to the GA toward its target compartment (e.g., the plasma membrane). In this system, upon biotin addition, a soluble secretory protein like GFP‐SBP fused to a signal peptide first translocates and accumulates in a perinuclear structure positive for the GA marker GALT1 and then progressively disappears from the cell (Fig 7B and Appendix Fig S8). The transport of GFP‐SBP from the ER to the GA was suppressed by brefeldin A (BFA) used as a control, as well as by light‐exposed redaporfin (but not by redaporfin alone, without light; Fig 7B–E and Appendix Fig S8). Of note, this phototoxic effect was partially abolished by pretreatment of the cells with the antioxidant tocopherol (Fig 7B and F). Hypericin, a photosensitizer that targets the ER and GA (Ritz et al, 2008), induced similar inhibitory effects on exocytosis as did redaporfin (Fig 7B and G). In contrast, F2BOH, an analog of redaporfin that accumulates at the level of the lysosomes, failed to interfere with ER/GA function (Figs 7B and H, and EV1).
Figure 7. Redaporfin‐PDT inhibits anterograde transport.
-
ASchematic representation of the retention using selective hooks (RUSH) technology. In this system, streptavidin is linked to an ER protein (hook) that is retained in the ER compartment through its interaction with the streptavidin‐binding peptide attached to a GFP moiety (SBP‐GFP). Addition of biotin (which binds to streptavidin with high affinity) uncouples SBP‐GFP from the hook allowing its trafficking into the GA compartment and its final secretion into the extracellular milieu.
-
B–HU2OS‐KDEL‐SBP‐GFP cells treated with PDT by applying different photosensitizers: redaporfin, hypericin, and F2BOH. BFA (10 μg/ml) was included as positive control for the inhibition of secretion. Immediately after irradiation, biotin was added, and at 0.5, 2, and 4 h, GFP fluorescence intensity was evaluated by microscopy (B). GFP release was measured by means of the GFP fluorescence intensity normalized to the first time point and is shown for cells treated with BFA (C), photosensitizers without photoactivation (D), redaporfin‐PDT (E), redaporfin‐PDT in combination with the antioxidant Toc (F), hypericin‐PDT (G), and F2BOH‐PDT (H). Ctr represents untreated U2OS‐KDEL‐SBP‐GFP cells with biotin addition. Scale bar: 10 μm.
-
I, JU2OS cells were incubated with redaporfin at the indicated concentrations for 20 h followed by washing and irradiation. Alternatively, irradiation was performed immediately after addition of redaporfin to cells, thus generating ROS in the extracellular medium (extra*). For both protocols, supernatant was collected 6 h after irradiation and submitted to the simultaneous analysis of an array of cytokine/chemokine biomarkers by means of a bead‐based multiplex assay using the Luminex technology. Analysis was performed with R software. In the heat map, green and red values indicate inhibition or stimulation of secretion when compared to untreated cells.
We conclude from these experiments that PDT with redaporfin strongly affects ER/GA functions, thus paralyzing protein secretion. In accord with this interpretation, pretreatment of U2OS osteosarcoma cells with redaporfin, allowing its redistribution to the ER/GA compartments, followed by light exposure caused a major reduction in the spontaneous secretion of most cytokines. This contrasts with the mild (and sometimes even secretagogue‐like) effects of extracellular redaporfin exposed to light, yielding completely different effects on the secretome (Fig 7I and J). Altogether, these results confirmed the inhibitory effects of redaporfin‐based PDT on protein secretion.
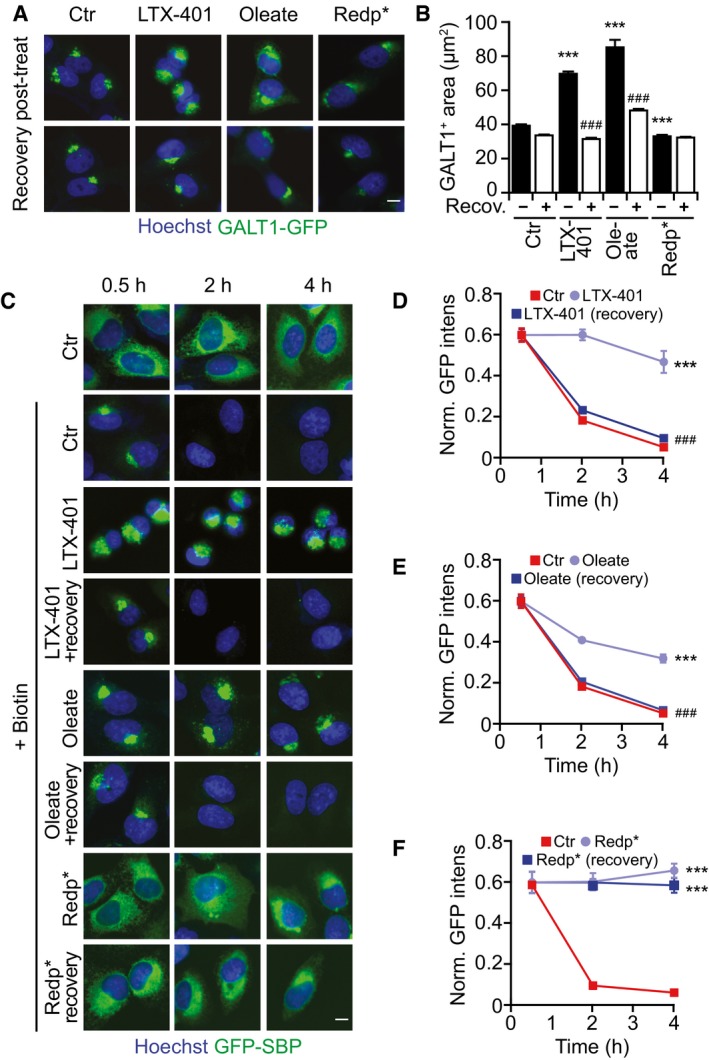
Recently, we reported that the natural fatty acid oleate, as well as the oncolytic compound LTX‐401, also targets the GA (Niso‐Santano et al, 2015; Zhou et al, 2016). Indeed, both oleate and LTX‐401 inhibited the protein secretion, as shown by the RUSH assay, though the mechanism seemed different than the one of redaporfin‐PDT. In the presence of oleate and LTX‐401, GFP‐SBP was still transported from the ER to the GA, upon biotin supplementation, yet then failed to exit the GA (Appendix Fig S7A–C). Treatment with the DNA‐targeted cytotoxicant mitoxantrone failed to affect the RUSH assay (Appendix Fig S7A and D), indicating that not every toxic agent interferes with this functional assay. Of note, contrasting with redaporfin‐based PDT, which induced a reduction in GALT1‐GFP signal (see above), both oleate and LTX‐401 caused an increase in GA volume as measured by GALT1 staining. This GA swelling was reversible as its surface area normalized within 4 h after washout of both oleate and LTX‐401. In stark contrast, the PDT‐induced enfeeblement of the GALT1‐GFP signal was not affected by washing out residual redaporfin (Fig 8A and B). Similarly, the effects on secretion induced by oleate or LTX‐401 were also reversed by washing out these agents, contrasting with the durable inhibition of the biotin‐ignited secretion of GFP‐SBP post‐PDT (Fig 8C–F).
Figure 8. GA damage and inhibition of anterograde transport after redaporfin‐PDT constitute an irreversible process.
-
A, BRecovery of GA morphology observed in U2OS‐GALT1‐GFP 3 h after extensive washing of cells treated with PDT with redaporfin (5 μM), LTX‐401 (7 μg/ml, 1 h), and oleate (500 μM, 6 h) (A), and its quantification that depicts the average area of GALT1+ Golgi structures per cell (B).
-
C–FRecovery of GA function evaluated by means of U2OS‐KDEL‐SBP‐GFP cells (C). Cells were treated with PDT with redaporfin (5 μM), LTX‐401 (10 μg/ml, 1 h), and oleate (500 μM, 6 h) followed by extensive washing. Four hours later, biotin was added and GFP release was measured for cells treated with redaporfin‐PDT (D), LTX‐401 (E), and oleate (F).
In conclusion, PDT interferes with GA function in an irreversible fashion, through a mechanism that differs from other GA‐perturbing agents.
Discussion
Redaporfin exemplifies a novel agent introduced into PDT of cancer. Remarkably, redaporfin distributes into specific compartments of the cell, namely ER and GA, yet largely spares other organelles including the nucleus, mitochondria, and lysosomes. Accordingly, upon photoactivation, redaporfin causes a selective depletion of ER‐ and GA‐specific proteins (but does not affect the abundance of the actin cytoskeleton nor that of mitochondrial proteins). Concomitantly, important morphological changes in the ER/GA compartment were detected by electron microscopy or by measuring the abundance and surface area of ER‐/GA‐specific proteins. These effects are secondary to ROS production because they can be largely prevented by the lipophilic antioxidant tocopherol. In accord with the alteration in ER/GA structure and the depletion of ER/GA proteins, PDT with redaporfin resulted in a dramatic disruption of ER/GA function leading to an irreversible inhibition of GA‐dependent protein secretion: Transport of model secretory cargos monitored by the RUSH assay was strongly reduced, and the secretion of endogenous cytokines by PDT‐treated cancer cells was blocked.
Redaporfin‐PDT triggered signs of ER stress, namely the phosphorylation of eIF2α, the nuclear translocation of ATF6, and the activation of the IRE1–XBP1 axis. Surprisingly, the phosphorylation of eIF2α was mediated by EIF2AK1, which constitutes an important difference to canonical ER stressors including the photosensitizer hypericin (in response to which the phosphorylation of eIF2α was mediated by EIF2AK3; Garg et al, 2012). The phosphorylation of eIF2α was accompanied by a decrease in protein translation and cytoprotection against redaporfin‐PDT, as EIF2AK1 KO cells were more sensitive to redaporfin‐PDT than their wild‐type counterparts. Despite the phosphorylation of eIF2α, neither the activation of ATF4 nor that of DDIT3 was observed. Similar findings were recently reported for different ICD drugs reinforcing the notion of the phosphorylation of eIF2α as an important ICD hallmark (Bezu et al, 2018). In line with this observation, other ICD hallmarks (such as the exposure of CALR, the secretion of ATP, and the exodus of HMGB1) were detected in response to redaporfin‐PDT and, more importantly, cells killed in vitro by redaporfin‐PDT were able to vaccinate mice against rechallenge with live cancer cells. In summary, the present data indicate that redaporfin‐PDT can be classified as an ICD inducer.
Cells that were treated with redaporfin‐based PDT manifested traits of the intrinsic pathway of apoptosis, as indicated by the translocation of cytosolic BAX to mitochondria and the mitochondrial release of the intermembrane protein SMAC, the partial dependency of cell killing on caspases, BAX, and BAK, and nuclear shrinkage. The observation that the knockout of BAX and BAK or pretreatment with protease inhibitors failed to interfere with the depletion of GA proteins upon redaporfin‐mediated PDT supports the notion that BAX/BAK‐regulated mitochondrial apoptosis operates downstream of the ER/GA compartment.
Surprisingly, two strategies to disperse the GA or to inhibit GA function (by means of brefeldin A or golgicide A) led to a reduction of cell killing by photoactivated redaporfin. Concomitantly, brefeldin A and golgicide A inhibited the mitochondrial translocation of BAX and the release of SMAC from mitochondria. This observation supports the idea that the phototoxic effects of redaporfin on cells involve a hierarchy of organellar perturbations in which ER/GA operates upstream of mitochondria. The exact molecular links that account for this hierarchical relationship are elusive, requiring further in‐depth investigation. Cells expressing ER‐ or GA‐targeted HRP and treated with DAB/H2O2 exhibited local DAB precipitation before they died, indicating that ER and/or GA perturbations are sufficient for cell killing, perhaps due to the perturbation of GA trafficking (Jollivet et al, 2007) and dynamics (Guizzunti & Seemann, 2016).
Importantly, the phototoxicity of redaporfin resembles the cytotoxic effects of LTX‐401 in its mechanisms. LTX‐401, a β‐amino acid derivative with no structural resemblance to redaporfin, specifically targets GA, causing its vacuolization and dispersion. Moreover, the capacity of LTX‐401 to permeabilize mitochondria and to kill cells is reduced upon pretreatment with brefeldin A (Zhou et al, 2016). Hence, LTX‐401 apparently activates a similar GA–mitochondrion axis as does PDT with redaporfin. Nonetheless, the effects of LTX‐401 and PDT on the GA are different with respect to their morphological impact, the interception of secretory pathways, and their duration. First, LTX‐401 causes GA dispersion, while PDT with redaporfin rather entails GA contraction as detectable by fluorescent biosensors. Second, LTX‐401 does not block the anterograde transport of secretory proteins from the ER to GA, while PDT does so. Third, washing out LTX‐401 from the system allows at least a fraction of the cells to recover normal GA morphology and to resume protein secretion, while PDT with redaporfin causes irreversible perturbation of GA structure and function. Oleate, which has a mild cytotoxic activity, essentially behaved like LTX‐401, exemplifying reversible GA dilatation and inhibition that was functionally undistinguishable from the oncolytic compound. In contrast, PDT with hypericin, a natural photosensitizer that also accumulates at the ER/GA compartment (Ritz et al, 2008), strongly resembled the phototoxicity of redaporfin in thus far that both PDTs were inhibiting ER/GA function in a similar fashion.
Most reports that involve GA in cell death signaling are dealing with neurodegenerative diseases (Passemard et al, 2017). For example, cultured neurons from the central nervous system or dorsal root ganglia degenerate while manifesting early cis‐GA abnormalities upon depletion of proteins involved in synaptic transmission (syntaxin‐1, Munc18‐1, SNAP‐25) (Santos et al, 2017). Similarly, specific removal of GA‐relevant proteins can precipitate neurodegeneration in mice (Liu et al, 2017). Systemic loss of neutral sphingomyelinase (SMPD3) can cause dwarfism with chondrodysplasia due to GA dysfunction that may be secondary to the altered metabolism of ceramide and diacylglycerol (Stoffel et al, 2016). Hypoxia reportedly compromises the survival and function of pancreatic β‐cells by ER‐to‐GA protein trafficking coupled to the depletion of proteins from the coatomer protein complex (COP1; Bensellam et al, 2016). Reportedly, GA contains anti‐apoptotic proteins such as Golgi anti‐apoptotic protein (GAAP) also known as TMBIM4 (transmembrane Bax (Bcl‐2‐associated X protein) inhibitor‐1 motif‐containing 4) that acts as an ion channel to affect Ca2+ homeostasis (Carrara et al, 2015). Theoretically, the depletion of such a protein might precipitate apoptosis. However, it appears that PDT causes a general rather than specific destruction of ER/GA proteins, making it difficult to link PDT to death via the reduction of one or few molecules. Indeed, it is tempting to speculate that the irreversible inactivation of vital organelles such as the ER or GA may cause cell death by multiple redundant pathways rather than one single cascade of molecular events. The activation of the mitochondrial pathway of apoptosis is one of these pathways. However, even the double inactivation of BAX and BAK, caspase inhibition with Z‐VAD‐fmk, and calcium chelation with BAPTA‐AM were unable to fully prevent cell death, supporting the concept of redundancy in lethal signaling.
Altogether, this work underscores a novel effect of PDT that involves the irreversible inactivation of ER/GA compartments. Whether the consequent inhibition of trophic (and potentially pro‐carcinogenic and pro‐metastatic) factors may contribute to the therapeutic efficacy of PDT remains an open possibility.
Materials and Methods
Cell culture and reagents
Human osteosarcoma U2OS, U2OS biosensor cells (GALT1‐GFP, CALR‐GFP, GFP‐ATF4, GFP‐ATF6, XBP1‐ΔDBD‐Venus (XBP1‐GFP), BAX‐GFP, SMAC‐GFP), TC1, HeLa, A549, and HCT116 were cultured in Dulbecco's modified Eagle's medium (Thermo Fisher Scientific, Carlsbad, CA, USA) supplemented with 10% fetal bovine serum (Gibco® by Life Technologies), 1% non‐essential amino acids (Thermo Fisher Scientific), 1% HEPES (Thermo Fisher Scientific), and 1% penicillin/streptomycin (Thermo Fisher Scientific) in a humidified incubator with 5% CO2 at 37°C. Redaporfin (LUZ11) and F2BOH were provided by Luzitin SA (Coimbra, Portugal). LTX‐401 was from Lytix Biopharma (Tromsø, Norway) and oleate from Larodan (Solna, Sweden). Hypericin (≥ 85% purity, H9252), tunicamycin (T7765), thapsigargin (T9033), mitoxantrone (M6545), brefeldin A (B6542), quinacrine (Q3251), tocopherol (T3251), menadione (M5625), cycloheximide (C4859), 3,3′‐diaminobenzidine (D5905), and H2O2 solution (H1009) were purchased from Sigma‐Aldrich (St Louis, MO, USA), and golgicide A was from Tocris Bioscience (Bristol, UK). Primary antibodies against CALR (ab2907), TOMM20 (ab78547), GBF1 (ab86071), GM130 (ab52649), ERp57 (ab10287), and actin‐HRP (ab49900) were purchased from Abcam (Cambridge, UK). Antibodies for PERK (3192S), P‐eIF2α (Ser51) (ab32157), eIF2α (9722S), and P‐histone H2AX (9720) came from Cell Signaling Technology (Danvers, MA, USA) and the antibody against B4GALT1 (PAB20512) from Abnova (Taipei, Taiwan). Secondary Alexa Fluor® 488‐ or 647‐labeled antibodies and the chemical dyes Hoechst 33342, MitoTracker® Green, and CellROX® Green are from Life Technologies (Carlsbad, CA, USA).
Assessment of redaporfin subcellular accumulation
The subcellular distribution of redaporfin was monitored by assessing its autofluorescence at 750 nm (Arnaut et al, 2014). U2OS cells or U2OS biosensors stably expressing GALT1‐GFP or CALR‐GFP were seeded in 96‐well plates (Greiner Bio‐One, Kremsmünster, Austria). After 24 h, cells were incubated with redaporfin for an additional 20 h, followed by washing three times. Mitochondrial staining was performed in U2OS cells by incubating cells with 100 nM MitoTracker® Green for 1 h at 37°C. Then, the nucleus was counterstained with 4 μM Hoechst 33342 for 15 min at 37°C, cells were washed three times with PBS, and images were immediately acquired. Lysosomes were visualized by staining cells with 5 μM of quinacrine and 4 μM Hoechst 33342 in Krebs–Ringer solution (125 mM NaCl, 5 mM KCl, 1 mM MgSO4, 0.7 mM KH2PO4, 2 mM CaCl2, 6 mM glucose, and 25 mM HEPES, pH 7.4), for 30 min at 37°C. Thereafter, cells were rinsed in Krebs–Ringer solution and images were immediately acquired. For the biosensor cell lines U2OS‐GALT1‐GFP and U2OS‐CALR‐GFP, cells were fixed with paraformaldehyde (PFA) 3.7% (w/v) in PBS supplemented with Hoechst 33342 (2 μM), at room temperature (RT), for 45 min. Upon fixation, PFA was substituted with PBS and analysis was performed by fluorescence microscopy. Images were acquired using an ImageXpress Micro XL automated bioimaging system (Molecular Devices, Sunnyvale, CA, USA) equipped with a PlanApo 20X/0.75 NA objective (Nikon, Tokyo, Japan). Pearson correlation coefficient was determined by means of a colocalization algorithm previously developed in R software (Sauvat et al, 2017).
Subcellular fractionation
U2OS cells were seeded in 175‐cm2 flasks (Greiner Bio‐One) and allowed to adapt for 24 h. Thereafter, the cells were incubated with redaporfin for an additional 20 h, rinsed thrice with cold PBS (pH 7.4), collected with a cell scraper in harvesting buffer (PBS, pH 7.4; 1 mM HEPES; 1 mM EDTA), and centrifuged at 800 g for 5 min. The obtained pellet was submitted to specific protocols for the extraction of mitochondria, ER, or GA fractions.
For mitochondrial isolation (Hangen et al, 2015), the pellet was resuspended in harvesting buffer, subjected to 10‐min incubation on ice, and subsequently ground 100 times on ice using a Dounce homogenizer and centrifuged at 700 g for 10 min. The supernatant was recovered and centrifuged at 10,000 g for 30 min to obtain the cytosolic fraction. The pellet was further washed with ice cold PBS and centrifuged for 5 min at 450 g. After centrifugation, the pellet was resuspended in 1 ml of cold isolation buffer B (75 mM sucrose; 20 mM HEPES; 225 mM mannitol; 0.5 mM EDTA, pH 7.2), placed on ice and ground 100 times using a Dounce homogenizer, and then centrifuged at 750 g for 20 min. The supernatant was re‐centrifuged at 10,000 g for 10 min to obtain the mitochondrial pellet, which was solubilized in water.
The Golgi fraction was obtained by means of the Golgi isolation kit (GL 0010‐1KT) from Sigma‐Aldrich according to the manufacturer's instructions with slight adaptations. Briefly, the cell pellet was resuspended in 0.25 M sucrose and subsequently homogenized with a Dounce homogenizer and then centrifuged at 3,000 g for 15 min. The sucrose concentration was then adjusted to 1.25 M by adding 2.3 M sucrose solution. In an ultracentrifuge tube, a discontinuous gradient of sucrose was carefully built in the following order of sucrose concentration: 1.84 M, 1.25 M (sample), 1.1 M, and 0.25 M. The tubes were centrifuged at 120,000 g for 3 h at 4°C in an Optima Max‐XP ultracentrifuge (Beckman Coulter, Brea, CA, USA), and the Golgi fraction was collected at the 1.1 M/0.25 M sucrose interphase.
ER‐enriched fractions were obtained by using the ER isolation kit (ER 0100‐1KT) from Sigma‐Aldrich according to the manufacturer's instructions. Briefly, the cell pellet was resuspended in extraction buffer (10 mM HEPES, 250 mM sucrose, 25 mM potassium chloride, 1 mM EGTA, pH 7.8) provided by the kit and subsequently homogenized with a Dounce homogenizer followed by a first centrifugation at 1,000 g for 10 min and a second at 12,000 g for 15 min in order to remove nuclei, cell debris, mitochondria, and lipids. The supernatant fraction was then centrifuged at 100,000 g for 60 min at 4°C in an Optima Max‐XP ultracentrifuge (Beckman Coulter). The pellet containing ER was resuspended in the extraction buffer, and full dissolution was attained with the help of a Dounce homogenizer.
The purity of each fraction was tested by immunoblotting of organelle‐specific proteins, namely TOMM20 for mitochondria, B4GALT1 for GA, and CALR for ER.
Western blot analysis
Cells were harvested and the obtained pellet was resuspended in RIPA buffer (89900; Thermo Fisher Scientific) supplemented with phosphatase and protease inhibitors (88669; Thermo Fisher Scientific) followed by sonification. Protein content was measured by DC™ Protein Assay kit (5000112; Bio‐Rad, Hercules, CA, USA), and 20 μg of protein was mixed with NuPAGE® LDS sample buffer 4× and NuPAGE® sample reducing agent 10× (NP0008 and NP 0009; Life Technologies) followed by denaturation at 100°C for 10 min. Proteins were separated by polyacrylamide gel electrophoresis (PAGE) using 4–12% Bis‐Tris precast gels (Life Technologies) in MES running buffer (Life Technologies) and then transferred to polyvinylidene difluoride (PVDF) membrane (Merck Millipore, Billerica, Massachusetts, US) using a Tris–glycine buffer (Life Technologies) with 20% of ethanol. In order to reduce unspecific binding, membranes were incubated for 1 h with a mixture of Tris‐buffered saline (TBS; Life Technologies) and Tween‐20 (0.1%) (Sigma‐Aldrich) supplemented with 5% of bovine serum albumin (BSA) (Euromedex, Souffelweyersheim, France). Membranes were then incubated with the primary antibody overnight at 4°C followed by incubation with the appropriate secondary antibody conjugated to horseradish peroxidase (Southern Biotech, Birmingham, AL, USA) for 1 h at room temperature. After washing, proteins were revealed with ECL (GE Healthcare Life Sciences, Chicago, IL, USA). Chemiluminescence images were acquired with an ImageQuant LAS 4000 imaging system (GE Healthcare Life Sciences, Chicago, IL, USA). Beta‐actin was used for loading control. Densitometry analysis was carried out using Quantity One software (Bio‐Rad), and data are presented after normalization to untreated cells.
High‐pressure liquid chromatography (HPLC)–UV detection of redaporfin on organelle‐enriched fractions
A RRLC 1260 system coupled to a diode array detector, G1315C (Agilent Technologies, Santa Clara, CA, USA), was used for HPLC‐UV analysis. Briefly, 5 μl of each subcellular fraction was injected into a Zorbax Eclipse Plus C18 column (100 mm × 2.1 mm, particle size 1.8 μm) protected by a XDB‐C18 guard column (5 mm × 2.1 mm, particle size 1.8 μm) and heated at 40°C. The flow rate was set to 0.3 ml/min, and a mobile phase gradient of water with acetic acid (AC; Sigma‐Aldrich) and acetonitrile (AN; Sigma‐Aldrich) was used that included an initial step of 1 min in 80% AC and 20% AN followed by a gradual increase in AN until 95%. Redaporfin was detected at a wavelength of 750.16 nm with two additional measurements, at 300.16 nm and 550.16 nm, used as qualifiers. A diode array detector was used to acquire complete UV spectra, and spectrum from pure compound was used as reference. Area integration of the peak attained at 750.16 nm (registered approximately at 15 min) was done with the software MassHunter Qualitative Analysis B.07.00 (Agilent Technologies).
Photodynamic therapy
U2OS or the U2OS biosensor cell lines were seeded into black 96‐well plates (Greiner Bio‐One) and allowed to adapt for 24 h. Cells were then incubated with the photosensitizers redaporfin, F2BOH, or hypericin in the concentration range of 0.313–10 μM (0.07–2.2 μg), 1.25–40 μM (0.27–8.7 μg), and 0.313–10 μM (0.03–1 μg), respectively. After 20 h of incubation, cells were washed and the photosensitizers were activated with adequate light sources. Redaporfin (LUZ11) and F2BOH (LUZ10) photoactivation was performed at 750 nm with a light‐emitting diode (LED) from Marubeni (model L740‐66‐60‐550). A light dose (LD) of 0.075 J/cm2 or 1.2 J/cm2 was delivered, respectively, to redaporfin and F2BOH, with the exception of viability studies in which a LD of 0.2 J/cm2 (redaporfin) and 2 J/cm2 (F2BOH) was applied. Hypericin photoactivation was carried out with a GU10 LED, 1.5W 220–240 V, covered with a filter that results in a peak at 583 nm. A LD of 0.3 J/cm2 was delivered. Untreated cells, cells incubated with the photosensitizer (at the highest tested concentration) without photoactivation, and cells submitted to light (in the absence of the photosensitizer) were included in all experiments as negative controls. All inhibitors such as tocopherol (Toc; 250 μM), brefeldin A (BFA; 5 μg/ml), golgicide A (GCA; 5 μM), Z‐VAD‐fmk (ZVAD; 50 μM), or PD150606 (PD; 40 μM) were added to the cells for an additional period of 4 h before cell irradiation and let presented until the end of the assay. The ability of Toc to protect ER/GA compartments from PDT‐induced ROS was evaluated in cells co‐incubated with redaporfin and Toc (1 mM) for 20 h. Afterward, cells were irradiated, and 6 h later, ER and GA proteins were evaluated by immunoblot as mentioned above.
For viability studies, U2OS, A549, HeLa, or HCT116 cells, incubated for 6 h post‐irradiation (0.2 J/cm2), were double‐stained with the vital dye propidium iodide (0.5 μg/ml) and the chromatin dye Hoechst 33342 (2.5 μg/ml) for 20 min followed by immediate live cell acquisition (Senovilla et al, 2017). All tested biosensor cell lines were fixed, 6 h post‐irradiation, with paraformaldehyde (PFA) 3.7% (w/v) in PBS supplemented with Hoechst 33342 (2 μM), at RT for 45 min. Upon fixation, PFA was rinsed with PBS and analysis was performed by fluorescence microscopy by means of an ImageXpress Micro XL automated bioimager (Molecular Devices) equipped with a PlanApo 20X/0.75 NA objective (Nikon). A minimum of four images were taken per well.
Treatment with LTX‐401
Cells were seeded into black 96‐well plates. Twenty‐four hours later, cells were incubated with LTX‐401 diluted in complemented medium. Of note, the presence of serum partially decreased the toxicity of LTX‐401, which allowed to study its effects on Golgi morphology.
Immunofluorescence staining
Six hours after PDT treatment, cells were fixed in PFA 3.7% (w/v) in PBS containing 2 μM Hoechst 33342, for 45 min at RT. Then, cells were permeabilized using 0.1% Triton in PBS for 5 min at RT. Unspecific binding was reduced by incubating cells with 2.5% BSA in PBS for 30 min at RT followed by incubation with the primary antibody overnight at 4°C. Afterward, cells were rinsed three times with PBS and further incubated with Alexa Fluor®‐coupled secondary antibody (AF488 or AF647) for 1.5 h at RT (Pietrocola et al, 2015). After washing three times with PBS, images were acquired using an ImageXpress Micro XL automated bioimager (Molecular) equipped with a PlanApo 20X/0.75 NA objective (Nikon). A minimum of four images were taken per well.
Transmission electron microscopy
U2OS cells (2 × 10⁶) were seeded in petri dishes (Greiner Bio‐One) and let to adapt for 24 h. Redaporfin (5 μM) was added and photoactivation was performed as mentioned above. Six hours later, cells were fixed in 1.6% glutaraldehyde (v/v in 0.1 M phosphate buffer) for 1 h, collected by scraping from the petri dish, and centrifuged, and the pellet was post‐fixed with 1% osmium tetroxide (w/v in 0.1 M phosphate buffer) for 2 h. Following dehydration through a graded ethanol series, cells were embedded in Epon™ 812 and ultrathin sections were stained with standard uranyl acetate and lead citrate (Fortunato et al, 2016). Images were acquired using a Tecnai 12 electron microscope (FEI, Eindhoven, the Netherlands).
CRISPR‐mediated gene editing
U2OS cells were seeded in 6‐well plates and let to adapt for 24 h. Cells were then transfected by means of Lipofectamine with CRISPR plasmids (Sigma, 5U6gRNA‐Cas9‐2A‐RFP) specific for each eIF2α kinase, namely EIF2AK1, EIF2AK2, EIF2AK3, and EIF2AK4. Red fluorescent protein (RFP)‐positive clones were generated by single‐cell sorting using a FACSARIA III cytofluorometer (Becton Dickinson, San José, CA, USA). Validation of clones was performed by immunoblot using specific antibodies for each kinase.
Evaluation of protein translation
U2OS cells were seeded in black 96‐well plates and let to adapt for 24 h. Redaporfin was then added to cells and incubated for 20 h followed by washing with methionine‐free DMEM with dialyzed FBS and 30 min of incubation with Click‐iT® AHA (L‐azidohomoalanine) reagent (Invitrogen, C10289) diluted in the same medium. At 0.5, 3, or 6 h after irradiation, cells were fixed with 3.7% PFA containing 2 μM Hoechst 33342 followed by blocking with 3% BSA and permeabilization with 0.1% Triton X‐100. Incubation with Click‐iT® reaction cocktail that contains Alexa Fluor® 488 alkyne was then performed during 30 min followed by wash and image acquisition. Cycloheximide (50 μM) was included as positive control of inhibition of protein synthesis.
Anticancer vaccination experiments
Anticancer vaccination experiments were performed by killing TC1 cells in vitro with redaporfin (5 or 10 μM)‐mediated PDT as mentioned above. One and a half hours post‐irradiation, TC1 cells (500,000) were injected into the left flank of immunocompetent C57/BL6 mice. One week later, mice were rechallenged with untreated, live TC1 cells (250,000), on the opposite flank. Control animals were vaccinated with an equivalent volume of PBS. Tumor incidence was routinely monitored thereafter. All mice were kept in a pathogen‐free, environmentally controlled animal facility with 12‐h light/dark cycles and had food and water ad libitum. All animal experiments were performed in compliance with the EU Directive 63/2010 and specific ethic protocol (Protocol 2354‐2015102013453410 v2 that was approved by the Ethical Committee of the Gustave Roussy Campus Cancer, CEEA IRCIV/IGR no. 26, registered at the French Ministry of Research). Six‐ to eight‐week‐old female wild‐type C57BL/6 mice were obtained from ENVIGO France (Gannat, France).
Organelle‐targeted horseradish peroxidase (HRP)
U2OS or HeLa cells were seeded in 6‐well plates and let to adapt for 24 h. Cells were then transfected by means of Lipofectamine with plasmids coding for HRP coupled with a signal sequence for GA (mannosidase II, ManII) or ER (CD74; Jollivet et al, 2007). pCD74‐HRP (ER‐HRP) was generated by ligating a PCR product amplifying CD74 into the restriction sites EcoRI and AgeI of pManII‐HRP, thereby replacing ManII. The same restriction sites were used to excise ManII from pManII‐HRP, and by blunting and re‐annealing, pHRP was generated (cyt‐HRP).
Transfected cells were selected for 2 weeks under the continuous presence of geneticin (G418, 1 mg/ml). Clones were generated by single‐cell sorting by means of a FACSARIA III cytofluorometer (Becton Dickinson). HRP‐positive clones were selected by immunofluorescence staining based on the colocalization of HRP with the targeted organelle, namely GA (GALT1 staining) or ER (CALR staining). Cross‐linking of the targeted organelle was achieved by incubating cells with 3,3′‐diaminobenzidine (DAB, 0.3 mg/ml) in the presence of H2O2 (0.003%) for 24 h at 37°C. DAB precipitates were assessed by transmitted light microscopy, whereas cell viability was assessed by fluorescence microscopy upon staining with PI and Hoechst.
Clonogenic assay
U2OS cells were treated by redaporfin‐PDT in 96‐well plates as previously described. Cells were then detached with 100 μl trypsin, and 1,000 cells of each condition were transferred to 6‐well plates and were incubated under normal culture conditions for 7 days. Colonies were then fixed and stained with crystal violet staining solution according to standard procedures before counting using the freely available software ImageJ (https://imagej.nih.gov/ij/).
Evaluation of retrograde protein transport through the retention using selective hooks (RUSH) system
U2OS cells were firstly transduced with lentiviral particles coding for the ER‐hook comprising streptavidin (Strep) fused to KDEL‐neo (ER‐luminal localization signal). U2OS‐KDEL‐Strep clones were selected by G418 (0.5 mg/ml), and validation was carried out by immunostaining with an anti‐streptavidin antibody (Santa Cruz, sc‐52234). Then, the reporter plasmid that contains a model secretory protein composed of a signal peptide and streptavidin‐binding peptide (SBP) fused to an EGFP moiety (pCDH‐ER‐SBP‐GFP) was stably introduced into the previously selected U2OS‐KDEL‐Strep cells also by means of lentiviral transduction. U2OS‐KDEL‐SBP‐GFP clones were then selected by G418 and 0.25 mg/ml hygromycin B (Invivogen, San Diego, CA, USA) and further validated by immunostaining with anti‐streptavidin antibody before and after biotin (40 μM) addition. Biotin triggers the release of the SBP‐GFP from the hook and allows its anterograde transport from the ER to the GA before its secretion to the extracellular milieu. U2OS‐KDEL‐SBP‐GFP cells were treated by PDT using the photosensitizers redaporfin, hypericin, or F2BOH as previously described. Cells were also treated with LTX‐401 for 1 h and oleate for 3 h at several concentrations. Positive and negative controls included BFA and MTX, which were used at several concentrations for 2 and 6 h, respectively. Following the treatment (without removing the toxic agents), biotin (40 μM) was added to U2OS‐KDEL‐SBP‐GFP cells, and 0.5 h, 2 h, and 4 h later, cells were fixed with PFA 3.7% (w/v) in PBS containing 2 μM Hoechst 33342, for 45 min at RT. Cells were then rinsed with PBS and images were acquired. Golgi recovery experiments were conducted by treating the biosensor cells U2OS‐GALT1‐GFP and U2OS‐KDEL‐SBP‐GFP with redaporfin‐PDT, LTX‐401, and oleate as mentioned above. In order to remove the toxic agents, cells were washed extensively and then kept under normal culture conditions for an additional 4 h. Afterward, U2OS‐GALT1‐GFP cells were fixed and biotin was added to U2OS‐KDEL‐SBP‐GFP cells as previously described.
Quantification of cytokines
U2OS cells were treated with redaporfin‐PDT as mentioned before. Alternatively, cells were submitted to light irradiation immediately after addition of redaporfin. The latter protocol is expected to generate ROS extracellularly, at the level of the cell culture medium, and not at the ER/Golgi compartments. For both protocols, supernatant was collected 6 h after irradiation and submitted to the simultaneous analysis of an array of cytokine/chemokine biomarkers by means of a bead‐based multiplex assay, Milliplex® Map Kit (Merck Millipore), according to the manufacturer's instructions. Briefly, 25 μl of each sample, standards and controls were added to one plate, followed by addition of antibody‐fluorescently labeled beads and overnight incubation at 4°C. Wells were then washed and detection antibodies provided by the kit were added for 1 h at RT following the addition of streptavidin–phycoerythrin, for 30 min at RT. Finally, wells were washed and immediately read on a FlexMap 3D (Thermo Fisher Scientific). Data were analyzed using R software (https://cran.r-project.org/). The average of triplicates was calculated resulting in a data set of 28 parameters for nine conditions. This set was then centered and scaled to unit variance and subjected to principal component analysis (PCA), from which four uncorrelated linear combinations were kept, explaining 90% of total inertia. An automated clustering was thereafter performed on these four main components using the K‐means method.
Image and statistical analyses
Image segmentation and analysis were performed with the MetaXpress® software (Molecular Devices). Dead cells and debris were excluded from the analysis by using R software. Graphs were built with R software or with GraphPad Prism, and data are presented as mean ± SD (or SEM if mentioned). Statistical analyses were performed using one‐ or two‐way ANOVA with GraphPad Prism.
Author contributions
LCGS performed and analyzed the experiments. LZ, PL, FL, and GB designed and developed the RUSH cell line. LB created U2OS cells KO for eIF2α kinases. HZ and SD contributed to the detection of redaporfin in organelle fractions. FP and FL designed the constructs used for the RUSH and HRP‐based assays. AS developed the R scripts used for analysis. AS and ML developed the colocalizer software used for PCC determinations. LCGS and LM created the HRP cell lines. SS performed electron microscopy. ØR and BS provided LTX‐401. LGA, OK, and GK designed the study. OK and GK wrote the paper.
Conflict of interest
BS and ØR are full‐time employees of Lytix Biopharma, and this study was partially funded by Lytix Biopharma.
Supporting information
Appendix
Expanded View Figures PDF
Review Process File
Acknowledgments
Luzitin SA provided redaporfin and F2BOH. Fábio Scharberle, Kariman Chaba, and Wei Xi provided technical assistance with the light sources, Luminex device, and Western blots, respectively. LCGdS is supported by Portuguese Science Foundation (ref. SFRH/BPD/93562/2013). HZ and PL are supported by the Chinese Scholarship Council. LZ is supported by the Ligue contre le Cancer. GK is supported by the Ligue contre le Cancer (équipe labelisée); Agence National de la Recherche (ANR)—Projets blancs; ANR under the frame of E‐Rare‐2, the ERA‐Net for Research on Rare Diseases; Association pour la recherche sur le cancer (ARC); Cancéropôle Ile‐de‐France; Institut National du Cancer (INCa); Institut Universitaire de France; Fondation pour la Recherche Médicale (FDM20140630126 and FDM 40739); the European Commission (ArtForce); the European Research Council (ERC); the LeDucq Foundation; the LabEx Immuno‐Oncology; the RHU Torino Lumière, the SIRIC Stratified Oncology Cell DNA Repair and Tumor Immune Elimination (SOCRATE); the SIRIC Cancer Research and Personalized Medicine (CARPEM); and the Paris Alliance of Cancer Research Institutes (PACRI). FP is supported by the Centre National de la Recherche Scientifique (CNRS), the Institut Curie, and the LabEx CelTisPhyBio (ANR‐10‐LBX‐0038 part of the IDEX PSL no. ANR‐10‐IDEX‐0001‐02).
The EMBO Journal (2018) 37: e98354
Contributor Information
Oliver Kepp, Email: captain.olsen@gmail.com.
Guido Kroemer, Email: kroemer@orange.fr.
References
- Agostinis P, Berg K, Cengel KA, Foster TH, Girotti AW, Gollnick SO, Hahn SM, Hamblin MR, Juzeniene A, Kessel D, Korbelik M, Moan J, Mroz P, Nowis D, Piette J, Wilson BC, Golab J (2011) Photodynamic therapy of cancer: an update. CA Cancer J Clin 61: 250–281 [DOI] [PMC free article] [PubMed] [Google Scholar]
- Allison RR, Sibata CH (2010) Oncologic photodynamic therapy photosensitizers: a clinical review. Photodiagn Photodyn Ther 7: 61–75 [DOI] [PubMed] [Google Scholar]
- Arnaut LG, Pereira MM, Dabrowski JM, Silva EF, Schaberle FA, Abreu AR, Rocha LB, Barsan MM, Urbanska K, Stochel G, Brett CM (2014) Photodynamic therapy efficacy enhanced by dynamics: the role of charge transfer and photostability in the selection of photosensitizers. Chemistry 20: 5346–5357 [DOI] [PubMed] [Google Scholar]
- Bensellam M, Maxwell EL, Chan JY, Luzuriaga J, West PK, Jonas JC, Gunton JE, Laybutt DR (2016) Hypoxia reduces ER‐to‐Golgi protein trafficking and increases cell death by inhibiting the adaptive unfolded protein response in mouse beta cells. Diabetologia 59: 1492–1502 [DOI] [PubMed] [Google Scholar]
- Bezu L, Sauvat A, Humeau J, Gomes‐da‐Silva LC, Iribarren K, Forveille S, Garcia P, Zhao L, Liu P, Zitvogel L, Senovilla L, Kepp O, Kroemer G (2018) eIF2alpha phosphorylation is pathognomonic for immunogenic cell death. Cell Death Differ https://doi.org/10.1038/s41418-017-0044-9 [DOI] [PMC free article] [PubMed] [Google Scholar]
- Boncompain G, Divoux S, Gareil N, de Forges H, Lescure A, Latreche L, Mercanti V, Jollivet F, Raposo G, Perez F (2012) Synchronization of secretory protein traffic in populations of cells. Nat Methods 9: 493–498 [DOI] [PubMed] [Google Scholar]
- Carrara G, Saraiva N, Parsons M, Byrne B, Prole DL, Taylor CW, Smith GL (2015) Golgi anti‐apoptotic proteins are highly conserved ion channels that affect apoptosis and cell migration. J Biol Chem 290: 11785–11801 [DOI] [PMC free article] [PubMed] [Google Scholar]
- Cole NB, Sciaky N, Marotta A, Song J, Lippincott‐Schwartz J (1996) Golgi dispersal during microtubule disruption: regeneration of Golgi stacks at peripheral endoplasmic reticulum exit sites. Mol Biol Cell 7: 631–650 [DOI] [PMC free article] [PubMed] [Google Scholar]
- Dabrowski JM, Arnaut LG (2015) Photodynamic therapy (PDT) of cancer: from local to systemic treatment. Photochem Photobiol Sci 14: 1765–1780 [DOI] [PubMed] [Google Scholar]
- Duden R, Griffiths G, Frank R, Argos P, Kreis TE (1991) Beta‐COP, a 110 kd protein associated with non‐clathrin‐coated vesicles and the Golgi complex, shows homology to beta‐adaptin. Cell 64: 649–665 [DOI] [PubMed] [Google Scholar]
- Fortunato F, Hackert T, Buchler MW, Kroemer G (2016) Retrospective electron microscopy: preservation of fine structure by freezing and aldehyde fixation. Mol Cell Oncol 3: e1251382 [DOI] [PMC free article] [PubMed] [Google Scholar]
- Galluzzi L, Kepp O, Kroemer G (2012) Enlightening the impact of immunogenic cell death in photodynamic cancer therapy. EMBO J 31: 1055–1057 [DOI] [PMC free article] [PubMed] [Google Scholar]
- Galluzzi L, Buque A, Kepp O, Zitvogel L, Kroemer G (2017) Immunogenic cell death in cancer and infectious disease. Nat Rev Immunol 17: 97–111 [DOI] [PubMed] [Google Scholar]
- Garg AD, Krysko DV, Verfaillie T, Kaczmarek A, Ferreira GB, Marysael T, Rubio N, Firczuk M, Mathieu C, Roebroek AJ, Annaert W, Golab J, de Witte P, Vandenabeele P, Agostinis P (2012) A novel pathway combining calreticulin exposure and ATP secretion in immunogenic cancer cell death. EMBO J 31: 1062–1079 [DOI] [PMC free article] [PubMed] [Google Scholar]
- Garg AD, Galluzzi L, Apetoh L, Baert T, Birge RB, Bravo‐San Pedro JM, Breckpot K, Brough D, Chaurio R, Cirone M, Coosemans A, Coulie PG, De Ruysscher D, Dini L, de Witte P, Dudek‐Peric AM, Faggioni A, Fucikova J, Gaipl US, Golab J et al (2015) Molecular and translational classifications of damps in immunogenic cell death. Front Immunol 6: 588 [DOI] [PMC free article] [PubMed] [Google Scholar]
- Garg AD, Vandenberk L, Koks C, Verschuere T, Boon L, Van Gool SW, Agostinis P (2016) Dendritic cell vaccines based on immunogenic cell death elicit danger signals and T cell‐driven rejection of high‐grade glioma. Sci Transl Med 8: 328ra327 [DOI] [PubMed] [Google Scholar]
- Guizzunti G, Seemann J (2016) Mitotic Golgi disassembly is required for bipolar spindle formation and mitotic progression. Proc Natl Acad Sci USA 113: E6590–E6599 [DOI] [PMC free article] [PubMed] [Google Scholar]
- Hangen E, Feraud O, Lachkar S, Mou H, Doti N, Fimia GM, Lam NV, Zhu C, Godin I, Muller K, Chatzi A, Nuebel E, Ciccosanti F, Flamant S, Benit P, Perfettini JL, Sauvat A, Bennaceur‐Griscelli A, Ser‐Le Roux K, Gonin P et al (2015) Interaction between AIF and CHCHD4 regulates respiratory chain biogenesis. Mol Cell 58: 1001–1014 [DOI] [PubMed] [Google Scholar]
- Jollivet F, Raposo G, Dimitrov A, Sougrat R, Goud B, Perez F (2007) Analysis of de novo Golgi complex formation after enzyme‐based inactivation. Mol Biol Cell 18: 4637–4647 [DOI] [PMC free article] [PubMed] [Google Scholar]
- Kepp O, Senovilla L, Vitale I, Vacchelli E, Adjemian S, Agostinis P, Apetoh L, Aranda F, Barnaba V, Bloy N, Bracci L, Breckpot K, Brough D, Buque A, Castro MG, Cirone M, Colombo MI, Cremer I, Demaria S, Dini L et al (2014) Consensus guidelines for the detection of immunogenic cell death. Oncoimmunology 3: e955691 [DOI] [PMC free article] [PubMed] [Google Scholar]
- Liu C, Mei M, Li Q, Roboti P, Pang Q, Ying Z, Gao F, Lowe M, Bao S (2017) Loss of the golgin GM130 causes Golgi disruption, Purkinje neuron loss, and ataxia in mice. Proc Natl Acad Sci USA 114: 346–351 [DOI] [PMC free article] [PubMed] [Google Scholar]
- Niso‐Santano M, Malik SA, Pietrocola F, Bravo‐San Pedro JM, Marino G, Cianfanelli V, Ben‐Younes A, Troncoso R, Markaki M, Sica V, Izzo V, Chaba K, Bauvy C, Dupont N, Kepp O, Rockenfeller P, Wolinski H, Madeo F, Lavandero S, Codogno P et al (2015) Unsaturated fatty acids induce non‐canonical autophagy. EMBO J 34: 1025–1041 [DOI] [PMC free article] [PubMed] [Google Scholar]
- Obeid M, Panaretakis T, Joza N, Tufi R, Tesniere A, van Endert P, Zitvogel L, Kroemer G (2007) Calreticulin exposure is required for the immunogenicity of gamma‐irradiation and UVC light‐induced apoptosis. Cell Death Differ 14: 1848–1850 [DOI] [PubMed] [Google Scholar]
- Panaretakis T, Kepp O, Brockmeier U, Tesniere A, Bjorklund AC, Chapman DC, Durchschlag M, Joza N, Pierron G, van Endert P, Yuan J, Zitvogel L, Madeo F, Williams DB, Kroemer G (2009) Mechanisms of pre‐apoptotic calreticulin exposure in immunogenic cell death. EMBO J 28: 578–590 [DOI] [PMC free article] [PubMed] [Google Scholar]
- Passemard S, Perez F, Colin‐Lemesre E, Rasika S, Gressens P, El Ghouzzi V (2017) Golgi trafficking defects in postnatal microcephaly: the evidence for “Golgipathies”. Prog Neurobiol 153: 46–63 [DOI] [PubMed] [Google Scholar]
- Pietrocola F, Lachkar S, Enot DP, Niso‐Santano M, Bravo‐San Pedro JM, Sica V, Izzo V, Maiuri MC, Madeo F, Marino G, Kroemer G (2015) Spermidine induces autophagy by inhibiting the acetyltransferase EP300. Cell Death Differ 22: 509–516 [DOI] [PMC free article] [PubMed] [Google Scholar]
- Pucelik B, Arnaut LG, Stochel G, Dabrowski JM (2016) Design of pluronic‐based formulation for enhanced redaporfin‐photodynamic therapy against pigmented melanoma. ACS Appl Mater Interfaces 8: 22039–22055 [DOI] [PubMed] [Google Scholar]
- Ritz R, Roser F, Radomski N, Strauss WS, Tatagiba M, Gharabaghi A (2008) Subcellular colocalization of hypericin with respect to endoplasmic reticulum and Golgi apparatus in glioblastoma cells. Anticancer Res 28: 2033–2038 [PubMed] [Google Scholar]
- Rocha LB, Gomes‐da‐Silva LC, Dabrowski JM, Arnaut LG (2015) Elimination of primary tumours and control of metastasis with rationally designed bacteriochlorin photodynamic therapy regimens. Eur J Cancer 51: 1822–1830 [DOI] [PubMed] [Google Scholar]
- Rufo N, Garg AD, Agostinis P (2017) The unfolded protein response in immunogenic cell death and cancer immunotherapy. Trends Cancer 3: 643–658 [DOI] [PubMed] [Google Scholar]
- Saenz JB, Sun WJ, Chang JW, Li J, Bursulaya B, Gray NS, Haslam DB (2009) Golgicide A reveals essential roles for GBF1 in Golgi assembly and function. Nat Chem Biol 5: 157–165 [DOI] [PMC free article] [PubMed] [Google Scholar]
- Santos TC, Wierda K, Broeke JH, Toonen RF, Verhage M (2017) Early golgi abnormalities and neurodegeneration upon loss of presynaptic proteins Munc18‐1, Syntaxin‐1, or SNAP‐25. J Neurosci 37: 4525–4539 [DOI] [PMC free article] [PubMed] [Google Scholar]
- Sauvat A, Zhou H, Leduc M, Gomes‐da‐Silva LC, Bezu L, Muller K, Forveille S, Liu P, Zhao L, Kroemer G, Kepp O (2017) Automated analysis of fluorescence colocalization: application to mitophagy. Methods Enzymol 588: 219–230 [DOI] [PubMed] [Google Scholar]
- Senovilla L, Demont Y, Humeau J, Bloy N, Kroemer G (2017) Image cytofluorometry for the quantification of ploidy and endoplasmic reticulum stress in cancer cells. Methods Mol Biol 1524: 53–64 [DOI] [PubMed] [Google Scholar]
- Stoffel W, Hammels I, Jenke B, Binczek E, Schmidt‐Soltau I, Brodesser S, Schauss A, Etich J, Heilig J, Zaucke F (2016) Neutral sphingomyelinase (SMPD3) deficiency disrupts the Golgi secretory pathway and causes growth inhibition. Cell Death Dis 7: e2488 [DOI] [PMC free article] [PubMed] [Google Scholar]
- Zhou H, Sauvat A, Gomes‐da‐Silva LC, Durand S, Forveille S, Iribarren K, Yamazaki T, Souquere S, Bezu L, Muller K, Leduc M, Liu P, Zhao L, Marabelle A, Zitvogel L, Rekdal O, Kepp O, Kroemer G (2016) The oncolytic compound LTX‐401 targets the Golgi apparatus. Cell Death Differ 23: 2031–2041 [DOI] [PMC free article] [PubMed] [Google Scholar]
Associated Data
This section collects any data citations, data availability statements, or supplementary materials included in this article.
Supplementary Materials
Appendix
Expanded View Figures PDF
Review Process File


