

Abstract
Cytoplasmic mRNA degradation controls gene expression to help eliminate pathogens during infection. However, it has remained unclear whether such regulation also extends to nuclear RNA decay. Here, we show that 145 unstable nuclear RNAs, including enhancer RNAs (eRNAs) and long noncoding RNAs (lncRNAs) such as NEAT1v2, are stabilized upon Salmonella infection in HeLa cells. In uninfected cells, the RNA exosome, aided by the Nuclear EXosome Targeting (NEXT) complex, degrades these labile transcripts. Upon infection, the levels of the exosome/NEXT components, RRP6 and MTR4, dramatically decrease, resulting in transcript stabilization. Depletion of lncRNAs, NEAT1v2, or eRNA07573 in HeLa cells triggers increased susceptibility to Salmonella infection concomitant with the deregulated expression of a distinct class of immunity‐related genes, indicating that the accumulation of unstable nuclear RNAs contributes to antibacterial defense. Our results highlight a fundamental role for regulated degradation of nuclear RNA in the response to pathogenic infection.
Keywords: innate immune response, lncRNA, nuclear exosome, nuclear RNA degradation, Salmonella infection
Subject Categories: Microbiology, Virology & Host Pathogen Interaction; RNA Biology
Introduction
Numerous studies have revealed that dynamic changes in cytoplasmic mRNA abundance, through tightly regulated degradation, are crucial in the control of various biological processes (Keene, 2010; Schott & Stoecklin, 2010; Alonso, 2012). For instance, mRNAs encoding cytokines are stabilized upon the occurrence of immune stimuli through regulated binding of specialized RNA‐binding proteins (RBPs) to specific sequences, such as adenylate‐/uridylate‐rich elements (AREs), embedded in 3′ untranslated regions (3′UTRs) of these transcripts. This results in an increase in RNA abundance and the immediate production of proteins needed to fight pathogenic infection (Schott & Stoecklin, 2010). Cytoplasmic mRNA degradation is also involved in the quality control of mRNA (Lykke‐Andersen & Jensen, 2015) and therefore is at the heart of post‐transcriptional regulation of gene expression.
In addition to the pool of cytoplasmic mRNAs, eukaryotic genomes produce a large variety of long noncoding RNAs (lncRNAs), some of which reside in cell nuclei and regulate gene expression (Imamura & Akimitsu, 2014; Quinn & Chang, 2016). We previously identified a class of human unstable nuclear lncRNAs implicated in cell proliferation (Tani et al, 2012). Other studies have identified additional unstable nuclear RNAs produced from enhancer regions, so‐called enhancer RNAs (eRNAs) (Maekawa et al, 2015), which may mediate the transcriptional activation of nearby genes (Tani et al, 2015; Li et al, 2016). Although the biological roles of the vast majority of unstable nuclear lncRNAs remain undetermined, they constitute interesting model transcripts for studying the possible impact of regulated RNA turnover on nuclear lncRNA function.
RNA degradation is primarily executed by 5′‐3′ and 3′‐5′ exonucleases. 3′‐5′ exonucleolytic activity in mammalian nuclei depends mainly on the multisubunit RNA exosome complex composed of nine core subunits, such as RRP46 (EXOSC5), and two catalytic subunits, RRP44 (DIS3) and RRP6 (EXOSC10) (Schneider & Tollervey, 2013; Januszyk & Lima, 2014). The nuclear RNA exosome degrades a range of unstable transcripts, among which are included several lncRNAs and eRNAs (Maekawa et al, 2015). In addition, the RNA exosome plays a central role in the 3′‐5′ processing of rRNAs and 3′‐extended products of snoRNAs by collaborating with the TRf4p/Air2p/Mtr4p Polyadenylation (TRAMP) complex, which resides in the nucleolus in mammals (Allmang et al, 1999; Fasken et al, 2011; Lubas et al, 2015; Thoms et al, 2015; Sudo et al, 2016). RNA exosome is generally guided to its substrates by RNA‐binding adaptor complexes (Kilchert et al, 2016). Indeed, the Nuclear EXosome Targeting (NEXT) complex, consisting of the RNA helicase MTR4, the Zn‐finger protein ZCCHC8, and the RNA‐binding protein RBM7, is involved in the exosomal targeting of PROMoter uPstream Transcripts (PROMPTs) (Lubas et al, 2011), eRNAs (Meola et al, 2016), and the 3′‐extended products from snRNAs (Lubas et al, 2015). In this regard, the NEXT complex contributes to the elimination of transcripts pervasively produced throughout the genome (Jensen et al, 2013). More recently, a nuclear RNA decay pathway, coined the Poly(A) tail eXosome Targeting (PAXT) connection, consisting of MTR4, the Zn‐finger protein ZFC3H1, and the nuclear polyA binding protein PABPN1, was identified to target polyadenylated nuclear transcripts (Meola et al, 2016).
Here, we focus on infection by Salmonella enterica serovar Typhimurium (Salmonella), a frequently used model for investigating the mechanisms of host–bacterium interaction (Keestra‐Gounder et al, 2015). Salmonella is a facultative intracellular pathogen that resides within a unique membrane‐bound component following host cell invasion. Its infection mechanism depends on two type III secretion systems encoded by the Salmonella pathogenicity islands, SPI‐1 and SPI‐2, which are necessary for invasion and intracellular replication, respectively (Brawn et al, 2007). To limit bacterial infection, many proteins act inside host cells. However, a limited number of noncoding RNAs, including microRNAs and lncRNAs, have also been implicated in the regulation of Salmonella infection (Schulte et al, 2011; Gomez et al, 2013; Maudet et al, 2014). Here, we report on the upregulation of a subset of unstable nuclear noncoding RNAs in response to Salmonella infection. We find that these labile RNAs accumulate as a result of loss of nuclear exosome/NEXT components and that this accumulation contributes positively to the expression of cellular immunity‐related genes and hence acts in the defense against Salmonella infection.
Results
Accumulation of unstable nuclear RNAs upon bacterial infection
To identify genes that are upregulated in response to bacterial infection, we conducted whole‐transcriptome analysis by RNA sequencing (RNA‐seq) of HeLa cells at 2, 6, and 18 h postinfection (p.i.) with Salmonella. This revealed that 1,210 protein‐coding transcripts were upregulated with fold changes > 2 over the time course (Table EV1, Figs EV1A and EV2A). Gene Ontology (GO) terms related to immune responses were significantly enriched for these genes (Table EV2). Moreover, our data confirmed the upregulation of several mRNAs previously reported to be transiently induced upon Salmonella infection, such as NFKB1, NFKB2, and RELB (Fig EV1B) (Afonso‐Grunz et al, 2015). Finally, of the 26,858 unstable nuclear ncRNA candidates detected in HeLa cells (Fig EV2B), 145 were upregulated with fold changes > 2 upon Salmonella infection with diverse induction kinetics (Fig 1A and B, Table EV3). To determine whether the upregulation of these ncRNAs could also be independently detected, we analyzed publicly available RNA‐seq data from different Salmonella‐infected cell lines (Afonso‐Grunz et al, 2015; Westermann et al, 2016). We found that 15–60% of the unstable nuclear ncRNAs upregulated in Salmonella‐infected human cells were also upregulated in different cells under different conditions (Table EV4). Human unstable nuclear ncRNAs upregulated upon Salmonella infection can be annotated in mouse (47 ncRNAs) and pig (34 ncRNAs) cells (Westermann et al, 2016). Depending on cell lines and experimental conditions, we found that 27–45% of mouse unstable nuclear ncRNAs were upregulated in response to Salmonella infection (Table EV4), while 15–50% of pig unstable nuclear ncRNAs were also upregulated upon Salmonella infection (Table EV4). This variation may reflect differences in infection conditions (e.g., time course and multiplicity of infection) or the variable cellular context (different cell types and species).
Figure EV1. Identification of genes with upregulated expression in HeLa cells upon Salmonella infection.

- Volcano plots of expression of the indicated RNAs in HeLa cells at the indicated times post‐Salmonella infection (p.i.). The volcano plots of log2 of the fold changes (FC) versus the P‐value obtained from edgeR.
- Induction kinetics of genes typically induced upon Salmonella infection. Relative mRNA expression levels were calculated from RPKM values obtained by RNA‐seq analysis of total RNA isolated from infected cells at the indicated times.
Figure EV2. Bioinformatic analysis of genes with induced expression upon Salmonella infection.

- Heat maps showing the kinetics of changes in expression of the indicated mRNAs at 2, 6, and 18 h postinfection. Red and blue indicate higher and lower expression levels of the RNAs, respectively, in infected cells compared with those in uninfected cells at the same time point. The represented RNAs showed altered expression with fold change > 2 or < 0.5 at any time point upon Salmonella infection.
- Flow chart for the selection of unstable nuclear ncRNAs from lncRNAs.
- Expression levels of protein‐coding genes in relation to their genomic distances from eRNAs that are upregulated (red dots) and not upregulated (blue dots) in response to MTR4 depletion.
- Expression levels of protein‐coding genes in relation to their genomic distances from eRNAs, which are upregulated in both Salmonella‐infected cells and MTR4‐depleted cells.
Figure 1. Identification and analysis of unstable nuclear ncRNAs upregulated in response to Salmonella infection.
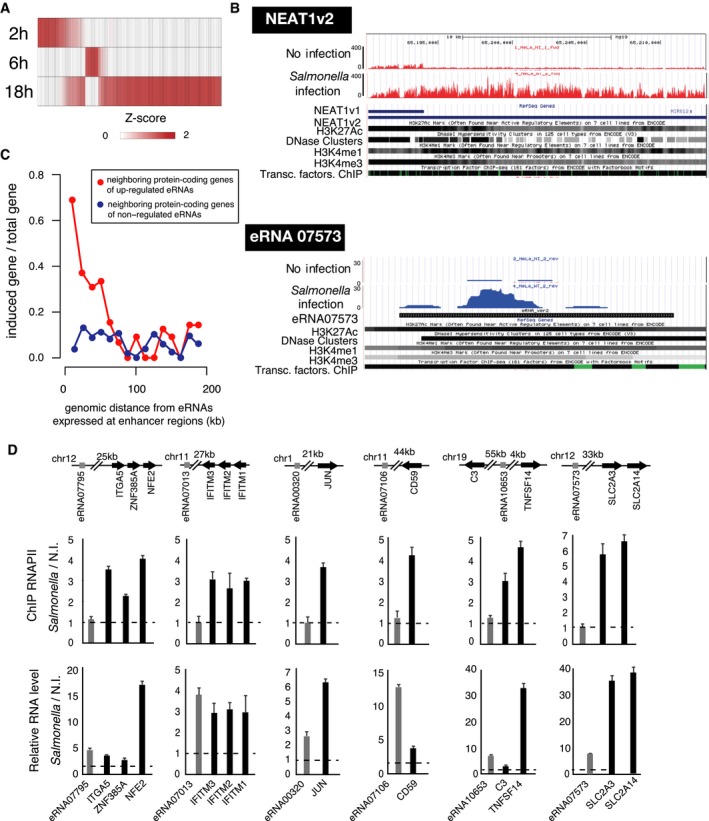
- Heat map depicting the relative expression of unstable nuclear ncRNAs (fold change > 2 comparing to noninfected condition) in HeLa cells at 2, 6 and 18 h after Salmonella infection (m.o.i. of 75).
- UCSC genome browser examples of NEAT1v2 from intergenic region (upper) and eRNA from enhancer region (lower) with chromatin signatures obtained from ENCODE data (https://www.encodeproject.org/).
- Induction of the expression of neighboring protein‐coding genes of upregulated and non‐upregulated eRNAs at 18 h p.i. Red and blue circles indicate induction rate of the neighboring protein‐coding genes of 26 upregulated eRNAs and 100 non‐upregulated eRNAs, respectively. The x‐axis indicates 200‐kb genomic regions (200 kb downstream and 200 kb upstream from each eRNA genes) divided into 16 bins (12.5‐kb DNA region per bin). The y‐axis indicates the ratio of the number of induced protein‐coding genes to the number of total protein‐coding genes located within each 12.5‐kb DNA region, plotted as “induced genes/total genes”.
- Analysis of expression of eRNAs and the neighboring genes by ChIP‐RNAPII to estimate transcriptional activation (middle panels) and by RT–qPCR analysis to estimate RNA amount (lower panels). Relative genomic positions of the analyzed genes are schematically shown in the upper panels. Arrows indicate the direction of the genes. Error bars indicate the absolute errors of two replicates.
Previous studies suggested that ncRNAs can be classified into canonical lncRNAs and eRNAs (Ne et al, 2014). Enhancer regions may be distinguished from promoter regions by their high level of monomethylated lysine 4 residues on histone 3 (H3K4me1) and high acetylation of H3K27 (H3K27Ac) (Ernst et al, 2011; Dorighi et al, 2017). Using publicly available chromatin immunoprecipitation (ChIP)‐seq data for histone modifications (ENCODE consortium), 26 of the 145 upregulated unstable nuclear ncRNAs were mapped to enhancer regions (Fig 1B lower panel, Table EV3). As eRNAs have been reported to coordinate the regulation of neighboring protein‐coding genes through a locus control process (Lam et al, 2013; Li et al, 2013; Melo et al, 2013), we investigated whether these eRNAs may be involved in the transcriptional regulation of genes in their vicinity. To this end, we examined whether there was any correlation between the upregulation of eRNAs and their adjacently transcribed mRNAs by comparing expression changes with the distance between eRNA‐ and mRNA‐expressing loci. This metagene analysis revealed increased expression of 70% (9/13) of protein‐coding genes within a 12.5 kb genomic distance of upregulated eRNAs (Fig 1C, red line), whereas protein‐coding genes adjacent to eRNAs, which were not upregulated by infection, were unaffected (Fig 1C, blue line). Interestingly, GO analysis revealed that immune‐related terms were significantly enriched among the upregulated protein‐coding genes (21/99) within ± 100 kb of upregulated eRNAs (Table EV5). Such eRNA–mRNA distance‐dependent co‐upregulation could also be detected in MTR4‐depleted HeLa cells, further suggesting that the correlation indeed arose via a decrease in nuclear RNA turnover (Fig EV2C and D). Finally, we demonstrated for a subset of these cases that increased mRNA levels were in part derived from increased transcription, as determined by RNA polymerase II (RNAPII)‐ChIP PCR, whereas the eRNA upregulations were not transcription‐based (Fig 1D, Table EV6).
Altered half‐lives underlie unstable nuclear lncRNA and eRNA upregulation
To examine the molecular basis for unstable nuclear lncRNA and eRNA upregulation, we selected four ncRNAs as model RNAs: NEAT1v2, LINC00173, eRNA07573, and eRNA10281. Of these, NEAT1v2 is a known lncRNA, which forms nuclear paraspeckles by gathering transcriptional regulators such as SFPQ and NONO (Hirose et al, 2014; Imamura et al, 2014). NEAT1v2 also participates in the transcriptional regulation of immunity‐related genes in response to viral infection (Imamura et al, 2014). Living Salmonella, but neither heat‐killed Salmonella, lipopolysaccharide (LPS), nor flagellin, induced the upregulation of unstable nuclear lncRNAs (Fig 2A). To analyze this further, we conducted real‐time quantitative reverse‐transcription PCR (RT–qPCR) assays of total RNA from cells infected with Salmonella mutants: SPI‐1 mt (invasion) or SPI‐2 mt (intercellular replication). Neither of these infections induced these unstable nuclear lncRNAs (Fig 2B). This suggests that bacterial intracellular replication triggers the increase in the tested ncRNAs.
Figure 2. Analysis of unstable nuclear ncRNA that accumulates upon Salmonella infection.

- Expression levels of unstable nuclear ncRNAs in HeLa cells infected with Salmonella (m.o.i. of 75, 18 h p.i.), treated with heat‐killed Salmonella (m.o.i. of 75), 1 μg/ml LPS, or flagella stimuli were quantified by RT–qPCR at 18 h post‐treatment. GAPDH mRNA levels were used for normalization. The dashed x‐axis represents a twofold line.
- Expression levels of unstable nuclear ncRNAs in HeLa cells infected with Salmonella wild type or mutants defective in SPI‐1 (CS4022; prgI‐depleted mutant) and SPI‐2 (CS4019; ssaG‐depleted mutant) were quantified by RT–qPCR 18 h postinfection. GAPDH mRNA levels were used for normalization.
- Degradations of unstable nuclear ncRNAs were determined by BRIC (NEAT1v2) or actinomycin D chase (LINC00173, eRNA07573, and eRNA10281) followed by RT–qPCR. Colored and white circles indicate RNA levels in cells with or without Salmonella infection, respectively. Relative quantitative values at time 0 h were set to 100%.
- HeLa cells with (color bars) and without (white bars) Salmonella infection at 18 h p.i. were subjected to ChIP‐RNAPII of the promoter region of the indicated gene loci. The dashed x‐axis represents a twofold line.
To determine whether altered RNA stability might underlie the observed increases in ncRNA levels upon infection, we measured turnover rates of unstable nuclear ncRNAs upon Salmonella infection and compared these to any altered transcriptional activity. This demonstrated that infection led to the stabilization of unstable nuclear ncRNAs (Fig 2C) without any increase in RNAPII occupancy on the promoter regions of these unstable nuclear ncRNA genes (Fig 2D). In contrast, RNAPII was recruited to the promoters of the IL8 and SOCS3 genes, which are known to be transcriptionally activated by Salmonella infection (St John & Abraham, 2009; Bhavsar et al, 2013). We conclude that unstable nuclear RNAs are accumulated due to stabilization upon Salmonella infection.
Factors involved in the degradation of unstable nuclear ncRNAs in uninfected cells
Several labile nuclear RNAs are degraded by the 3′‐5′ exonucleolytic RNA exosome (Schneider & Tollervey, 2013; Januszyk & Lima, 2014). We therefore examined whether this is also the case for unstable nuclear ncRNAs in uninfected cells. Indeed, knockdown of the exosome core subunit RRP46 increased the abundance of unstable nuclear ncRNAs, whereas depletion of XRN2, a major nuclear 5′‐3′ exonuclease, had only a marginal effect (Fig 3A and B). The nucleoplasm of HeLa cells contains at least two targeting complexes associated with the nuclear RNA exosome: the NEXT complex and the PAXT connection. Moreover, the exosome co‐factor hTRAMP is primarily localized to the nucleolus. Knockdown of hTRAMP components and PAXT components did not significantly affect the levels of unstable nuclear ncRNAs (Fig 3C and D). In contrast, the levels of unstable nuclear ncRNAs were increased by depletion of both the MTR4 and the ZCCHC8, components of the NEXT complex (Fig 3E). Some unstable nuclear ncRNAs were also affected by the depletion of RBM7, a component of the NEXT complex. Our data thus suggest that unstable nuclear ncRNAs are targeted for exosomal degradation mainly by the NEXT complex.
Figure 3. Involvement of the NEXT complex in the degradation of unstable nuclear ncRNAs.

-
A–ELevel changes of the indicated unstable nuclear ncRNAs in HeLa cells transfected with the indicated siRNAs, RRP46 (A), XRN2 (B), TRAMP complex components (C), PAXT connection component (D), and NEXT complex components (E). Two independent siRNAs were examined for each target. Values represent the mean ± SD (n = 3, Student's t‐test, *P < 0.01). Dashed lines indicate the values of twofold upregulation.
MTR4 and RRP6 are lost upon Salmonella infection
To search for a potential mechanism by which Salmonella infection might stabilize unstable nuclear ncRNAs, we used Western blotting analysis to monitor levels of different nuclear RNA degradation factors in infected cells. Interestingly, we observed that MTR4 and RRP6 were specifically lost upon infection (Fig 4A). MTR4 levels began to decrease 6 h p.i. and were almost undetectable at 18 h p.i., at which point RRP6 protein was also undetectable. To understand whether the loss of MTR4 and RRP6 could also be detected in other cell types, we analyzed several human and mouse cell lines infected with Salmonella. This revealed the loss of MTR4 and RRP6 in examined cell lines upon Salmonella infection (Fig EV3A). Consistent with this probably being causal of the upregulation of unstable nuclear ncRNAs, levels of these transcripts increased dramatically at 18 h p.i. (Figs 1A and 4B). To confirm the loss of exosome defect, we detected the upregulation of unstable nuclear ncRNAs in MTR4‐depleted cells (Table EV7). To further confirm MTR4‐mediated degradation of unstable nuclear ncRNAs, we determined the degradation kinetics of NEAT1v2 in MTR4‐depleted or control cells. This confirmed that MTR4 depletion stabilizes unstable nuclear ncRNAs (Fig EV4A). Knockdown of MTR4 did not affect the expression level of RRP6, and vice versa (Fig EV4B), suggesting that the loss of these factors is independently executed.
Figure 4. Loss of MTR4 and RRP6 in response to Salmonella infection.

- Levels of indicated proteins analyzed by Western blotting at the indicated time points after Salmonella infection.
- Induction kinetics of NEAT1v2 and eRNA07573 upregulation in response to Salmonella infection (m.o.i. of 75). Values represent the mean ± SD (n = 3, Student's t‐test, *P < 0.01).
- Western blotting analysis of 5–30% glycerol gradient fractions of HeLa cell extract with or without Salmonella infection (m.o.i. of 75, 18 h p.i.) using the indicated antibodies.
- Western blotting analysis in HeLa cells treated with cycloheximide (CHX).
Source data are available online for this figure.
Figure EV3. Loss of MTR4 and RRP6 in several cell lines upon Salmonella infection.

Levels of MTR4 and RRP6 proteins analyzed by Western blotting in the indicated cell lines upon Salmonella infection. The anti‐MTR4 antibody from the Nagahama laboratory was used to detect the human cell lysate, and the anti‐MTR4 antibody (ab70551, Abcam) was used to detect the mouse cell lysate.Source data are available online for this figure.
Figure EV4. Analysis of nuclear RNA decay factors involved in the expression of unstable nuclear ncRNAs.

- Stabilization of NEAT1v2 degradation in MTR4‐depleted HeLa cells. The kinetics of RNA degradation was determined by the BRIC method followed by RT–qPCR analysis normalized to GAPDH mRNA levels.
- RRP6 and MTR4 expression levels in HeLa cells transfected with the indicated siRNAs.
- Diagram of the human pre‐rRNA processing pathway. The red bars indicate ITS1 and ITS2 probes used for northern blotting. The blue arrows indicate MTR4‐dependent pathways.
- The membrane stained with methylene blue.
- Northern blotting analysis of MTR4‐depleted HEK293 cells or Salmonella‐infected cells by using ITS1 probe. The lower table indicates each band intensity as determined using ImageJ. 47S/45S rRNA band intensity was adjusted to 1.00.
- Northern blot analysis of the MTR4‐depleted HEK293 cells or Salmonella‐infected cells by using ITS2 probe. The lower table indicates each band intensity as determined using ImageJ. 47S/45S rRNA band intensity was adjusted to 1.00.
Source data are available online for this figure.
To characterize the properties of nuclear RNA decay machinery during Salmonella infection, we ran sedimentation profiles of extracts from infected and uninfected cells on 5–30% glycerol gradients. NEXT complex components, ZCCHC8 and RBM7, were redistributed from the middle and heavy fractions (Fr. 10–22 under no infection conditions in Fig 4C) to lighter fractions (Fr. 5–14 under infection conditions in Fig 4C) at 18 h p.i. This indicates that the NEXT complex is disrupted due to the loss of MTR4 expression and would therefore result in the accumulation of unstable nuclear ncRNAs.
Because both MTR4 and RRP6 are stable proteins in naïve cells, as measured by a time‐course assay harvesting samples subsequent to translation inhibition (Fig 4D), and their degradation appears to be specifically accelerated in response to Salmonella infection, presumably by enhanced proteolysis, the loss of MTR4 and RRP6 is an active response upon infection.
To further examine any dysregulation of MTR4 and RRP6 activities upon Salmonella infection, we examined rRNA processing by northern blotting analysis (Fig EV4C). In infected cells, a marked reduction in total amounts of rRNA intermediates was observed (Fig EV4D–F). Despite the relative accumulation of 32S rRNA intermediates, levels of 12S rRNA intermediates were not decreased (Fig EV4F). This is probably due to a delayed conversion of 12S into 5.8S. These results suggest that Salmonella infection may affect the RNA exosome‐mediated rRNA processing, but not at all to the same degree as when MTR4 levels are decreased by siRNA‐mediated depletion. This may be because Salmonella infection likely triggers more adverse effects on rRNA processing. In addition, the different durations of MTR4 depletion between siRNA‐mediated MTR4 knockdown (72 h) and Salmonella infection (18 h) may cause the observed different alterations of rRNA processing. The mild effect on RNA exosome‐mediated rRNA processing upon Salmonella infection also appears to be reflected by the relatively few ncRNAs that are stabilized compared with those under MTR4 knockdown conditions.
Involvement of unstable nuclear ncRNAs in the host immune response
We next examined a possible phenotype as a result of the accumulation of NEAT1v2 upon Salmonella infection. NEAT1v2 accumulation correlated with excessive paraspeckle formation (Fig EV5A and B). Since NEAT1 accumulation was previously shown to modulate immunity‐related genes (Imamura et al, 2014), we further explored a possible role of NEAT1v2 in host cell defense by examining the viability of NEAT1v2 CRISPR‐mediated knockout (KO) cells under conditions of Salmonella infection (Fig 5A). The viability of NEAT1v2 KO cells was reduced compared with that of WT cells after Salmonella infection (Fig 5B). Accordingly, Salmonella grew well in NEAT1v2 KO cells (Fig 5C), whereas its invasion rate into KO and WT cells was comparable (Fig 5D), suggesting that NEAT1v2 modulates the antibacterial response after entry of the pathogen. Microarray analysis revealed 126 genes that were induced in WT but not in NEAT1v2 KO cells upon Salmonella infection (Table EV8). Consistent with an antibacterial role of NEAT1v2, among these genes was an abundance of those involved in immune responses, such as TNFSF9, CCL2, and CSF1 (Fig 5E, Table EV9).
Figure EV5. Excessive formation of paraspeckles upon Salmonella infection.

- Immunostaining (red, NONO; blue, SFPQ) and RNA‐FISH (green, NEAT1v2) analyses of cells without (upper panels) or with (lower panels) Salmonella infection (m.o.i. of 75, 18 h p.i.). DNA was counterstained with DAPI (white). Scale bar, 5 μm.
- Box plots representing the distribution of fluorescence intensities of NEAT1v2 in paraspeckles from cells with (n = 38) or without (N.I., n = 71) Salmonella infection. The center of the notched‐box plot is the median, the endpoints of the notches show the median confidence intervals, and the whiskers show maximum or minimum values. The extreme endpoints of the plot represent the 25th and 75th percentiles (*P < 0.01, Student's t‐test).
- Levels of indicated proteins in HeLa cells depleted with proteins involved in nuclear RNA degradation.
Source data are available online for this figure.
Figure 5. Antibacterial function of unstable nuclear ncRNAs.

- Schematic showing the generation of NEAT1v2 KO cells using CRISPR/Cas9. The expression levels of NEAT1v2 in HeLa cells (white bar), in NEAT1v2 KO‐1 cells (light green bar) and in NEAT1v2 KO‐2 cells (dark green bar) as determined by RT–qPCR.
- Survival rates of HeLa and NEAT1v2 KO cells infected with Salmonella (m.o.i. of 75, 18 h p.i.).
- Numbers of viable Salmonella in indicated cells after infection with Salmonella (m.o.i. of 75, 18 h p.i.).
- Initial invasion number of Salmonella in the indicated cells immediately after infection (m.o.i. of 75, 30 min p.i.).
- Relative expression of indicated genes involved in immune responses in infected HeLa and NEAT1v2 KO cells compared with that in uninfected cells, as determined by RT–qPCR.
- Schematic figure of the generation of eRNA07573 KO cells. The expression levels of eRNA07573 in HeLa cells (white bar), KO‐1 cells (light blue bar) and KO‐2 cells (dark blue bar) were determined by RT–qPCR.
- Survival rates of HeLa and eRNA07573 KO cells infected with Salmonella (m.o.i. of 75, 18 h p.i.).
- Numbers of viable Salmonella in the indicated infected cells (m.o.i. of 75, 18 h p.i.).
- Initial invasion number of Salmonella in the indicated cells (m.o.i. of 75, 30 min p.i.).
- Expression of the indicated genes in HeLa and KO cells with and without Salmonella infection (m.o.i. of 75, 18 h p.i.).
Next, we examined the putative role of eRNAs in helping cells to resist Salmonella infection. CRISPR‐manipulated KO cells of eRNA07573, one of the most highly stabilized eRNAs, were highly susceptible to Salmonella (Fig 5F and G), which grew well in these cells (Fig 5H), despite displaying similar invasion efficiencies as in WT cells (Fig 5I). Here, our microarray analysis identified 196 genes that were induced in WT but not in KO cells in response to infection (Table EV10). Finally, we investigated expression of the SLC2A3 and SLC2A14 genes, adjacently positioned to the eRNA07573 locus, in eRNA07573 KO cells. SLC2A3 and SLC2A14 encode glucose transporters, and cytoplasmic glucose concentration significantly affects the growth of Salmonella in host cells (Eisenreich et al, 2010). As shown in Fig 1D, both SLC2A3 and SLC2A14 were transcriptionally activated in response to Salmonella infection in WT cells (Figs 1D and 5J). However, this induction was significantly decreased in eRNA07573 KO cells (Fig 5J). Since transcriptional activation of the eRNA07573 locus was not involved in the induction of SLC2A3 and SLC2A14 gene expression (Fig 1D), these findings suggest that the accumulation of eRNA07573 by RNA stabilization, rather than by transcriptional activation, affects the transcription of several genes, including near neighbors, in response to Salmonella infection. Overall, our data imply a similar role, namely, antibacterial response through transcriptional regulation of immunity‐related genes, for at least some nuclear ncRNAs that accumulate upon Salmonella infection.
Discussion
The changing of cytoplasmic mRNA levels via the induction of degradation or stabilization plays an important role in responses to stresses such as infection (Schott & Stoecklin, 2010). However, the biological significance of nuclear ncRNA regulation mediated by changing transcript half‐lives has remained unclear. In this study, we show that unstable nuclear ncRNAs, some of which are involved in the antibacterial immune response, accumulate due to their stabilization upon Salmonella infection. This response is probably caused by loss of the nuclear RNA decay factors, MTR4 and RRP6, which are involved in the degradation of unstable nuclear ncRNAs. To our knowledge, this is the first report showing that bacterial infection triggers the loss of nuclear RNA decay factors, resulting in the accumulation of unstable nuclear ncRNAs, which play important protective roles for host cells (Fig 6).
Figure 6. Model of unstable nuclear ncRNA‐mediated response to Salmonella infection.

In noninfected conditions, unstable nuclear ncRNAs are degraded by the NEXT‐RNA exosome pathway. Upon infection, loss of MTR4 and RRP6 ensues and decreases unstable nuclear ncRNA turnover, resulting in the subsequent upregulation of the immune response through transcriptional activation of downstream target genes.
It was previously reported that lncRNAs are induced during immune responses associated with exposure to bacterial components or synthetic immune inducers. For example, lincRNA‐Cox2, a transcriptional regulator of immune genes, is transcriptionally induced in mouse bone marrow‐derived macrophages by Pam3CSK4, a Tlr2 ligand, through the NF‐κB pathway (Carpenter et al, 2013). In addition, several lncRNAs and eRNAs, including IL7b‐eRNA, were induced after LPS treatment by NF‐κB‐mediated transcriptional activation in human primary monocytes and human monocytic THP‐1 cells (Mao et al, 2015). Moreover, it was recently observed that suppression of the immune regulatory microRNAs miR‐155 and let‐7 results in increased expression of the key cytokines interleukin (IL)‐10 and IL‐6 during Salmonella infection (Schulte et al, 2011). Furthermore, epigenetic activation of the interferon‐γ locus is regulated by an enhancer‐like lncRNA termed NeST (nettoie Salmonella pas Thriller's) (Gomez et al, 2013), and several members of the miR‐15 family are involved in inhibiting Salmonella infection (Maudet et al, 2014). Finally, dual RNA‐seq revealed that the Salmonella small RNA PinT affects the JAK–STAT pathway in host cells (Westermann et al, 2016). Focusing on gene expression in host cells infected by Salmonella, we were able to identify a novel set of unstable nuclear ncRNAs involved in the antibacterial response in the present study. Although known lncRNAs were upregulated by immune stimuli via transcriptional induction, we identified several ncRNAs that were upregulated by alteration of their half‐lives (Fig 6). Indeed, NEAT1v2 is induced by viral infection through transcriptional activation mediated by the TLR3 pathway, resulting in the activation of downstream genes such as interleukin‐8 (Imamura et al, 2014). Here, we show that NEAT1v2 can also accumulate through increased stability, which is a rare example of an lncRNA whose expression can be determined by both transcriptional and post‐transcriptional regulation depending on the stimulus. Accumulated NEAT1v2 regulates several immunity‐related genes (Imamura et al, 2014). The sequestration of transcription factors into paraspeckles seems to be involved in the activation of downstream genes under Salmonella infection. Compared with viral replication in host cells, bacterial growth is generally slow. This might enable cells to accumulate RNA through stabilization, which is likely to be a slower mode for the upregulation of transcripts than transcriptional activation. At this point, it is unclear why host cells developed RNA stabilization‐mediated upregulation of lncRNAs.
Recent studies have revealed that the mammalian genome produces an enormous number of eRNAs (Kim et al, 2010; Andersson et al, 2014). Although their roles remain largely unclear, research has indicated some function in the regulation of gene expression. For example, eRNAs can participate in the chromosomal looping between enhancers and promoters of target genes in transcriptional regulation (Lam et al, 2013; Li et al, 2013; Melo et al, 2013). Several studies have reported that eRNAs regulate their neighboring genes through the remodeling of chromosome structures (Li et al, 2013; Cinghu et al, 2017; Dorighi et al, 2017). Of particular interest to the present study, eRNAs have also been implicated in inflammatory responses and differentiation (Lam et al, 2013; Ne et al, 2014). Accordingly, our analyses show that protein‐coding genes in the vicinity of accumulating eRNAs are transcriptionally activated (Fig 1C and D) and that many of these genes are involved in the immune response. In line with these studies, we propose that eRNA accumulation upon Salmonella infection activates the transcription of neighboring genes. We also observed the co‐upregulation of eRNAs and their neighboring genes (these gene sets were randomly selected) upon small interfering (si)RNA‐mediated MTR4 depletion (Table EV11). These results support the idea that accumulated eRNAs are involved in regulating the expression of neighboring genes. It remains to be investigated whether such transcriptional activation occurs through the formation or maintenance of chromosomal structures.
A recent study showed that RBM7, an RNA‐binding component of the NEXT complex, is loaded onto short‐lived exosome substrates, resulting in their elimination from mammalian nuclei (Lubas et al, 2015). In accordance with this, a subset of unstable nuclear ncRNAs were targeted by the NEXT‐mediated RNA decay pathway. However, the expression level of some unstable nuclear ncRNAs was not markedly affected by RBM7 depletion (Fig 3E), although they still responded to the depletion of MTR4 and ZCCHC8. This suggests that either our RBM7 knockdown did not suffice to affect these unstable nuclear ncRNAs or that other distinct RNA decay pathways, utilizing MTR4 and ZCCHC8, serve to degrade some unstable nuclear ncRNAs.
NEAT1 lncRNA appears in two isoforms: NEAT1v1 (short isoform) and NEAT1v2 (long isoform). Although the biological function of NEAT1v1 is unclear, NEAT1v2 is essential for the formation of paraspeckles (Sasaki et al, 2009). NEAT1v2 regulates several genes through paraspeckle formation (Hirose et al, 2014; Imamura et al, 2014). Exosome dysfunction leads to an upregulation of NEAT1v1 in HEK293T or 293A‐TOA cells (Bresson & Conrad, 2013; Szczepinska et al, 2015). However, the mechanism of NEAT1v2 degradation was unclear. In this study, we showed that NEAT1v2 was degraded by RNA exosome‐mediated pathway.
Remarkably, MTR4 and RRP6 levels drop swiftly in response to Salmonella infection, which we suggest is the underlying cause of upregulated unstable nuclear ncRNAs. The number of upregulated ncRNAs upon Salmonella infection (145 ncRNAs) is smaller than in MTR4‐depleted cells (more than 2,000), likely because Salmonella infection induces more additional signals than MTR4 depletion and MTR4 knockdown (72 h) and Salmonella infection (18 h) lasted for different durations. Previous studies examining Salmonella infection also revealed the functional relevance of proteins that are depleted during infection. For example, it was found that the depletion of peroxiredoxin‐6, isoform β‐4c of integrin β‐4, isoform 1 of protein lap2 (erbin‐interacting protein), and stomatin, which are annotated to play a role in membrane traffic in the Golgi fraction, are all involved in increasing Salmonella replication (Vogels et al, 2011). However, the mechanism by which nuclear and Golgi proteins are lost remains unknown. Pathogenic infection activates caspase‐1, a protease that regulates the processing and secretion of interleukin‐1 family members (Ogura et al, 2006). Additionally, the proteasome is activated by infection (Kammerl & Meiners, 2016). However, our investigation into the presumed proteolysis of MTR4 and RRP6, using inhibitors of the proteasome (MG‐132) and caspase‐1 (V‐zVAD‐fmk), respectively, did not explain this response to Salmonella infection (data not shown). Thus, there remains a need to explore the molecular mechanism by which cells diminish MTR4 and RRP6 upon infection.
Materials and Methods
Reagents and molecular biological products
All chemicals were purchased from Wako Chemical (Osaka, Japan), unless otherwise stated.
Cell culture and transfection
HeLa TO cells (Clontech, Palo Alto, CA) were grown in Dulbecco's modified Eagle's medium (DMEM) supplemented with 10% heat‐inactivated fetal bovine serum (FBS) (Life Technologies, Grand Island, NY) and antibiotics (Life Technologies, Grand Island, NY) at 37°C in a humidified incubator (Thermo Fisher Scientific) with 5% CO2.
Reverse‐transcription–quantitative real‐time polymerase chain reaction (RT–qPCR)
Isolated RNA was reverse transcribed into cDNA using the PrimeScript RT Master Mix (Takara, Osaka, Japan). cDNA was amplified using the primer sets listed in Table EV12 by using SYBR Premix Ex Taq II (Takara) in accordance with the manufacturer's instructions. RT–qPCR analysis was performed using a Thermal Cycler Dice Real Time System (Takara). GAPDH mRNA was used for transcript normalization. Primers used in this study are shown in Table EV12.
Chromatin immunoprecipitation (ChIP) assay
Chromatin was cross‐linked with 1% formaldehyde for 10 min at 37°C and then sonicated in lysis buffer (1% SDS, 10 mM EDTA, and 50 mM Tris–HCl pH 8.0 supplemented with protease inhibitor cocktail [Sigma‐Aldrich, P8340]). After centrifugation, 10 μl of the supernatant was saved as input, and the remaining lysate was subjected to a ChIP assay using anti‐RNAPII mouse monoclonal antibody (clone 8WG16, Abcam, ab817). The primers used for amplification are listed in Table EV13.
siRNA‐mediated protein depletions
All siRNAs were designed using siDirect 2.0 Web server (http://siDirect2.RNAi.jp/) and were synthesized by Hokkaido System Science Co. Ltd. (Sapporo, Japan). siRNAs (Table EV14) were transfected into cells using Lipofectamine RNAiMAX (Invitrogen, Carlsbad, CA) according to the manufacturer's instructions. Briefly, cells treated with siRNA duplexes (final concentration 10 nM) mixed with Lipofectamine RNAiMAX were harvested 72 h after transfection.
Salmonella infection
The S. enterica serovar Typhimurium virulent strain used in this study was χ3306. A total of 1 × 10⁵ HeLa cells in each well of a 12‐well plate were challenged with Salmonella at a multiplicity of infection (m.o.i.) of 75, unless otherwise stated. Plates were centrifuged for 5 min at 500 × g to enhance and synchronize infection. Cells were incubated for 1 h at 37°C to permit phagocytosis, and free bacteria were removed by three washes with prewarmed phosphate‐buffered saline (PBS). DMEM containing 10% heat‐inactivated FBS and 100 μg/ml gentamicin was added, and the cells were incubated for an additional 2 h at 37°C in a humidified incubator with 5% CO2. Cells were subsequently incubated with DMEM containing 10% heat‐inactivated FBS and 10 μg/ml gentamicin at 37°C in a humidified incubator with 5% CO2 for the indicated period.
Construction of Salmonella mutant strains
Strains, CS4019 (ΔssaG) and CS4022 (ΔprgI), were constructed by λRed and FLP‐mediated recombination essentially as described by Datsenko and Wanner (2000) PCR products used to construct gene replacements were generated using template plasmid pKD4 and the primer sets;
ssaG‐P1; 5′‐CAGAACAACGTGCGCCGGAGTAATCGTTTTCAGGTATATACCGGTGTAGGCTGGAGCTGCTTC‐3′
ssaG‐P2; 5′‐CAGCAGCAACCGTCGAACATCGTCGCTAATAACTTCAGATCATATGAATATCCTCCTTAG‐3′
prgI‐P1; 5′‐CCAGGCCATTGGTATTTCCCAAGCCCACTTTAATTTAACGGTGTAGGCTGGAGCTGCTTC‐3′
prgI‐P2; 5′‐GGACAATAGTTGCAATCGACATAATCCACCTTATAACTGACATATGAATATCCTCCTTAG‐3′Each 1,476‐bp fragment generated was purified and introduced into strain χ3306 carrying pKD46, encoding the λRed recombinase, by transformation. To remove the Km cassette, pCP20, encoding FLP recombinase, was introduced into the resultant strains by transformation. The FRT insertion in ssaG or prgI was verified by PCR amplification of chromosomal DNA with the primer sets ssaG‐F, 5′‐CAGCAGCCCATTATATCG‐3′ and ssaJ‐R, 5′‐ACGATAAAGTTGCAACACCTCGGG‐3′ or prgI‐F, 5′‐CAAGAAAGAGCTCAGGTGT‐3′ and prgJ‐R, 5′‐GCAAGGGTCATTACCAGCAG‐3′.
Assay for Salmonella growth in HeLa cells
HeLa cells infected with Salmonella were processed at the indicated time after inoculation by aspirating the medium, washing three times with PBS, and lysing with PBS containing 0.2% Triton X‐100. Triplicate samples were plated on Luria–Bertani medium after appropriate dilution, and the number of colonies was counted after overnight incubation at 37°C.
Measurement of HeLa cell viability upon Salmonella infection
HeLa cells infected with Salmonella (m.o.i. of 50 or 75, 18 h p.i.) were mixed with an equal volume of 0.1% trypan blue (Life Technologies) and immediately observed under a microscope. The number of trypan blue‐negative and trypan blue‐positive cells was counted using a cytometer.
Immunoblotting
Cell lysates were prepared using 1× PBS supplemented with 1% Nonidet P‐40, 1× protease inhibitor cocktails (Roche, Switzerland) and 50 μg/ml phenylmethylsulfonyl fluoride (PMSF). Lysates were resolved by 10% SDS–PAGE and transferred to polyvinylidene difluoride (PVDF) membrane (Millipore) using a semi‐dry blotter (Bio‐Rad Laboratories, Hercules, CA) according to the manufacturer's instructions. The PVDF membranes were incubated with the indicated primary antibodies, followed by incubation with either anti‐mouse or anti‐rabbit secondary antibodies conjugated to horseradish peroxidase (HRP). After addition of HRP substrate (Millipore), the chemiluminescence signal was detected with a Luminescent Image Analyzer LAS‐4000 (Fujifilm). Antibodies used in this study are shown in Table EV15, and the results are shown in Fig EV5C.
RNA fluorescence in situ hybridization (FISH) and immunocytochemistry
FISH analysis was carried out to visualize endogenous RNAs according to a previously described protocol (Imamura et al, 2014). Briefly, DIG‐labeled antisense RNA probes were detected with standard immunocytochemical procedures using anti‐DIG sheep monoclonal antibody (Roche, Switzerland) and Alexa Fluor 488‐conjugated anti‐sheep IgG polyclonal goat antibody (Invitrogen). To visualize nuclear proteins, we used anti‐SFPQ/PSF rabbit antibody (B92; Sigma, St. Louis, MO) and anti‐NONO/p54 mouse monoclonal antibody (kindly donated by Dr. Fox, University of Western Australia). The secondary antibodies were Alexa Fluor 594‐conjugated anti‐mouse IgG polyclonal goat antibody (Invitrogen) and Alexa Fluor 647‐conjugated anti‐rabbit IgG polyclonal goat antibody (Invitrogen). For detection of DNA, samples were incubated with DAPI. Fluorescent images were obtained using a confocal microscope TCS SP5 with a 633/1.4 NA HC PL APO CS lens (Leica Co., Ltd., Tokyo, Japan). Acquired confocal images were pseudocolored and merged using the image analysis software LAS AF (Leica Co., Ltd., Tokyo, Japan). Stacks of optical sections with an axial distance of 250 nm were collected for each image. All images shown are representative of several repeated experiments. Salmonella infection was assessed by staining of Salmonella DNA with DAPI. For calculation of NEAT1v2 intensity in paraspeckles, each optical section image was integrated to a single image and the fluorescence intensity of NEAT1v2 foci was measured by using the image analysis software LAS AF.
Massive sequencing analysis
RNA‐seq libraries were sequenced according to the standard protocol from mRNA‐seq Sample Preparation (Illumina Inc., San Diego, CA). Briefly, approximately 1 μg of total RNA was used to prepare an RNA‐seq library using the mRNA‐seq Sample Preparation Kit (Illumina Inc.) in accordance with the manufacturer's protocol. Thirty six‐bp single‐end‐read RNA‐seq samples were generated from the Illumina HiSeq2000 sequencer in accordance with the standard protocol. Fluorescent images were processed to nucleotide sequences using Pipeline software supplied by Illumina. Reads mapping to ribosomal RNA genes were removed. Filtered sequences were mapped to the reference human genome (hg19) using Tophat (version 2.0.8) (Trapnell et al, 2009). FeatureCounts was used to assign reads to the gene annotation constructed in previous studies based on GENCODE v19 data and FANTOM5 data (Imamachi et al, 2014; Maekawa et al, 2015). Differential expression analysis was performed using Bioconductor package edgeR (version 3.12.1). A FDR cutoff of 0.1 was applied. To define eRNAs expressing from enhancer regions, we selected the eRNAs that overlapped with enhancer regions identified by the co‐occurrence of H3K4me1, H3K4me3, and H3K27ac, obtained from the ENCODE project (ftp://hgdownload.cse.ucsc.edu/goldenPath/hg19/encodeDCC/wgEncodeBroadHistone/wgEncodeBroadHistoneHelas3H3k04me1StdPk.broadPeak.gz, ftp://hgdownload.cse.ucsc.edu/goldenPath/hg19/encodeDCC/wgEncodeBroadHistone/wgEncodeBroadHistoneHelas3H3k4me3StdRawDataRep1.fastq.gz, ftp://hgdownload.cse.ucsc.edu/goldenPath/hg19/encodeDCC/wgEncodeBroadHistone/wgEncodeBroadHistoneHelas3H3k27acStdPk.broadPeak.gz). We also used the RNA‐seq data of Salmonella infection (DRA003692), MTR4 knockdown conditions (DRA003583), SAGE profiling (GSE61730) (Afonso‐Grunz et al, 2015), and Dual RNA‐seq (GSE60144) (Westermann et al, 2016).
DNA microarray analysis
Total cellular RNA was isolated using RNAisoPlus (Takara). Labeled cRNA was generated from 100 ng of total RNA using a Low Input Quick Amp WT Labeling Kit (Agilent Technologies, Palo Alto, CA) according to the manufacturer's instructions and hybridized to SurePrint G3 Human Gene Expression Microarray 8 × 60K v3.0. Microarray slides were scanned using the SureScan microarray system (Agilent Technologies), and scanned images were analyzed by Feature Extraction (ver. 11.5). To analyze expression data at the genetic level, the intensity of the signal values was summarized using Entrez Gene ID (normalized to the 75th percentile) by GeneSpring (ver. 13.0) (Agilent Technologies). The gene set probes were filtered by expression percentile (20.0–100.0%). Genes that were expressed at lower than the 20th percentile in all of the six conditions tested (uninfected HeLa cells, uninfected KO1 cells, uninfected KO2 cells, infected HeLa cells, infected KO1 cells, and infected KO2 cells) were eliminated from the analyses. After excluding the gene set probes that did not have gene symbols, the remaining genes were used for further analysis. Welch's t‐test was carried out to identify genes with altered expression upon infection. In this study, we only determined altered protein‐coding genes. Hierarchical cluster analysis was performed using average linkage and Pearson correlation as a measure of similarity using R package obtained from Bioconductor (https://www.bioconductor.org/packages/release/bioc/).
Generation of knockout HeLa cell lines
Cell lines were established using the CRISPR/Cas9 system. Single guide RNAs (sgRNA) were designed using CRISPR direct (http://crispr.dbcls.jp/) and cloned into a pX330 vector (#42230) obtained from Addgene (https://www.addgene.org/). The sgRNA sequences were 5′‐GGTGCGCTGGTCTGTGTGGA‐3′ for NEAT1v2 and 5′‐CCGCGCCCGAACTACAATTCTTG‐3′ for eRNA07573. Targeting constructs for gene knockout were designed to insert double polyA sites and an inverse puromycin resistance cassette at the site of the start codon. The sgRNA vector and targeting vector were transfected into HeLa cells. After 24 h, cells were cultured in medium supplemented with 2 μg/ml puromycin for 2 weeks. Selected colonies were picked, and successful knockout was confirmed by RT–qPCR.
Gene ontology (GO) term analysis
Target mRNAs were analyzed by the PANTHER Overrepresentation Test (release 15‐07‐2016) (http://pantherdb.org/) using GO Ontology database released July 29, 2016. The Bonferroni correction for multiple testing was employed for statistical analysis.
Actinomycin D chase assay
For RNA stability measurements, HeLa cells were treated with 1 μg/ml actinomycin D (dissolved in DMSO [Sigma‐Aldrich]). Samples were taken every 5–10 min, and RNA isolation, cDNA synthesis, and RT–qPCR were carried out as described previously (Tani et al, 2012).
BRIC followed by RT–qPCR
BRIC was performed as described previously (Tani et al, 2012; Imamachi et al, 2014). In brief, cells were incubated at 37°C in the presence of 150 μM bromouridine (BrU) (Wako Chemical, Tokyo, Japan) for 24 h in a humidified incubator with 5% CO2. Cells were harvested at the indicated time points after replacing BrU‐containing medium with BrU‐free medium. Total RNA was isolated using RNAiso Plus (Takara), followed by isolation of BrU‐labeled RNA using anti‐BrdU mouse antibody (clone 2B1, MBL, Nagoya, Japan). The isolated RNA was used for RT–qPCR.
Glycerol gradient centrifugation
Whole‐cell extracts were prepared by washing cells in PBS and scraping them into RSB100 buffer (100 mM NaCl, 10 mM Tris–HCl pH 7.4, 2.5 mM MgCl2) containing 0.5% Triton X‐100, 1% protease inhibitor cocktail (Sigma‐Aldrich), 5 μg/ml RNase A (Sigma‐Aldrich), and 200 units/ml RNase T1 (Sigma‐Aldrich). Cells were lysed and sonicated in a Bioruptor UCD‐250 (Cosmo Bio, Tokyo, Japan), followed by centrifugation of the lysate at 20,000 × g for 10 min at 4°C. Cleared supernatant (200 μl) was loaded onto a 2 ml 5–30% (v/v) glycerol gradient prepared in RSB100 buffer containing 0.5% Triton X‐100 and 1% protease inhibitor cocktail. The gradient was centrifuged at 288,000 × g in a SW41 rotor (Hitachi, Tokyo, Japan) for 3 h at 4°C, and 24 fractions were collected using a Gradient Fractionator (BioComp Instruments, New Brunswick, Canada).
Northern blotting analysis
Northern blotting was performed essentially as described previously (Sudo et al, 2016). The probes were labeled with biotin using BioProbe 3′‐Oligonucleotide Labeling Kit with Bio‐16‐ddUTP (Enzo Life Sciences, Farmingdale, NY). Nucleotide sequences of ITS1 and ITS2 probes to detect pre‐rRNAs were described previously (Hiraishi et al, 2018).
Author contributions
KI carried out most of the experiments. YF, TTay, and RO‐M carried out microarray analysis. MK generated KO cells and performed infection studies using KO cells. GA and KT supported infection experiments. TY conducted imaging analysis. NI, AS, RN, and YS carried out NGS analysis and bioinformatics analysis. TTan and SM carried out Northern blotting. KI, AT, YI, MN, TY, THJ, and NA designed the study and wrote the manuscript.
Conflict of interest
The authors declare that they have no conflict of interest.
Supporting information
Expanded View Figures PDF
Table EV1
Table EV2
Table EV3
Table EV4
Table EV5
Table EV6
Table EV7
Table EV8
Table EV9
Table EV10
Table EV11
Table EV12
Table EV13
Table EV14
Table EV15
Source Data for Expanded View
Review Process File
Source Data for Figure 4
Acknowledgements
We thank Dr. Y. Hayashi (Tohoku University) for fruitful discussion and critical comments on the manuscript. We would like to thank the ENCODE project for ChIP‐seq data for histone modifications. This work was financially supported by the Ministry of Education, Culture, Sports, Science, and Technology of Japan (MEXT) KAKENHI Grant Numbers 15H04642, 25253029, 15K07923, and 15J04318, and a Grant‐in‐Aid for Scientific Research on Innovative Areas “Transcription Cycle” and “Functional machinery for non‐coding RNAs“. Massive sequence analysis was supported by MEXT KAKENHI (No. 221S0002). This study was also financially supported by a Research Fellowship of the Japan Society for the Promotion of Science, Takeda Science Foundation, The Uehara Memorial Foundation, and Mochida Memorial Foundation for Medical and Pharmaceutical Research.
The EMBO Journal (2018) 37: e97723
See also: https://doi.org/10.15252/embj.201899875 (July 2018)
References
- Afonso‐Grunz F, Hoffmeier K, Muller S, Westermann AJ, Rotter B, Vogel J, Winter P, Kahl G (2015) Dual 3′Seq using deepSuperSAGE uncovers transcriptomes of interacting Salmonella enterica Typhimurium and human host cells. BMC Genom 16: 323 [DOI] [PMC free article] [PubMed] [Google Scholar]
- Allmang C, Petfalski E, Podtelejnikov A, Mann M, Tollervey D, Mitchell P (1999) The yeast exosome and human PM‐Scl are related complexes of 3′ –> 5′ exonucleases. Genes Dev 13: 2148–2158 [DOI] [PMC free article] [PubMed] [Google Scholar]
- Alonso CR (2012) A complex “mRNA degradation code” controls gene expression during animal development. Trends Genet 28: 78–88 [DOI] [PubMed] [Google Scholar]
- Andersson R, Gebhard C, Miguel‐Escalada I, Hoof I, Bornholdt J, Boyd M, Chen Y, Zhao X, Schmidl C, Suzuki T, Ntini E, Arner E, Valen E, Li K, Schwarzfischer L, Glatz D, Raithel J, Lilje B, Rapin N, Bagger FO et al (2014) An atlas of active enhancers across human cell types and tissues. Nature 507: 455–461 [DOI] [PMC free article] [PubMed] [Google Scholar]
- Bhavsar AP, Brown NF, Stoepel J, Wiermer M, Martin DD, Hsu KJ, Imami K, Ross CJ, Hayden MR, Foster LJ, Li X, Hieter P, Finlay BB (2013) The Salmonella type III effector SspH2 specifically exploits the NLR co‐chaperone activity of SGT1 to subvert immunity. PLoS Pathog 9: e1003518 [DOI] [PMC free article] [PubMed] [Google Scholar]
- Brawn LC, Hayward RD, Koronakis V (2007) Salmonella SPI1 effector SipA persists after entry and cooperates with a SPI2 effector to regulate phagosome maturation and intracellular replication. Cell Host Microbe 1: 63–75 [DOI] [PMC free article] [PubMed] [Google Scholar]
- Bresson SM, Conrad NK (2013) The human nuclear poly(a)‐binding protein promotes RNA hyperadenylation and decay. PLoS Genet 9: e1003893 [DOI] [PMC free article] [PubMed] [Google Scholar]
- Carpenter S, Aiello D, Atianand MK, Ricci EP, Gandhi P, Hall LL, Byron M, Monks B, Henry‐Bezy M, Lawrence JB, O'Neill LA, Moore MJ, Caffrey DR, Fitzgerald KA (2013) A long noncoding RNA mediates both activation and repression of immune response genes. Science 341: 789–792 [DOI] [PMC free article] [PubMed] [Google Scholar]
- Cinghu S, Yang P, Kosak JP, Conway AE, Kumar D, Oldfield AJ, Adelman K, Jothi R (2017) Intragenic enhancers attenuate host gene expression. Mol Cell 68: 104–117 e6 [DOI] [PMC free article] [PubMed] [Google Scholar]
- Datsenko KA, Wanner BL (2000) One‐step inactivation of chromosomal genes in Escherichia coli K‐12 using PCR products. Proc Natl Acad Sci USA 97: 6640–6645 [DOI] [PMC free article] [PubMed] [Google Scholar]
- Dorighi KM, Swigut T, Henriques T, Bhanu NV, Scruggs BS, Nady N, Still CD II, Garcia BA, Adelman K, Wysocka J (2017) Mll3 and Mll4 facilitate enhancer RNA synthesis and transcription from promoters independently of H3K4 monomethylation. Mol Cell 66: 568–576 e4 [DOI] [PMC free article] [PubMed] [Google Scholar]
- Eisenreich W, Dandekar T, Heesemann J, Goebel W (2010) Carbon metabolism of intracellular bacterial pathogens and possible links to virulence. Nat Rev Microbiol 8: 401–412 [DOI] [PubMed] [Google Scholar]
- Ernst J, Kheradpour P, Mikkelsen TS, Shoresh N, Ward LD, Epstein CB, Zhang X, Wang L, Issner R, Coyne M, Ku M, Durham T, Kellis M, Bernstein BE (2011) Mapping and analysis of chromatin state dynamics in nine human cell types. Nature 473: 43–49 [DOI] [PMC free article] [PubMed] [Google Scholar]
- Fasken MB, Leung SW, Banerjee A, Kodani MO, Chavez R, Bowman EA, Purohit MK, Rubinson ME, Rubinson EH, Corbett AH (2011) Air1 zinc knuckles 4 and 5 and a conserved IWRXY motif are critical for the function and integrity of the Trf4/5‐Air1/2‐Mtr4 polyadenylation (TRAMP) RNA quality control complex. J Biol Chem 286: 37429–37445 [DOI] [PMC free article] [PubMed] [Google Scholar]
- Gomez JA, Wapinski OL, Yang YW, Bureau JF, Gopinath S, Monack DM, Chang HY, Brahic M, Kirkegaard K (2013) The NeST long ncRNA controls microbial susceptibility and epigenetic activation of the interferon‐gamma locus. Cell 152: 743–754 [DOI] [PMC free article] [PubMed] [Google Scholar]
- Hiraishi N, Ishida YI, Sudo H, Nagahama M (2018) WDR74 participates in an early cleavage of the pre‐rRNA processing pathway in cooperation with the nucleolar AAA‐ATPase NVL2. Biochem Biophys Res Commun 495: 116–123 [DOI] [PubMed] [Google Scholar]
- Hirose T, Virnicchi G, Tanigawa A, Naganuma T, Li R, Kimura H, Yokoi T, Nakagawa S, Benard M, Fox AH, Pierron G (2014) NEAT1 long noncoding RNA regulates transcription via protein sequestration within subnuclear bodies. Mol Biol Cell 25: 169–183 [DOI] [PMC free article] [PubMed] [Google Scholar]
- Imamachi N, Tani H, Mizutani R, Imamura K, Irie T, Suzuki Y, Akimitsu N (2014) BRIC‐seq: a genome‐wide approach for determining RNA stability in mammalian cells. Methods 67: 55–63 [DOI] [PubMed] [Google Scholar]
- Imamura K, Akimitsu N (2014) Long non‐coding RNAs involved in immune responses. Front Immunol 5: 573 [DOI] [PMC free article] [PubMed] [Google Scholar]
- Imamura K, Imamachi N, Akizuki G, Kumakura M, Kawaguchi A, Nagata K, Kato A, Kawaguchi Y, Sato H, Yoneda M, Kai C, Yada T, Suzuki Y, Yamada T, Ozawa T, Kaneki K, Inoue T, Kobayashi M, Kodama T, Wada Y et al (2014) Long noncoding RNA NEAT1‐dependent SFPQ relocation from promoter region to paraspeckle mediates IL8 expression upon immune stimuli. Mol Cell 53: 393–406 [DOI] [PubMed] [Google Scholar]
- Januszyk K, Lima CD (2014) The eukaryotic RNA exosome. Curr Opin Struct Biol 24: 132–140 [DOI] [PMC free article] [PubMed] [Google Scholar]
- Jensen TH, Jacquier A, Libri D (2013) Dealing with pervasive transcription. Mol Cell 52: 473–484 [DOI] [PubMed] [Google Scholar]
- Kammerl IE, Meiners S (2016) Proteasome function shapes innate and adaptive immune responses. Am J Physiol Lung Cell Mol Physiol 311: L328–L336 [DOI] [PubMed] [Google Scholar]
- Keene JD (2010) Minireview: global regulation and dynamics of ribonucleic Acid. Endocrinology 151: 1391–1397 [DOI] [PMC free article] [PubMed] [Google Scholar]
- Keestra‐Gounder AM, Tsolis RM, Baumler AJ (2015) Now you see me, now you don't: the interaction of Salmonella with innate immune receptors. Nat Rev Microbiol 13: 206–216 [DOI] [PubMed] [Google Scholar]
- Kilchert C, Wittmann S, Vasiljeva L (2016) The regulation and functions of the nuclear RNA exosome complex. Nat Rev Mol Cell Biol 17: 227–239 [DOI] [PubMed] [Google Scholar]
- Kim TK, Hemberg M, Gray JM, Costa AM, Bear DM, Wu J, Harmin DA, Laptewicz M, Barbara‐Haley K, Kuersten S, Markenscoff‐Papadimitriou E, Kuhl D, Bito H, Worley PF, Kreiman G, Greenberg ME (2010) Widespread transcription at neuronal activity‐regulated enhancers. Nature 465: 182–187 [DOI] [PMC free article] [PubMed] [Google Scholar]
- Lam MT, Cho H, Lesch HP, Gosselin D, Heinz S, Tanaka‐Oishi Y, Benner C, Kaikkonen MU, Kim AS, Kosaka M, Lee CY, Watt A, Grossman TR, Rosenfeld MG, Evans RM, Glass CK (2013) Rev‐Erbs repress macrophage gene expression by inhibiting enhancer‐directed transcription. Nature 498: 511–515 [DOI] [PMC free article] [PubMed] [Google Scholar]
- Li W, Notani D, Ma Q, Tanasa B, Nunez E, Chen AY, Merkurjev D, Zhang J, Ohgi K, Song X, Oh S, Kim HS, Glass CK, Rosenfeld MG (2013) Functional roles of enhancer RNAs for oestrogen‐dependent transcriptional activation. Nature 498: 516–520 [DOI] [PMC free article] [PubMed] [Google Scholar]
- Li W, Notani D, Rosenfeld MG (2016) Enhancers as non‐coding RNA transcription units: recent insights and future perspectives. Nat Rev Genet 17: 207–223 [DOI] [PubMed] [Google Scholar]
- Lubas M, Christensen MS, Kristiansen MS, Domanski M, Falkenby LG, Lykke‐Andersen S, Andersen JS, Dziembowski A, Jensen TH (2011) Interaction profiling identifies the human nuclear exosome targeting complex. Mol Cell 43: 624–637 [DOI] [PubMed] [Google Scholar]
- Lubas M, Andersen PR, Schein A, Dziembowski A, Kudla G, Jensen TH (2015) The human nuclear exosome targeting complex is loaded onto newly synthesized RNA to direct early ribonucleolysis. Cell Rep 10: 178–192 [DOI] [PubMed] [Google Scholar]
- Lykke‐Andersen S, Jensen TH (2015) Nonsense‐mediated mRNA decay: an intricate machinery that shapes transcriptomes. Nat Rev Mol Cell Biol 16: 665–677 [DOI] [PubMed] [Google Scholar]
- Maekawa S, Imamachi N, Irie T, Tani H, Matsumoto K, Mizutani R, Imamura K, Kakeda M, Yada T, Sugano S, Suzuki Y, Akimitsu N (2015) Analysis of RNA decay factor mediated RNA stability contributions on RNA abundance. BMC Genom 16: 154 [DOI] [PMC free article] [PubMed] [Google Scholar]
- Mao AP, Shen J, Zuo Z (2015) Expression and regulation of long noncoding RNAs in TLR4 signaling in mouse macrophages. BMC Genom 16: 45 [DOI] [PMC free article] [PubMed] [Google Scholar]
- Maudet C, Mano M, Sunkavalli U, Sharan M, Giacca M, Forstner KU, Eulalio A (2014) Functional high‐throughput screening identifies the miR‐15 microRNA family as cellular restriction factors for Salmonella infection. Nat Commun 5: 4718 [DOI] [PubMed] [Google Scholar]
- Melo CA, Drost J, Wijchers PJ, van de Werken H, de Wit E, Oude Vrielink JA, Elkon R, Melo SA, Leveille N, Kalluri R, de Laat W, Agami R (2013) eRNAs are required for p53‐dependent enhancer activity and gene transcription. Mol Cell 49: 524–535 [DOI] [PubMed] [Google Scholar]
- Meola N, Domanski M, Karadoulama E, Chen Y, Gentil C, Pultz D, Vitting‐Seerup K, Lykke‐Andersen S, Andersen JS, Sandelin A, Jensen TH (2016) Identification of a nuclear exosome decay pathway for processed transcripts. Mol Cell 64: 520–533 [DOI] [PubMed] [Google Scholar]
- Ne II, Heward JA, Roux B, Tsitsiou E, Fenwick PS, Lenzi L, Goodhead I, Hertz‐Fowler C, Heger A, Hall N, Donnelly LE, Sims D, Lindsay MA (2014) Long non‐coding RNAs and enhancer RNAs regulate the lipopolysaccharide‐induced inflammatory response in human monocytes. Nat Commun 5: 3979 [DOI] [PMC free article] [PubMed] [Google Scholar]
- Ogura Y, Sutterwala FS, Flavell RA (2006) The inflammasome: first line of the immune response to cell stress. Cell 126: 659–662 [DOI] [PubMed] [Google Scholar]
- Quinn JJ, Chang HY (2016) Unique features of long non‐coding RNA biogenesis and function. Nat Rev Genet 17: 47–62 [DOI] [PubMed] [Google Scholar]
- Sasaki YT, Ideue T, Sano M, Mituyama T, Hirose T (2009) MENepsilon/beta noncoding RNAs are essential for structural integrity of nuclear paraspeckles. Proc Natl Acad Sci USA 106: 2525–2530 [DOI] [PMC free article] [PubMed] [Google Scholar]
- Schneider C, Tollervey D (2013) Threading the barrel of the RNA exosome. Trends Biochem Sci 38: 485–493 [DOI] [PMC free article] [PubMed] [Google Scholar]
- Schott J, Stoecklin G (2010) Networks controlling mRNA decay in the immune system. Wiley Interdiscip Rev RNA 1: 432–456 [DOI] [PubMed] [Google Scholar]
- Schulte LN, Eulalio A, Mollenkopf HJ, Reinhardt R, Vogel J (2011) Analysis of the host microRNA response to Salmonella uncovers the control of major cytokines by the let‐7 family. EMBO J 30: 1977–1989 [DOI] [PMC free article] [PubMed] [Google Scholar]
- St John AL, Abraham SN (2009) Salmonella disrupts lymph node architecture by TLR4‐mediated suppression of homeostatic chemokines. Nat Med 15: 1259–1265 [DOI] [PMC free article] [PubMed] [Google Scholar]
- Sudo H, Nozaki A, Uno H, Ishida Y, Nagahama M (2016) Interaction properties of human TRAMP‐like proteins and their role in pre‐rRNA 5′ETS turnover. FEBS Lett 590: 2963–2972 [DOI] [PubMed] [Google Scholar]
- Szczepinska T, Kalisiak K, Tomecki R, Labno A, Borowski LS, Kulinski TM, Adamska D, Kosinska J, Dziembowski A (2015) DIS3 shapes the RNA polymerase II transcriptome in humans by degrading a variety of unwanted transcripts. Genome Res 25: 1622–1633 [DOI] [PMC free article] [PubMed] [Google Scholar]
- Tani H, Mizutani R, Salam KA, Tano K, Ijiri K, Wakamatsu A, Isogai T, Suzuki Y, Akimitsu N (2012) Genome‐wide determination of RNA stability reveals hundreds of short‐lived noncoding transcripts in mammals. Genome Res 22: 947–956 [DOI] [PMC free article] [PubMed] [Google Scholar]
- Tani H, Imamachi N, Mizutani R, Imamura K, Kwon Y, Miyazaki S, Maekawa S, Suzuki Y, Akimitsu N (2015) Genome‐wide analysis of long noncoding RNA turnover. Methods Mol Biol 1262: 305–320 [DOI] [PubMed] [Google Scholar]
- Thoms M, Thomson E, Bassler J, Gnadig M, Griesel S, Hurt E (2015) The exosome is recruited to RNA substrates through specific adaptor proteins. Cell 162: 1029–1038 [DOI] [PubMed] [Google Scholar]
- Trapnell C, Pachter L, Salzberg SL (2009) TopHat: discovering splice junctions with RNA‐Seq. Bioinformatics 25: 1105–1111 [DOI] [PMC free article] [PubMed] [Google Scholar]
- Vogels MW, van Balkom BW, Heck AJ, de Haan CA, Rottier PJ, Batenburg JJ, Kaloyanova DV, Helms JB (2011) Quantitative proteomic identification of host factors involved in the Salmonella typhimurium infection cycle. Proteomics 11: 4477–4491 [DOI] [PMC free article] [PubMed] [Google Scholar]
- Westermann AJ, Forstner KU, Amman F, Barquist L, Chao Y, Schulte LN, Muller L, Reinhardt R, Stadler PF, Vogel J (2016) Dual RNA‐seq unveils noncoding RNA functions in host‐pathogen interactions. Nature 529: 496–501 [DOI] [PubMed] [Google Scholar]
Associated Data
This section collects any data citations, data availability statements, or supplementary materials included in this article.
Supplementary Materials
Expanded View Figures PDF
Table EV1
Table EV2
Table EV3
Table EV4
Table EV5
Table EV6
Table EV7
Table EV8
Table EV9
Table EV10
Table EV11
Table EV12
Table EV13
Table EV14
Table EV15
Source Data for Expanded View
Review Process File
Source Data for Figure 4