

Abstract
The orientation of the mitotic spindle (MS) is tightly regulated, but the molecular mechanisms are incompletely understood. Here we report a novel role for the multifunctional adaptor protein ALG‐2‐interacting protein X (ALIX) in regulating MS orientation in addition to its well‐established role in cytokinesis. We show that ALIX is recruited to the pericentriolar material (PCM) of the centrosomes and promotes correct orientation of the MS in asymmetrically dividing Drosophila stem cells and epithelial cells, and symmetrically dividing Drosophila and human epithelial cells. ALIX‐deprived cells display defective formation of astral microtubules (MTs), which results in abnormal MS orientation. Specifically, ALIX is recruited to the PCM via Drosophila Spindle defective 2 (DSpd‐2)/Cep192, where ALIX promotes accumulation of γ‐tubulin and thus facilitates efficient nucleation of astral MTs. In addition, ALIX promotes MT stability by recruiting microtubule‐associated protein 1S (MAP1S), which stabilizes newly formed MTs. Altogether, our results demonstrate a novel evolutionarily conserved role of ALIX in providing robustness to the orientation of the MS by promoting astral MT formation during asymmetric and symmetric cell division.
Keywords: ALIX, MAP1S, microtubule, mitotic spindle orientation, γ‐tubulin
Subject Categories: Cell Adhesion, Polarity & Cytoskeleton; Cell Cycle
Introduction
During cell division, the mitotic spindle (MS) that forms between the two centrosomes ensures faithful segregation of the chromosomes between the two daughter cells, positions the cleavage furrow, and is anchored to the cell cortex to ensure proper spindle orientation. Different subpopulations of microtubules (MTs); the kinetochore, interpolar/astral, and astral MTs, are involved in controlling each process, respectively (Kiyomitsu, 2015; Meraldi, 2016). Correct orientation of the MS ensures proper segregation of molecules defining cell fate and is important during asymmetric stem cell division to generate one daughter cell which self‐renews and one which undergoes differentiation (Chen et al, 2016a). The orientation of the MS further defines the cleavage plane of the cell and thereby its position within the tissue, exemplified by the planar division of epithelial cells to generate a monolayered epithelium (Kiyomitsu, 2015; di Pietro et al, 2016). The precise orientation of the MS can be influenced by internal cues (cell polarity determinants) or external cues (neighboring cells or extracellular matrix) and is cell type‐dependent (Morin & Bellaiche, 2011; Inaba & Yamashita, 2012; Chen et al, 2016a; di Pietro et al, 2016).
Regardless of the molecular mechanisms setting the orientation, the MS is anchored to the cell cortex by the astral MTs radiating from the centrosomes (di Pietro et al, 2016). The centrosome is the major MT‐organizing center in most cell types and nucleates astral MTs and the other MT subpopulations of the MS (Sanchez & Feldman, 2017). The centrosome is composed of a centriole pair and the surrounding pericentriolar material (PCM), generated by dynamic assembly of proteins found to stabilize each other via positive feedback loops (Pihan, 2013; Woodruff et al, 2014; Lattao et al, 2017; Paz & Luders, 2018). During mitosis, the centrosome matures when the PCM expands extensively due to recruitment of scaffold and MT nucleating proteins, which promote MS formation (Pihan, 2013; Woodruff et al, 2014; Lattao et al, 2017; Paz & Luders, 2018). The γ‐tubulin ring complexes (γTuRCs) of the PCM, composed of γ‐tubulin and associated proteins (γ‐tubulin complex proteins, GCPs), nucleate MT filaments at the centrosome (Sulimenko et al, 2017). The ring of γ‐tubulin within γTuRC resembles the MT geometry and serves as a template for assembly of α/β‐tubulin‐dimers, which polymerize into long filaments, MTs (Akhmanova & Steinmetz, 2015). Although the centrosomes represent the major centers for MT nucleation, MTs may alternatively be formed at the Golgi, chromosomes, nuclear envelope, plasma membrane, and pre‐existing MTs. Importantly, γ‐tubulin seems to be implicated in the nucleation process regardless of the intracellular localization (Sulimenko et al, 2017).
Microtubules of the MS, including the astral MTs, are dynamic and their timely assembly and disassembly is tightly controlled by proteins regulating nucleation, severing, and stability of the filaments (di Pietro et al, 2016). MT stability is regulated by MT‐associated proteins (MAPs; Akhmanova & Steinmetz, 2015). These proteins stabilize MTs by binding to the growing plus‐end of the filaments to prevent catastrophe, or alternatively, by decorating the MTs to prevent interaction with severing proteins. Furthermore, the γTuRC itself has also been reported to modulate the stability of MTs by interacting with motor proteins such as dynein, kinesin‐5, and kinesin‐14 as well as the plus‐end tracking protein EB1 (Oakley et al, 2015).
Astral MT regulation occurs at several levels to achieve proper MS orientation: (i) astral MT nucleation at the centrosomes, (ii) astral MT dynamics and stability, and (iii) astral MT anchoring and behavior at the cell cortex (di Pietro et al, 2016). Aberrant regulation of astral MTs has been shown to correlate with spindle misorientation (di Pietro et al, 2016). For example, centrosomal proteins regulating γTuRC‐mediated nucleation of MTs and MAPs controlling MT stability have been shown to regulate spindle orientation in their capacity of modulating MT dynamics (Chen et al, 2014; di Pietro et al, 2016). Despite the emerging insight into how astral MT formation is controlled to ensure proper MS orientation, the molecular mechanisms are incompletely understood.
We and others have previously reported that the multifunctional adaptor protein ALG‐2‐interacting protein X (ALIX) localizes to centrosomes in interphase (Morita et al, 2007) and during cell division (Eikenes et al, 2015). However, the biological roles of centrosomal ALIX are not known. Extensive research has implicated ALIX in a diversity of cellular processes, such as apoptosis, endocytosis and endosome biogenesis, cell adhesion, virus release, plasma membrane repair, and cytokinesis (Bissig & Gruenberg, 2014). Specifically, ALIX controls cytokinesis by participating in recruiting abscission‐promoting proteins of the endosomal sorting complex required for transport (ESCRT) to the midbody (Carlton & Martin‐Serrano, 2007; Morita et al, 2007; Carlton et al, 2008; Eikenes et al, 2015; Christ et al, 2016). In the current study, we investigate the role of centrosomal ALIX during cell division. We show that ALIX localizes to the PCM, where it interacts with and stabilizes γTuRC, thus promoting efficient nucleation of astral MTs. In addition, centrosomal ALIX recruits MAP1S, which stabilizes the newly formed MTs radiating from the centrosomes. We conclude that ALIX facilitates efficient formation of astral MTs by stimulating their nucleation and stabilization, which promotes correct MS orientation during both asymmetric and symmetric cell division.
Results
ALIX is recruited to the PCM during cell division
The Drosophila neuroblasts (NBs) represent a powerful model to study centrosomes and centrosome function in vivo (Gonzalez, 2007; Conduit et al, 2015). To investigate the subcellular localization of ALIX during NB division, we dissected and stained brains of third‐instar larvae for ALIX, α‐tubulin, and the centriolar protein Asterless (Asl; Fig 1A). From early prometaphase throughout telophase, ALIX was detected at the centrosomes together with Asl (Fig 1A). Furthermore, ALIX seems to be a general centrosomal protein, evidenced by its presence at the centrosomes also in Drosophila follicle epithelial cells (FECs) and HeLa cells (Fig 1C and D). The specific ALIX immunodetection at centrosomes in Drosophila and human cells was confirmed by its significantly reduced centrosomal detection upon RNAi‐mediated ALIX downregulation (P < 0.05; Fig EV1A and B).
Figure 1. ALIX localizes to the pericentriolar material (PCM) of centrosomes in NBs, FECs, and HeLa cells.

- Brains dissected from Drosophila larvae were immunostained with anti‐ALIX (red), Asl (white) and α‐tubulin (green), and Hoechst (blue). Representative confocal micrographs of NBs in different mitotic phases (prometaphase to early telophase) are presented. In the upper panel, the location of the centrosomes is indicated with arrows and the centrosome with more accumulated ALIX is marked (*). Scale bars, 5 μm.
- Brains of w 1118 larvae were stained with anti‐ALIX (white), anti‐Cnn (white) or anti‐Asl (white), and Hoechst (blue). The average ratios of centrosomal intensities (strongest/weakest) (± SE) of ALIX, Cnn, and Asl calculated from 77, 76, and 56 metaphase NBs, respectively, are indicated below the micrographs (from at least three experiments). Scale bars, 5 μm.
- Ovaries dissected from adult flies were immunostained with anti‐ALIX (red), Asl (white) and α‐tubulin (green), and Hoechst (blue). Representative confocal micrographs of FECs in metaphase are presented. Scale bars, 5 μm.
- HeLa cells were immunostained with anti‐ALIX (red), anti‐glutamylated tubulin (green), and Hoechst (blue). A widefield micrograph of a representative metaphase cell is shown in the left panel (scale bar, 5 μm), and the insets show close‐ups of the centrosomes. The white arrow indicates the direction of the line scan analysis performed in (E).
- Line scan analysis of the fluorescent distribution of ALIX and glutamylated tubulin at the centrosomes. The average intensity (± SE) of 26 centrosomes from three independent experiments is shown graphically.
Figure EV1. ALIX controls MS orientation in Drosophila NBs.
-
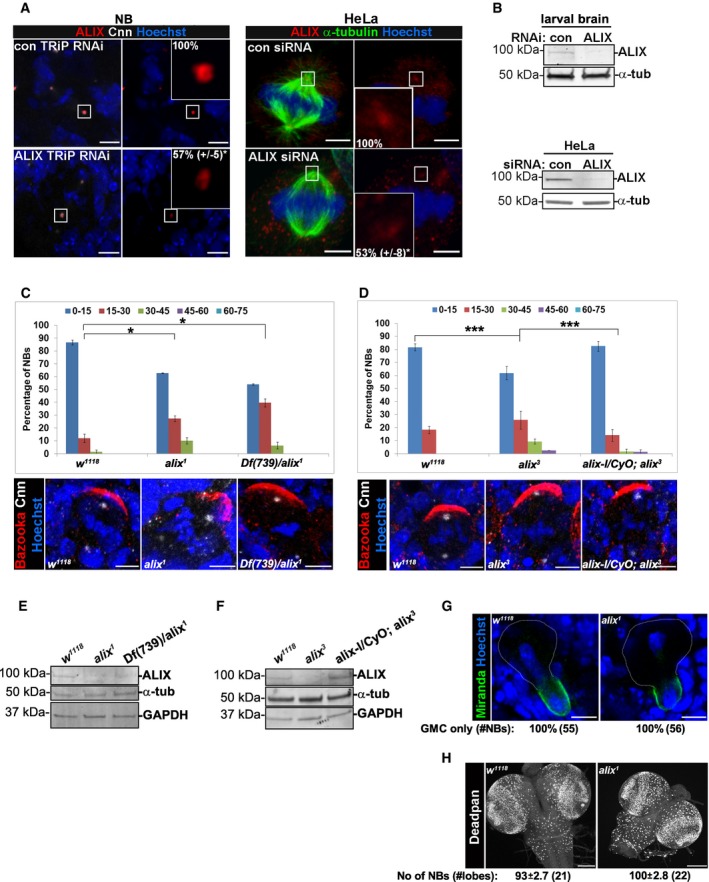
ABrains of control TRiP RNAi and alix TRiP RNAi larvae were immunostained with anti‐ALIX (red), anti‐Cnn (white), and Hoechst (blue) (left panel). HeLa cells transfected with control or ALIX siRNA were stained with anti‐ALIX (red), anti‐α‐tubulin (green), and Hoechst (blue) (right panel). Scale bars, 5 μm. The average fluorescence intensity of centrosomal ALIX was determined and found to be decreased in ALIX‐depleted NBs (to 56.8 ± 5.1%, *P < 0.05, Student's t‐test) and HeLa cells (53.2 ± 8.3%, *P < 0.05, Student's t‐test) relative to their respective controls (set to 100%). The centrosomal average intensity of 35 control TRiP RNAi NBs, 28 alix TRiP RNAi NBs, 20 control siRNA HeLa cells, and 14 ALIX siRNA HeLa cells from three experiments (± SE) is presented.
-
BBrain lysates prepared from control or ALIX TRiP RNAi larvae (upper panel) or control and ALIX siRNA HeLa cells (lower panel) were subjected to Western blotting analysis to determine the expression levels of ALIX and α‐tubulin.
-
C, DBrains of w 1118, alix 1, and Df(739)/alix 1 larvae (C) or w 1118, alix 3, and alix‐l/CyO; alix 3 larvae (D) were immunostained with anti‐Bazooka (red), anti‐Cnn (white), and Hoechst (blue). Typical confocal images are shown. Scale bars, 5 μm. The average relative spindle angle (± SE) of (C) w 1118 = 48, alix 1 = 43, Df(739)/alix 1 = 50 NBs (three separate experiments) or (D), w 1118 = 95, alix 3 = 69, alix‐l/CyO; alix 3 = 52 (three separate experiments) were determined. Compared to w 1118 NBs, both alix 1 NBs and Df(739)/alix 1 NBs showed a greater variation of the relative spindle angle (*P < 0.05, ANOVA). No significant difference was observed between alix 1 NBs and Df(739)/alix 1 NBs (C). Likewise, alix 3 NBs displayed more variable relative spindle angles compared to either w 1118 NBs or alix‐l/CyO; alix 3 NBs (***P < 0.001, ANOVA) (D). However, there was not a significant different variation of the relative spindle angles between w 1118 NBs and alix‐l/CyO; alix 3 NBs.
-
E, FWestern blotting analysis showed expression of ALIX in w 1118 larval brains, lack of detectable ALIX in the brains from alix 3 , alix 1, and Df(739)/alix 1 larvae and restored expression of ALIX in brains of alix‐l/CyO; alix 3 larvae. The immunodetectable levels of α‐tubulin and GAPDH (loading control) were also assessed.
-
GBrains of w 1118 and alix 1 larvae were stained with anti‐Miranda (green) and Hoechst (blue). The percentages of NBs in telophase with complete segregation into the future GMC are calculated (± SE) from 55 w 1118 NBs and 56 alix 1 NBs (three separate experiments). The future NB is outlined. Scale bars, 5 μm.
-
HBrains of w 1118 and alix 1 larvae were stained with anti‐Deadpan (white). The average number of NBs per brain lobe (± SE) was scored from 21 wild type and 22 alix 1 larval brains (three independent experiments). Scale bars, 10 μm.
Source data are available online for this figure.
Interestingly, during prometaphase in NBs, the ALIX staining was more evident at one centrosome compared to the other (indicated with asterisk), whereas the Asl‐staining of the two centrioles was similar (Fig 1A, upper panel). During the cell cycle, not only the genome but also the centrosome duplicates (Fujita et al, 2016). In NBs, one of the centrosomes maintains its PCM and MT‐organizing activity and stays apically in the cell, whereas the other centrosome loses the PCM and moves extensively until shortly before mitosis, when it begins reassembling PCM at the basal side of the cell (Rebollo et al, 2007). Consequently, during early phases of mitosis the PCM of the apically localized centrosome appears larger than that of the basal centrosome (Rebollo et al, 2007). Thus, the uneven intensity of ALIX we observed at the two centrosomes in prometaphase indicates that ALIX associates with the PCM rather than the centrioles. Furthermore, this asymmetric distribution of ALIX as well as of another PCM protein, Centrosomin (Cnn), was also evident in metaphase NBs (Fig 1B, whereas the centriolar Asl intensity was similar), most likely reflecting a maintained PCM asymmetry also later in mitosis. We further investigated the intra‐centrosomal localization of ALIX in HeLa cells. Widefield fluorescence microscopy indicated that ALIX surrounds the pair of centrioles stained with an antibody recognizing glutamylated tubulin (Fig 1D). Accordingly, a line scan analysis, across the centrosomes (as indicated by the white arrow in inset 1, Fig 1D), indicated that glutamylated tubulin‐enriched centrioles are generally located at one side of the centrosomes, and therefore, the line scans were always drawn from this end, resulting in an apparently asymmetric localization of the centrioles in the scan plot (Fig 1E). Most likely, this reflects the compact centrosome structures in metaphase cells, previously shown by super‐resolution imaging (Sonnen et al, 2012). Further, the line scan analysis showed a wider distribution peak of ALIX (0.72 μm) in comparison with glutamylated tubulin enriched at the centrioles (0.48 μm), suggesting that ALIX is located at the PCM also in human cells (Fig 1E). Collectively, these findings suggest that ALIX is part of the PCM in human cells as well as in fly cells.
ALIX is recruited to the PCM by DSpd‐2/Cep192
To characterize the recruitment of ALIX to the PCM, we determined the centrosomal localization of ALIX in NBs of several fly strains deficient of centriolar or PCM proteins. In accordance with the defective centrosome formation observed in cells lacking essential centriolar components such as Sas‐4 and Sas‐6 (Basto et al, 2006), less ALIX, on average only 20.3 ± 3.2% of w 1118 (wild‐type) levels (P < 0.05), and Asl, were detected at the spindle poles in the NBs in sas‐6 c02901 brains (Fig 2A and B). In NBs deficient of γ‐tubulin (γ‐Tub23C PI), the centrosomal localization of ALIX was not significantly different than in wild‐type NBs (Fig 2A and B). Interestingly, less ALIX was detected at the centrosomes in NBs mutant for the two PCM scaffold proteins DSpd‐2 and Cnn (Conduit et al, 2015). Specifically, in DSpd‐2 G02143 and cnn HK21 mutant NBs 29.0 ± 11.1% (P < 0.05) and 29.7 ± 6.8% (P < 0.01) of w 1118 ALIX intensity was detected, respectively (Fig 2A and B). In contrast, the centriolar protein Asl was present at the centrosomes, confirming undisturbed centriole formation in these mutant NBs, in accordance with previous reports (Giansanti et al, 2008; Conduit et al, 2010). Together, these data indicate that DSpd‐2 and Cnn are major recruiters of ALIX to the centrosome during PCM assembly.
Figure 2. DSpd‐2/Cep192 recruits ALIX to the PCM of centrosomes.
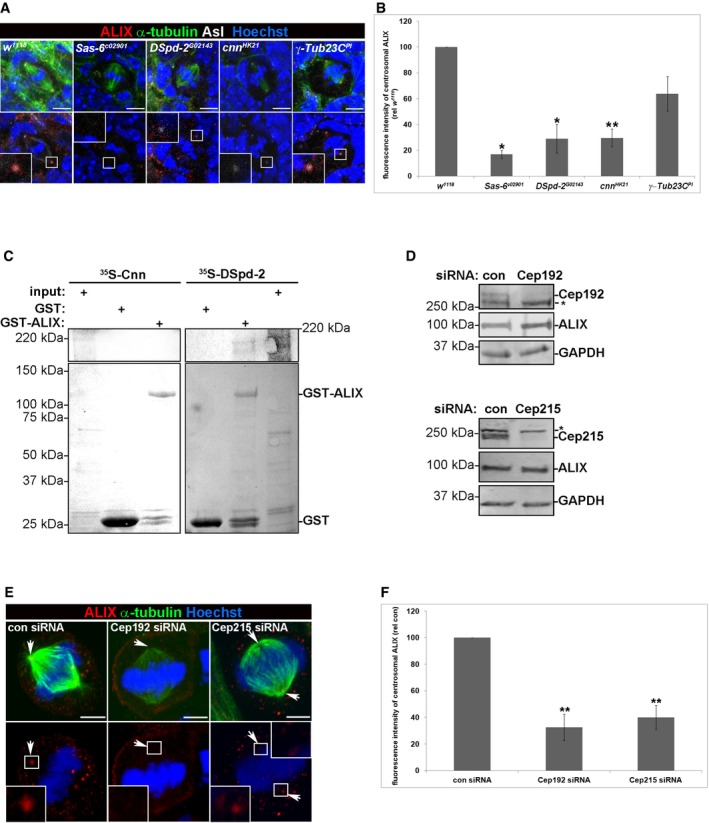
- Confocal images of ALIX (red), Asl (white), α‐tubulin (green), and Hoechst (blue) in wild‐type (w 1118), Sas‐6 c02901, DSpd G02143, cnn HK21, and γ‐Tub23C PI NBs (scale bars, 5 μm). The insets show higher magnification of the boxed centrosomes.
- The centrosomal fluorescence intensity of ALIX was measured, and the graph shows the average intensity (relative to w 1118 intensity) of three separate experiments (± SE), where in total 78 w 1118, 73 Sas‐6 c02901, 45 DSpd G02143, 61 cnn HK21, and 26 γ‐Tub23C PI NBs were analyzed. Statistically significant differences are indicated (*P < 0.05 and **P < 0.01, Student's t‐test).
- GST or GST‐ALIX were incubated with in vitro translated 35S‐labeled Cnn or DSpd‐2 proteins. Binding was detected by autoradiography (upper panel), and levels of GST and GST‐ALIX were visualized by Ponceau S‐staining (lower panel).
- HeLa cells were transfected with control, Cep192, or Cep215 siRNA. Efficient depletion of Cep192 and Cep215 was confirmed by Western blotting analysis, which also showed unchanged expression levels of ALIX. Unspecific bands, below Cep192 and above Cep215, are indicated with *. GAPDH, loading control.
- Control, Cep192, or Cep215 siRNA‐transfected HeLa cells were immunostained with anti‐ALIX (red), anti‐α‐tubulin (green), and Hoechst (blue). Confocal micrographs are presented, and the insets show the indicated centrosomes (arrows) at higher magnification (scale bars, 5 μm).
- The centrosomal ALIX fluorescence intensity was measured, and the graph shows the average intensity (relative to control siRNA cells) of three independent experiments (± SE), where in total 41 control siRNA, 40 Cep192 siRNA, and 39 Cep215 siRNA‐transfected cells were analyzed, **P < 0.01, Student's t‐test.
Source data are available online for this figure.
Interestingly, DSpd‐2 and Cnn are mutually dependent on each other for their stable centrosomal association (Giansanti et al, 2008; Conduit et al, 2010, 2014). Therefore, to characterize which of the two proteins that facilitates recruitment of ALIX to the centrosomes, we performed in vitro binding experiments. As shown in Fig 2C, recombinant GST‐ALIX pulled down in vitro translated, 35S‐methionine‐labeled DSpd‐2, but not Cnn, indicating that ALIX is recruited to the PCM by associating with DSpd‐2. In order to elucidate how ALIX is recruited to centrosomes in human cells, HeLa cells were depleted of Cep192 or Cep215, the human orthologues of DSpd‐2 and Cnn, respectively. The efficient depletion of either of these two PCM proteins was confirmed by Western blotting analysis, which also indicated that the total cellular expression of ALIX remained unchanged (Fig 2D). Consistent with the results from NBs, Cep192 and Cep215 were important for the recruitment of ALIX to the centrosomes (Fig 2E and F). Specifically, centrosomal ALIX intensities dropped to 32.6 ± 9.8% (P < 0.01) and 40.1 ± 9.0% (P < 0.01), respectively, of control levels upon Cep192 and Cep215 depletion in HeLa cells (Fig 2E and F). Together, these data indicate that DSpd‐2/Cep192 and Cnn/Cep215 are major recruiters of ALIX to the PCM in Drosophila and human cells.
ALIX regulates MS orientation in Drosophila stem cells
Next, we addressed the biological role of centrosomal ALIX during cell division. Extensive research has depicted larval NBs to be a useful model system to study MS orientation. The NBs divide asymmetrically, with the MS aligning along the apical‐basal polarity axis (Gonzalez, 2007; Siller & Doe, 2009; di Pietro et al, 2016; Santoro et al, 2016). We have previously characterized two alix mutant alleles, alix 1 and alix 3, for ALIX LOF analyses (Eikenes et al, 2015). First, we compared the MS orientation in w 1118 and alix 1‐deficient metaphase NBs (Fig 3A). As illustrated in Fig 3B, the MS orientation was calculated as the relative angle between the spindle axis (spanning the centrosomes, blue dotted line) and the polarity axis (blue line, drawn perpendicular to the apical Bazooka crescent, red dotted line). The quantifications summarized in Fig 3A show that a larger percentage of alix 1 mutant NBs displayed increased relative spindle angles compared to wild‐type NBs. The difference in MS angle distribution between wild‐type and alix 1 mutant NBs was significant (P < 0.001), thus indicating spindle misorientation in alix 1 mutant cells. However, this increased randomization of MS orientation was rescued when alix 1‐deficient flies were combined with a fly strain containing a genomic sequence compromising the ALIX gene [alix‐l/CyO; alix 1, published in Eikenes et al (2015); P < 0.001; Fig 3A]. Western blotting analysis confirmed that the expression levels of ALIX were, as expected, partially restored in this latter fly strain (Fig 3C). Importantly, in accordance with previous findings, mud 4 mutant NBs also displayed a significantly greater diversity in MS orientation compared to wild‐type NBs (P < 0.001; Bowman et al, 2006; Izumi et al, 2006; Siller et al, 2006).
Figure 3. ALIX regulates MS orientation in Drosophila NBs and asymmetrically dividing SOPs.

- Brains were dissected from w 1118, alix 1, alix‐l/CyO; alix 1, and mud 4 larvae and stained with anti‐Bazooka (red), anti‐Cnn (white), and Hoechst (blue). Representative confocal images are shown. Scale bars, 5 μm. The graph summarizes the average variation of the relative spindle angles in w 1118 (n = 74), alix 1 (n = 96), alix‐l/CyO; alix 1 (n = 78), and mud 4 (n = 32) NBs (four separate experiments) (± SE). Compared to w 1118 or alix‐l/CyO; alix 1 NBs both alix 1 and mud 4 NBs showed greater variation in MS orientation (***P < 0.001, ANOVA).
- Schematic illustration of the calculation of the relative spindle angle in NBs between the polarity axis (blue line), perpendicular to the line aligning the apical Bazooka crescent (red dotted line) and the MS axis (blue dotted line) going through the two centrosomes. The basal crescent is here indicated in green.
- Brain lysates of w 1118, alix 1, and alix‐l/CyO; alix 1 larvae were immunoblotted for ALIX, α‐tubulin, and GAPDH (loading control).
- Time‐lapse imaging of Asl‐YFP, α‐tubulin‐GFP in control (left panel), and alix 3 mutant (right panel) SOPs of the pupal notum. SOPs were identified by the apical meshwork of MTs (not shown). Time is indicated in min:sec. Mitotic cells are indicated with arrows. Scale bar represents 5 μm.
- Quantification of the rotation angle (± SE) in control (n = 26) and alix 3 (n = 45) mutant SOPs (at least three separate experiments). **P < 0.01 (Student's t‐test) compared to control. In the boxplot the dot is the mean, the line is the median and the box represents the values included between 25 and 75 percentile.
- Schematic view of the calculation of the rotation angle. The angle α1 represents the angle made between the midline (horizontal line) and the axis of the two centrosomes immediately prior to nuclear envelope breakdown (when the two centrosomes compress the nucleus). The angle α2 represents the angle between the midline and the axis of spindle at anaphase onset. The rotation angle is equal to the difference α1–α2.
- Western blotting analysis of lysates from control Asl‐YFP, α‐tubulin‐GFP and Asl‐YFP, α‐tubulin‐GFP; alix 3 pupae showed absence of ALIX in the alix 3 homozygous mutant and unchanged expression of α‐tubulin and GAPDH (loading control) compared to control lysates.
Source data are available online for this figure.
To further test whether ALIX specifically regulates the MS orientation in NBs, the alix 1 allele was combined with a deficiency lacking the alix gene (Df(3R)BSC739 (in short Df(739)). Interestingly, NBs in the brains of both Df(739)/alix 1 and alix 1 larvae showed similar and significant differences in the distribution of the MS angles compared to w 1118 NBs (P < 0.05; Fig EV1C and E). Finally, we determined the spindle orientation in larval NBs of the alix 3 mutant strain. As in alix 1 mutants, the loss of ALIX resulted in a greater variation in the MS orientation in alix 3 mutant NBs compared to wild type (P < 0.001) (Fig EV1D and F). The spindle misorientation phenotype observed in alix 3 NBs was moreover rescued in alix‐l/CyO; alix 3 NBs (P < 0.001) (Fig EV1D and F). Thus, taken together, these data show that ALIX controls the MS orientation in Drosophila NBs.
Mutation of proteins regulating the MS orientation in NBs might result in abnormal segregation of cell fate determinants and their adaptor proteins (e.g., Miranda), during telophase (Wang et al, 2006; Cabernard & Doe, 2009; Kelsom & Lu, 2012). We observed that 100% of the examined telophase alix 1 NBs showed normal segregation of Miranda into the future ganglion mother cell (GMC), indicating restoration of the spindle misorientation during telophase (i.e., telophase rescue) (Fig EV1G). Severe defects in MS misorientation in NBs can result in two daughter cells with NB identity and thus excess NBs (Kelsom & Lu, 2012; Gonzalez, 2007). However, we detected approximately the same number of NBs per brain lobe, specifically on average 93 ± 2.7 in wild‐type brains and 100 ± 2.8 in alix 1 mutant brains (Fig EV1H), in accordance with the observed telophase rescue (Fig EV1G). These data are consistent with previous reports showing that mutants of centrosomal proteins with compromised formation of astral MTs (Asl, DSpd‐2, and Cnn mutants) display overall mild defects in asymmetry of NB division (Giansanti et al, 2001, 2008; Cabernard & Doe, 2009). Our data thus indicate that the MS orientation defects in alix mutant NBs are rescued before the cell progresses through telophase.
We next sought to elucidate whether ALIX might control spindle orientation in other Drosophila stem cells. For this purpose, we used Drosophila male germline stem cells (mGSCs), which is a commonly used model system for studying spindle orientation during asymmetric stem cell division in vivo. Drosophila mGSCs are located at the testis tip, where the MS (between the two centrosomes) orients perpendicular to the neighboring hub cells of the stem cell niche (Inaba & Yamashita, 2012). We observed spindle misorientation in 23.4 ± 5.5% of the alix 1 mGCSs in contrast to only in 1.6 ± 1.5% of wild‐type mGSCs in metaphase (P < 0.05; Fig EV2A and B). Thus, our data reveal that ALIX regulates positioning of the MS in two types of asymmetrically dividing Drosophila stem cells: NBs and mGSCs.
Figure EV2. ALIX regulates spindle orientation in mGSCs, Caco‐2, and HeLa cells.

- Testes from wild‐type (w 1118) and alix 1 males were immunostained with anti‐FasIII (red), anti‐γ‐tubulin (red), anti‐phospho HistoneSer10 (PH3) (green), and Hoechst (blue). The MS axis spanning the centrosomes (indicated with arrows) was mislocalized in 23.4 ± 5.5% of the alix 1 mGSCs compared to 1.6 ± 1.6% of w 1118 mGSCs (± SE) (*P < 0.05, Student's t‐test). Scale bars, 5 μm.
- Western blot showing ALIX expression in w 1118 testes but not in alix 1 testes, and equal expression of GAPDH (loading control) in both genotypes.
- Quantification of the mitotic spindle rotation velocity (°/min) (± SE) of control (n = 26) and alix 3 mutant (n = 45) SOPs from centrosome separation until telophase as determined from the same live imaging movies as in Fig 3E. **P < 0.01 (Student's t‐test) compared to control. In the boxplot the dot is the mean, the line is the median and the box represents the values included between 25 and 75 percentile.
- Western blotting analysis determining the expression levels of ALIX and α‐tubulin in Caco‐2 cells transfected with control siRNA, ALIX siRNA#2, or ALIX siRNA#3.
- Caco‐2 cells described in (D) were grown in organoids, fixed, and stained with rhodamine‐phalloidin (red), anti‐α‐tubulin (green), and Hoechst (blue). Scale bars, 5 μm. The relative angle between the spindle axis and the polarity axis (perpendicular to the apical membrane indicated with an asterisk) was determined. The average distribution of relative angles (± SE) from at least three separate experiments (43 control, 41 ALIX siRNA#2, and 38 ALIX siRNA#3 cells) is shown. Both ALIX siRNA#2 and siRNA#3 cells displayed greater variation of the relative spindle angles than control siRNA cells (*P < 0.05, ANOVA with Dunnett's adjustment for multiple testing).
- HeLa cells transfected with control, ALIX, Hrs, or CHMP4B siRNA were immunostained with anti‐α‐tubulin (green), anti‐γ‐tubulin (red), and Hoechst (blue). Z‐stacks (of 0.32 μm per plane) through metaphase cells were acquired and the number of confocal planes between the two centrosomes was determined, reflecting the MS tilt. Scale bars, 5 μm. The graph illustrates the average percentage of cells displaying centrosomes with the indicated number of z‐planes apart (± SE). Approximately 50% of controls displayed the two centrosomes 0‐3 z‐planes apart (as shown), whereas in ALIX‐deprived cells, the distance in z‐plane between the two centrosomes was generally longer (shown is a cell displaying centrosomes separated by 7 z‐planes) (**P < 0.01, ANOVA with Dunnett's adjustment for multiple testing). Centrosomes in focus are indicated with arrows. In total, 50 control cells, 43 ALIX‐, 48 Hrs‐, and 47 CHMP4B‐depleted cells were scored (four separate experiments).
- Western blotting analysis determining the expression levels of ALIX, Hrs, CHMP4B, and GAPDH in HeLa cells transfected with control, ALIX, Hrs, or CHMP4B siRNA.
- Lysates of HeLa Kyoto‐GFP‐tubulin‐mCherry‐Histone2B cells transfected with control siRNA or ALIX siRNA were immunoblotted for ALIX and GAPDH (loading control).
- Live cell imaging of HeLa Kyoto‐GFP‐tubulin‐mCherry‐Histone2B cells depleted of ALIX or not was performed to assess cell cycle progression. Typical still images of control cell (upper panel) and ALIX‐depleted cells (lower panel). Time is indicated in min. The table below summarizes the duration of different cell cycle phases (± SE). Compared to control cells, ALIX‐depleted cells spend longer time in prometaphase (21.6 ± 1.4 versus 16.8 ± 0.9 min, **P < 0.01, Student's t‐test), metaphase (73.6 ± 14.8 versus 39 ± 4.2 min, **P < 0.01, Student's t‐test), and cytokinesis (it takes on average 60.4 ± 10.7 min before the intercellular bridge abscises in ALIX siRNA cells and only 41 ± 2.4 min in control cells, *P < 0.05, Student's t‐test).
- The table shows that ALIX‐depleted cells are slightly more frequently arrested in metaphase (10.9%) compared to control cells (6.7%, *P < 0.05, Student's t‐test). As much as 65.2% of ALIX siRNA cells died during metaphase in contrast to only 2.3% of control siRNA cells (***P < 0.001, Student's t‐test).
ALIX regulates the MS orientation in epithelial cells
We further examined whether ALIX controls MS orientation in non‐stem cells by using two powerful Drosophila epithelial cell model systems for studying MS orientation during either asymmetric or symmetric planar cell division: (i) the Drosophila sensory organ precursor (SOP) cells of the pupal notum and (ii) the Drosophila follicle epithelial cells (FECs), respectively (Morin & Bellaiche, 2011; Bergstralh et al, 2017). First, we investigated the rotation of the MS in pupal SOPs as illustrated schematically in Fig 3F. For this assay, we used flies ubiquitously expressing Asl‐YFP and α‐tubulin‐GFP (Asl‐YFP, α‐tubulin‐GFP) combined with the alix 3 mutant (Asl‐YFP, α‐tubulin‐GFP; alix 3) and performed live cell imaging to monitor spindle rotation in dividing SOPs (Fig 3D). ALIX expression in control (Asl‐YFP, α‐tubulin‐GFP) and its absence in alix 3 mutant (Asl‐YFP, α‐tubulin‐GFP; alix 3) pupae was verified by Western blot analysis (Fig 3G). The still images in Fig 3D show representative examples of control and alix 3 SOPs in mitosis (indicated with arrows). Measurements of the spindle rotation angles revealed that alix 3 mutant SOPs displayed a statistically significant increase in rotation angles compared to control SOPs (P < 0.01), showing that ALIX controls MS orientation also in asymmetrically dividing SOPs (Fig 3E). In addition, the MS rotation velocity in alix 3 mutant SOPs was higher than in control SOPs (2.4 ± 0.2°/min and 1.5 ± 0.2°/min, respectively, P < 0.01; Fig EV2C).
Drosophila FECs undergo planar, symmetric cell division to ensure formation of a monolayer of cells constituting the epithelium (Bergstralh et al, 2017). This is accomplished by orienting the MS parallel to the apical membrane, implying that the relative spindle angle between the polarity and MS axis is ideally 90° (illustrated in Fig 4B). The majority of w 1118 FECs (78%) displayed a normal spindle orientation (90–75°), in comparison with only 33% of alix 1 mutant FECs (Fig 4A). In general, alix 1 FECs displayed greater variation in their relative spindle angles compared to w 1118 FECs or alix‐l/CyO; alix 1 rescue FECs (P < 0.001; Fig 4A). Western blotting analysis confirmed the lack of ALIX in ovaries of alix 1 mutant and ALIX expression in the ovaries of rescue (alix‐l/CyO; alix 1) females (Fig 4C). Our data thus indicate that ALIX regulates MS positioning also in symmetrically dividing Drosophila FECs.
Figure 4. ALIX regulates MS orientation in symmetrically dividing Drosophila and human epithelial cells.

- Ovaries of adult female flies (w 1118, alix 1 and alix‐l/CyO; alix 1) were stained with rhodamine‐phalloidin (red), anti‐α‐tubulin (green), anti‐Cnn (white), and Hoechst (blue). Typical confocal micrographs of metaphase FECs are presented, and the apical membrane facing the egg chamber germ cells is indicated with *. Scale bar, 5 μm. The MS orientation was measured, and the graph shows the average percentage of FECs (w 1118, n = 45, alix 1, n = 45, alix‐l/CyO; alix 1, n = 39, from three independent experiments) with the indicated relative spindle angle (± SE). Statistically significant difference is indicated as ***P < 0.001 (ANOVA).
- Schematic figure illustrating calculation of the relative spindle angle in FECs, between the polarity axis (blue line) perpendicular to the line aligning the apical membrane (red dotted line) and the MS axis (blue dotted line) spanning between the two centrosomes.
- Lysates of ovaries from w 1118, alix 1 and alix‐l/CyO; alix 1 flies were immunoblotted for ALIX, α‐tubulin, and GAPDH (loading control).
- The MS orientation was determined in metaphase cells in organoids of Caco‐2 cells transfected with control (n = 75), ALIX (n = 88), or NuMA (n = 79) siRNA (from three independent experiments). The graph shows the average percentage of Caco‐2 cells with the indicated relative spindle angle (± SE). Greater spindle angle variation was observed in ALIX‐ and NuMA‐depleted cells compared to control cells (***P < 0.001, ANOVA). Representative confocal images are shown where the cells are stained with rhodamine‐phalloidin (red), α‐tubulin (green), and Hoechst (blue). The apical membrane facing the lumen of the organoid is marked (*). Scale bar, 5 μm.
- Lysates of control, ALIX, or NuMA‐depleted Caco‐2 cells were immunoblotted for NuMA, ALIX, α‐tubulin, and GAPDH (loading control).
Source data are available online for this figure.
Previously, ALIX has been assigned an evolutionarily conserved role during cytokinesis (Carlton & Martin‐Serrano, 2007; Morita et al, 2007; Eikenes et al, 2015). In this context, we asked whether ALIX dictates spindle orientation also in human cells, and used Caco‐2 epithelial cells, which form 3D‐organoids when cultured in matrigel (Zhang et al, 2003), as an in vitro model system. As in FECs, the MS of Caco‐2 cells aligns parallel to the apical membrane facing the lumen of the organoids and thus perpendicular to the polarity axis (Jaffe et al, 2008). The average percentage of Caco‐2 metaphase cells displaying normal relative spindle angle (90–75°) decreased from 63% to 32% upon depletion of ALIX (Fig 4D). Further, the ALIX‐depleted cells displayed in general greater diversity of the spindle orientation than control cells (P < 0.001) (Fig 4D), which was also observed in cells transfected with two other ALIX siRNA oligonucleotides (P < 0.05; Fig EV2E). Randomized spindle position was also observed in Caco‐2 cells deprived of NuMA (P < 0.001), the human orthologue of Mud, in accordance with previous reports (Seldin et al, 2013). Efficient depletion of either ALIX (Figs 4E and EV2D) or NuMA (Fig 4E) was confirmed by Western blot analysis, which further showed that ALIX depletion did not affect cellular levels of NuMA, or vice versa. Thus, ALIX controls MS orientation also in human epithelial Caco‐2 organoids.
Single cells grown in culture have also been reported to orient the spindle parallel to the substrate (di Pietro et al, 2016). Therefore, we determined the distance between the two centrosomes through the z‐stack of metaphase HeLa cells depleted of ALIX or not (Fig EV2F and G). In control cells, 49% of the cells displayed the two centrosomes maximum 3 confocal planes (0.32 μm/plane) apart, indicating that the spindle is parallel to the substrate (Fig EV2F). For comparison, only 27.5% of ALIX‐depleted cells displayed this distance, and compared to the control cells, the ALIX‐depleted cells showed a significantly greater degree of spindle tilting/misorientation (P < 0.01). In addition, we assessed spindle orientation in cells depleted of the ESCRT components Hrs (ESCRT‐0) or CHMP4B (ESCRT‐III; Fig EV2F and G), since ALIX often influences biological processes in concert with the ESCRT machinery (Christ et al, 2017). However, neither depletion of Hrs nor CHMP4B significantly affected the spindle tilting (Fig EV2F), consistent with the reported lack of ESCRT‐III/CHMP4B at centrosomes (Ott et al, 2018). This suggests that whereas regulation of MS orientation depends on ALIX, it is independent of core ESCRT proteins.
Since spindle misorientation prolongs metaphase progression (Zhu et al, 2013), we further performed live cell imaging to determine the duration of early phases of cell division (Fig EV2H and I). ALIX‐depleted HeLa cells exhibited prolonged prometaphase (21.6 ± 1.4 min) and metaphase (73.6 ± 14.8 min) compared to control cells (16.8 ± 0.9 and 39 ± 4.2 min, respectively; P < 0.01; Fig EV2I). Interestingly, ALIX‐depleted cells (10.9%) were more often arrested in metaphase compared to control cells (6.7%, P < 0.05) and a great percentage of these cells died (65.2% compared to 2.3% in control cells, P < 0.001; Fig EV2J). Taken together, our results reveal that ALIX also regulates the MS orientation in Drosophila and human epithelial cells undergoing planar division, as well as in HeLa cells.
ALIX facilitates nucleation of astral MTs
Next, we sought to characterize the underlying molecular mechanism by which ALIX controls MS orientation. To this end, we generated control (FRT82B con) and alix 1 mutant (FRT82B, alix 1) MARCM NB clones in the Drosophila larval brain. Given the essential role of polarity cues defining the MS orientation in NBs (di Pietro et al, 2016; Bergstralh et al, 2017), we first elucidated whether alix 1‐deficient NBs showed disrupted polarized localization of apical (aPKC, Bazooka) and basal (Brat, PON, Miranda) determinants. Compared to the surrounding GFP‐negative control NBs (set to 100%), FRT82B, alix 1 NBs, but not FRT82B con NBs, showed weaker aPKC crescents (77.5 ± 9.3% of control fluorescence intensity, P < 0.01), indicating that ALIX affects the apical localization of aPKC (Fig EV3A). However, there were no differences in the intensities of the apical crescent of Bazooka or the basal localization of Brat and PON in FRT82B, alix 1 NBs, or FRT82B con NBs compared to their respective GFP‐negative control NBs (Fig EV3B–D). On the other hand, the intensity of Miranda was significantly reduced (66.6 ± 5.7% of control intensity, P < 0.01) in FRT82B, alix 1 NBs, but not in the FRT82B con NBs (Fig EV3E). Whereas some alix‐deficient NBs displayed weaker Miranda crescents, other NBs showed an almost complete dispersion of Miranda‐staining throughout the cytosol, as shown in Fig EV3E. In summary, with the exceptions of aPKC and Miranda, ALIX seems to be dispensable for the cell polarity in NBs, suggesting that ALIX regulates the orientation of the MS by other mechanisms.
Figure EV3. The overall cell polarity in NBs is independent of ALIX .

-
A–EBrains of FRT82B con or FRT82B, alix 1 larvae in which clones were generated by the MARCM strategy were dissected and immunostained with: (A) anti‐aPKC (red), (B) anti‐Bazooka (red), (C) anti‐Brat (red), (D) anti‐PON (red), or (E) anti‐Miranda (red) as well as Hoechst (blue). Recombinant NBs are GFP‐positive (green) and shown in the lower panels (A–D) or highlighted (E). The GFP‐negative control cells are presented in the upper panel (A–D). Representative confocal images are presented (scale bars, 5 μm). The graphs shown represent the fluorescence intensities (mean ± SE) of: 15 FRT82B con and 18 FRT82B, alix 1 NBs (for aPKC), 13 FRT82B con and 22 FRT82B, alix 1 NBs (for Bazooka), 12 FRT82B con and 7 FRT82B, alix 1 NBs (for Brat), 9 FRT82B con and 23 FRT82B, alix 1 NBs (for PON), 19 FRT82B con and 33 FRT82B, alix 1 NBs (for Miranda) from three experiments. Significant differences are indicated (**P < 0.01, Student's t‐test).
Given that correct orientation of the MS requires anchoring of astral MTs to the cell cortex (di Pietro et al, 2016), we next asked whether astral MTs might be affected in NBs upon ALIX loss of function. Interestingly, we observed weaker astral MTs in alix‐deficient NBs compared to the surrounding control NBs (Fig 5A). Specifically, the intensity of the astral MTs in FRT82B, alix 1 NBs was reduced to 65.8 ± 10.3% of the intensity of GFP‐negative control cells (P < 0.01; Fig 5A). Furthermore, the total MT intensity was also decreased (by 40%) in GFP‐positive FRT82B, alix 1 NBs compared to their surrounding control cells (P < 0.05). For comparison, GFP‐positive FRT82B con NBs displayed the same intensity of astral as well as total MT as GFP‐negative control NBs. The astral MTs represented 18.1 ± 2.1% of the total MT intensities in GFP‐negative control cells but only 12.9 ± 1.3% in FRT82B, alix 1 NBs (P < 0.01). In contrast, the astral MTs constituted 18.1% of total MTs in FRT82B con NBs, thus resembling the surrounding GFP‐negative control cells (Fig 5A).
Figure 5. ALIX facilitates nucleation of astral MTs by recruiting γ‐tubulin to the centrosomes.

-
AThe MARCM strategy was used to generate alix mutant NBs clones (FRT82B, alix 1) or genetic equivalent control clones (FRT82B con) in the larval brain. Dissected brains were immunostained with anti‐α‐tubulin (red) and Hoechst (blue). Recombinant NBs are positively marked with GFP (green) and outlined. The presence or lack of astral MTs is indicated with arrows or asterisks, respectively. Scale bars, 5 μm. The average intensity of astral, total, and astral/total MT (± SE) in GFP‐positive relative to GFP‐negative control cells (set to 100%, indicated as dotted line in the graph) was calculated from three separate experiments (including 13 GFP‐negative FRT82B con NBs, 11 GFP‐positive FRT82B con NBs, 10 GFP‐negative FRT82B, alix 1 NBs, and 8 GFP‐positive FRT82B, alix 1 NBs) (*P < 0.05 and **P < 0.01, Student's t‐test).
-
BHeLa cells depleted of ALIX or not were immunostained with anti‐α‐tubulin (red), anti‐Pericentrin (green), and Hoechst (blue). Representative confocal images are presented. Scale bars, 5 μm. The graph shows MT intensities as percentage of control cells (± SE) obtained from 99 control and 90 ALIX siRNA‐transfected cells (data obtained from six separate experiments). Significant differences are noted as *P < 0.05 and ***P < 0.001 (Student's t‐test).
-
C, DRegrowth of MTs after cold‐induced depolymerization was performed using brains of w 1118 and alix 1 larvae, stained with anti‐α‐tubulin (red), anti‐Bazooka (green), and Hoechst (blue) (C) or HeLa cells depleted of ALIX or not stained with anti‐α‐tubulin (white) and anti‐Pericentrin (green) (D). Typical confocal images showing MT regrowth at given time points are shown (scale bars, 5 μm). The graphs show the time‐dependent MT intensities relative to the respective 0″‐samples (± SE) calculated from three independent experiments. In (C), 46, 64, 65, and 48 w 1118 NBs and 73, 37, 44, and 49 alix 1 NBs from 0, 30, 60, and 300″ were analyzed, respectively (*P < 0.05). In (D), 47, 40, and 42 control cells and 48, 47, and 47 ALIX‐depleted cells were calculated 0, 30″, and 420″ after regrowth, respectively (*P < 0.05, Student's t‐test).
-
EBrains as described in (A) were immunostained with anti‐γ‐tubulin (red) and Cnn (white, left panel) or anti‐Dgrip91 (red) and α‐tubulin (white, right panel), as well as Hoechst (blue). Recombinant NBs are positively marked with GFP (green). The confocal images show typical accumulation of centrosomal γ‐tubulin or Dgrip91, and the insets zoom in at the indicated centrosomes. Scale bars, 5 μm. The intensities of γ‐tubulin, Dgrip91, and Cnn in control NBs (GFP‐negative, set to 100%) and GFP‐positive, recombinant NBs are presented in the table (± SE), also indicating the number of NBs quantified (n) from three separate experiments (*P < 0.05, Student's t‐test).
-
FGST‐ALIX (lane 3), but not GST (lane 2) pulled out Dgrip91 and γ‐tubulin from larval brain lysates.
-
GGST or GST‐ALIX were incubated with in vitro translated 35S‐methionine‐labeled γ‐tubulin or Dgrip91. The upper panel shows the autoradiography indicating interaction between GST‐ALIX and radiolabeled γ‐tubulin or Dgrip91. The lower panel shows the Ponceau S‐stained membrane visualizing the levels of GST and GST‐ALIX. The experiment was performed at least three times and a representative result is presented.
-
HHeLa cells depleted of ALIX or not grown on coverslips were stained with anti‐γ‐tubulin (white), anti‐Pericentrin (red), and Hoechst (blue) before being examined by confocal fluorescence microscopy. The confocal images and insets show the centrosomal accumulation of γ‐tubulin and Pericentrin. Scale bars, 5 μm. The graph presents the average centrosomal intensities of γ‐tubulin and Pericentrin relative to control cells (set to 100%) calculated from three independent experiments (10 cells per condition/experiment) (± SE). Significant difference is noted as **P < 0.01 (Student's t‐test).
-
ILysates of control or ALIX‐depleted HeLa cells were immunoblotted for ALIX, γ‐tubulin, α‐tubulin, and GAPDH (loading control).
Source data are available online for this figure.
To investigate whether astral MTs might also be affected in other cell types, we first investigated MARCM SOP clones. Interestingly, alix‐deficient SOP clones also displayed reduced astral MT intensities, on average 35.6 ± 10.9% of control cell intensities (P < 0.001; Fig EV4A). The astral MTs represented only 7.5 ± 1.5% of the total MTs in alix 1 SOPs compared to 17.2 ± 1.7% in control SOPs (P < 0.001; Fig EV4A). Unlike NBs, alix‐deprived SOPs showed almost the same total intensity of MTs as control SOPs. Next, we determined astral MT intensities in wild‐type versus alix 1 mutant FECs. FECs of alix 1 mutant flies displayed less astral MTs compared to FECs of w 1118 flies, specifically 25.1 ± 2.7% of wild‐type levels (P < 0.05; Fig EV4B). As in NBs, alix‐deficient FECs displayed reduced total MT intensities (49.3 ± 4.8%, P < 0.01). In wild‐type FECs, the astral MTs represented 16.2 ± 2% of total MTs, which was reduced to 9.2 ± 0.8% in alix 1 mutant FECs (P < 0.001; Fig EV4B). Together, our data imply that ALIX facilitates the formation of astral MTs in Drosophila NBs, SOPs, and FECs.
Figure EV4. ALIX facilitates formation of astral MTs in SOPs and FECs and MT nucleation in NBs.

- A clonal analysis was applied to determine the distribution of α‐tubulin (red) in wild type and FRT82B, alix 1 SOPs labeled with Cut (green). The alix 1 SOPs were identified by the loss of nls‐GFP (blue). Arrows indicate astral MTs. Scale bars represent 10 μm. The astral and total MT intensities were calculated from nls‐GFP‐negative alix‐deficient SOPs relative to nls‐GFP‐positive control cells (set to 100%). The graph summarizes the average of 12 control cells and 7 alix 1 mutant SOPs (± SE). Compared to control SOPs the formation of astral MTs is reduced to 36.5 ± 10.9% in alix‐deprived SOPs (***P < 0.001, Student's t‐test). In control SOPs, the astral MTs constituted 17.2 ± 1.7% of the total MTs and this ratio was decreased to 7.5 ± 1.5% in alix‐deficient SOPs (***P < 0.001, Student's t‐test).
- Ovaries from w 1118 and alix 1‐flies were stained with anti‐α‐tubulin (red), anti‐Asl (white), and Hoechst (blue). Typical confocal micrographs of w 1118 and alix 1 metaphase FECs are shown (scale bars, 5 μm). Compared to w 1118 FECs, the alix 1 FECs exhibited less astral MTs (± SE) (25.1 ± 2.7% of wild‐type, *P < 0.05 Student's t‐test) and total MTs (± SE) (49.3 ± 4.8% of wild‐type, **P < 0.01 Student's t‐test). Correspondingly, in w 1118 FECs the astral MTs represented 16.2 ± 2% of total MTs but only 9.2 ± 0.8% (± SE) in alix 1 FECs (***P < 0.001, Student's t‐test). In total, 37 w 1118 FECs and 39 alix 1 FECs from three separate experiments were analyzed.
- MT regrowth assay was performed, and the dissected brains of w 1118 and alix 1‐mutant larvae were stained with anti‐α‐tubulin (red), anti‐Cnn (white), and Hoechst (blue). Typical images of interphase NBs allowed regrowing MT for 0, 30, 60, and 300 s are shown (scale bars, 5 μm). The total MT intensities were determined (of 126, 113, 87, and 62 w 1118 NBs and 118, 127, 106, and 76 alix 1 NBs at 0, 30, 60, and 300″ regrowth, respectively) and shown in the graph as the average of three separate experiments (± SE). *P < 0.05 (Student's t‐test).
Next we investigated whether ALIX affects the formation of astral MTs in human cells as well. Accordingly, HeLa cells depleted of ALIX showed reduced intensities of astral MTs (44.2 ± 6.4% of control levels, P < 0.001), as well as total MTs (75.9 ± 7.8% of control levels, P < 0.05; Fig 5B), suggesting that ALIX affects MT formation also in human cells. Compared to the total MT intensities, the astral MTs constituted 17.4 ± 1.4% in control cells and only 10.2 ± 1.2% in ALIX‐depleted cells (P < 0.001). The efficient depletion of ALIX was confirmed by Western blot analysis, which furthermore indicated that the total α‐tubulin expression was not affected upon ALIX depletion (Fig 5I), arguing that ALIX affects the formation of the astral MTs rather than the overall α‐tubulin expression.
To further characterize how ALIX affects formation of MTs, we assessed regrowth of MTs from the centrosomes after cold‐induced depolymerization of MTs in Drosophila NBs and HeLa cells. In wild‐type NBs, a rapid regrowth of MTs was observed already after 30 s, which continued up to 5 min, evidenced by the steadily increased MT intensity measured over time (13‐, 20‐, and 24‐fold increase at 30, 60 and 300 s, respectively, relative to the 0″‐intensity; Fig 5C). In comparison, alix 1 mutant NBs displayed substantially decreased MT intensities (4‐, 4.3‐, and 8‐fold at the same time points, relative to the 0″‐intensity, P < 0.05), indicating that ALIX facilitates nucleation of centrosomal MTs. Accordingly, the same tendency was observed in HeLa cells depleted of ALIX (Fig 5D). The MT intensity was increased by 19‐fold and 44‐fold in control cells after 60 and 420 s regrowth, respectively. In contrast, the MT intensities in ALIX‐depleted cells were increased only 3‐fold and 9.5‐fold (P < 0.05, compared to control cell intensities) at the same time points, again showing inefficient MT nucleation in ALIX‐deprived cells. Delayed MT regrowth was also observed in alix 1 mutant interphase NBs compared to wild type (P < 0.05; Fig EV4C). Taken together, our results suggest that ALIX facilitates the nucleation of MTs at centrosomes in Drosophila and human cells.
ALIX recruits γ‐tubulin to promote MT nucleation at centrosomes
In light of the essential role γ‐tubulin possesses as the major MT nucleator at centrosomes (Sulimenko et al, 2017), we assessed the centrosomal localization of γ‐tubulin in FRT82B con and FRT82B, alix 1 NB clones. Interestingly, less γ‐tubulin was present at the centrosomes of FRT82B, alix 1 NBs (81.5 ± 6.1% of GFP‐negative, control levels, P < 0.05; Fig 5E). On the contrary, GFP‐positive FRT82B con NBs accumulated similar amounts of centrosomal γ‐tubulin as the surrounding GFP‐negative NBs (Fig 5E), implying that ALIX recruits γ‐tubulin at the centrosomes. In contrast to γ‐tubulin, Cnn accumulated to the same extent in control and FRT82B, alix 1 NBs (Fig 5E). Consistent with the observation that removing one component of the γTuRC destabilizes the whole complex (Verollet et al, 2006; Singh et al, 2014), we also detected less of the γ‐tubulin‐interacting GCP protein Dgrip91 at centrosomes in FRT82B, alix 1 NBs (82.2 ± 7.8% of control levels, P < 0.05; Fig 5E). In contrast, the centrosomal accumulation of Dgrip91 was not influenced in FRT82B con NBs (Fig 5E). Thus, ALIX recruits γTuRC components at the centrosomes. We next assessed whether ALIX was able to interact with γ‐tubulin and Dgrip91. Indeed, GST‐ALIX, but not GST alone, pulled out γ‐tubulin and Dgrip91 from larval brain lysates (Fig 5F), as well as in vitro translated 35S‐methionine‐labeled γ‐tubulin and to less extent Dgrip91 (Fig 5G), suggesting that ALIX interacts with these γTuRC components both in vivo and in vitro.
To further elucidate whether the ALIX‐mediated recruitment of centrosomal γ‐tubulin is conserved in human cells, we assessed centrosomal accumulation of γ‐tubulin in HeLa cells depleted of ALIX or not. Correspondingly, ALIX‐depleted cells showed only 58.1 ± 0.5% of the γ‐tubulin intensity detected in control cells (P < 0.01; Fig 5H), despite unchanged cellular expression of γ‐tubulin upon ALIX depletion (Fig 5I). Our findings thus accompany the previous observation that ALIX co‐immunoprecipitated with γ‐tubulin in human cells (Schmidt et al, 2003). In ALIX‐depleted cells, the levels of Pericentrin (97.7 ± 24.1%) resembled those detected in control cells (Fig 5H), suggesting that the general PCM integrity was not affected. In summary, our results suggest that ALIX recruits γ‐tubulin and Dgrip91 to the centrosomes, thus facilitating the γTuRC‐dependent nucleation of MTs at the centrosomes.
ALIX controls MS orientation also by γ‐tubulin‐independent mechanisms
To investigate the functional relationship between γ‐tubulin and ALIX in defining the MS orientation, we further compared the MS orientation in wild‐type, alix 1 mutant, γ‐Tub23C PI mutant, and γ‐Tub23C PI ; alix 1 double‐mutant NBs (Fig 6A). Quantifications of protein levels from Western blot analyses of the ALIX and γ‐tubulin expression in larval brain lysates confirmed significantly reduced levels of ALIX (17 ± 9.4% and 10 ± 4.7% of wild‐type levels in alix 1 and γ‐Tub23C PI ; alix 1, respectively, P < 0.05) and γ‐tubulin (24 ± 19.9% and 24.0 ± 12.5% of wild‐type levels in both γ‐Tub23C PI and γ‐Tub23C PI ; alix 1, respectively, P < 0.05) in the respective mutants compared to wild type (Fig 6B). It is important to note that strong perdurance of maternally contributed ALIX or γ‐tubulin23C could contribute to the detection of low levels of ALIX and γ‐tubulin in the respective mutants (Fig 6B). As before, the alix 1 mutant NBs showed significantly greater variation in the relative spindle angles compared to wild‐type NBs (P < 0.05) (Fig 6A). Intriguingly, NBs deprived of both ALIX and γ‐tubulin23C showed significantly greater variation in spindle orientation compared to w 1118 (P < 0.05), alix 1 (P < 0.05), and γ‐Tub23C PI mutant NBs (P < 0.05) (Fig 6A). In contrast, only a small fraction of the γ‐Tub23C PI NBs showed deviant spindle orientation, and the variation in relative spindle angles was not even significantly different from w 1118 (P = 0.071). Our results thus accompany the reported formation of astral MTs and normal MS orientation in spermatocytes of γ‐Tub23C PI flies (Sampaio et al, 2001). The low incidence of misorientation we observed in γ‐Tub23C PI NBs could perhaps reflect maternally contributed γ‐tubulin23C as described above or a redundant mechanism mediated by γ‐tubulin37D, even though γ‐tubulin37D is less recruited to centrosomes during mitosis than γ‐tubulin23C (Raynaud‐Messina et al, 2001). Moreover, depletion of γ‐tubulin23C has been reported to generate cells with monopolar spindles (Raynaud‐Messina et al, 2004), and thus, we may have underestimated the effect γ‐tubulin exerts on the spindle orientation since we only assessed spindle orientation in metaphase cells possessing bipolar spindles. A possible reason for the stronger MS misorientation detected in γ‐Tub23C PI; alix 1 NBs compared to alix 1 or γ‐Tub23C PI single‐mutant NBs could be that the additional loss of γ‐tubulin or ALIX function causes further reduction in γ‐tubulin on the centrosomes, respectively. Interestingly, however, we detected similarly reduced MT nucleation capacity in NBs deprived of ALIX, γ‐tubulin, or both (P < 0.05) (Fig 6C and D), which indicates that ALIX promotes MT nucleation via γ‐tubulin. The potentiation of the MS misorientation in the double mutant compared to the single mutants might therefore indicate that ALIX controls MS orientation also in a γ‐tubulin‐independent manner.
Figure 6. ALIX controls MS orientation also by γ‐tubulin‐independent mechanisms.
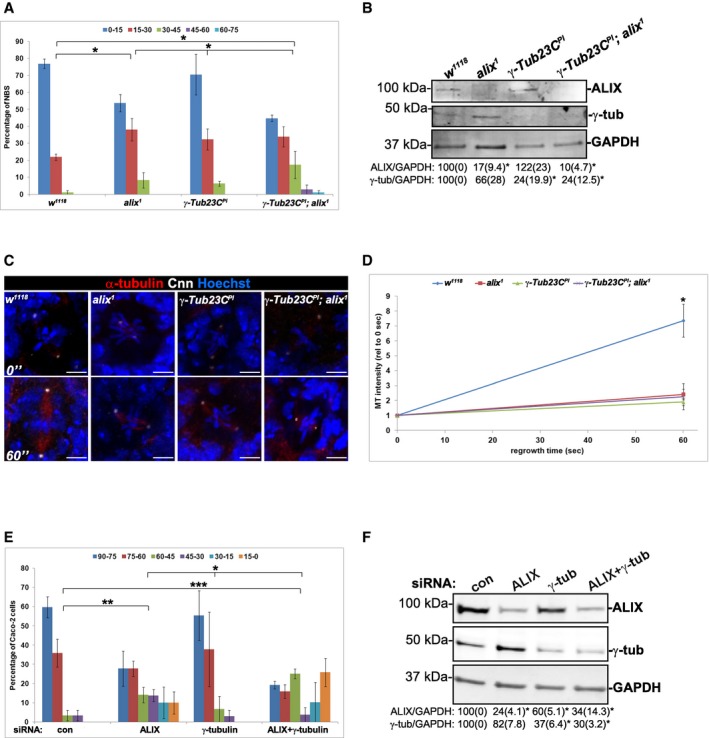
- The MS orientation was determined in metaphase NBs from brains dissected from wild‐type (w 1118), alix 1, γ‐Tub23C PI or γ‐Tub23C PI ; alix 1 larvae. Compared to w 1118 , significantly greater variation in the relative spindle angles was observed in alix 1 NBs and γ‐Tub23C PI ; alix 1 NBs (*P < 0.05, ANOVA). The γ‐Tub23C PI ; alix 1 NBs displayed significantly greater variation of their spindle orientations than either alix 1 or γ‐Tub23C PI NBs (*P < 0.05, ANOVA). The graph shows the average percentage of NBs with the indicated relative spindle angles (± SE) from a total of 57 w 1118 NBs, 55 alix 1 NBs, 76 γ‐Tub23C PI NBs, and 62 γ‐Tub23C PI ; alix 1 NBs (three independent experiments).
- Lysates of the respective genotypes were immunoblotted for ALIX, γ‐tubulin, and GAPDH (loading control). The average expression of ALIX or γ‐tubulin (relative to GAPDH) from three independent experiments is given below (± SE), and significant differences are indicated as *P < 0.05, Student's t‐test.
- Dissected brains of w 1118, alix 1, γ‐Tub23C PI, and γ‐Tub23C PI ; alix 1 larvae were subjected to MT regrowth assay and stained with anti‐α‐tubulin (red), anti‐Cnn (white), and Hoechst (blue). Representative images of NBs after 0 and 60 s regrowth are presented. Scale bars, 5 μm.
- The MT intensities after 0 and 60 s regrowth were determined, here presented as the average of three separate experiments (± SE) where in total 27 w 1118‐0″, 28 w 1118‐60″, 26 alix 1‐0″, 19 alix 1‐60″, 28 γ‐Tub23C PI‐0″, 26 γ‐Tub23C PI‐60″, 28 γ‐Tub23C PI ; alix 1‐0″, and 23 γ‐Tub23C PI ; alix 1‐60″ NBs were analyzed. Compared to w 1118‐NBs, significantly less MT polymerized in alix 1, γ‐Tub23C PI, or γ‐Tub23C PI ; alix 1 NBs (*P < 0.05, Student's t‐test).
- The relative spindle angle between the polarity axis perpendicular to the apical phalloidin‐stained F‐actin surface and the MS was determined in metaphase Caco‐2 cyst cells transfected with control, ALIX, or/and γ‐tubulin siRNA (29, 29, 18, and 32 metaphase cells, respectively, were analyzed from three separate experiments). Compared to control cells, depletion of either ALIX or both ALIX and γ‐tubulin induced a significantly increased randomization of the relative spindle angles (**P < 0.01 and ***P < 0.001, ANOVA). Caco‐2 cells depleted of ALIX+γ‐tubulin showed a greater variation in the spindle angles compared to depletion of ALIX or γ‐tubulin (*P < 0.05, ANOVA). ALIX‐depleted cells showed greater spindle angle variation than γ‐tubulin‐depleted cells (*P < 0.05, ANOVA).
- Efficient knockdown of ALIX and γ‐tubulin relative to GAPDH (loading control) was verified by Western blotting analysis, and the average expression of ALIX or γ‐tubulin relative to GAPDH (± SE) is given below (*P < 0.05, Student's t‐test).
Source data are available online for this figure.
To address the functional relationship of ALIX and γ‐tubulin during MS orientation in human cells, Caco‐2 cells were transfected with siRNA oligos targeting ALIX, γ‐tubulin, or both. Efficient depletion of the proteins in single‐ and double‐transfected cells was verified by Western blot analysis (Fig 6F), and depletion of ALIX did not affect the cellular expression levels of γ‐tubulin. In Caco‐2 cells, the ALIX levels were significantly reduced to 24 ± 4.1% and 34 ± 14.3% of control levels in ALIX and ALIX+γ‐tubulin siRNA‐transfected cells, respectively (P < 0.05), and γ‐tubulin levels were significantly reduced to 37 ± 6.4% and 30 ± 3.2% of control levels in γ‐tubulin and ALIX+γ‐tubulin knockdown cells, respectively (P < 0.05; Fig 6F). Caco‐2 organoid cells depleted of ALIX showed skewed distribution of relative spindle angles compared to control cells (P < 0.01) and γ‐tubulin‐depleted cells (P < 0.05; Fig 6E). Interestingly, Caco‐2 cells deprived of both ALIX and γ‐tubulin displayed greater variation in spindle angles in comparison with control cells (P < 0.001), as well as compared to Caco‐2 cells deprived of either ALIX (P < 0.05) or γ‐tubulin (P < 0.05) (Fig 6E). As observed in NBs, depletion of γ‐tubulin induced only non‐significant defects in spindle orientation, possibly by similar mechanisms as discussed above. Importantly, the stronger MS misorientation observed in Caco‐2 cells depleted of both ALIX and γ‐tubulin compared to depletion of either of these proteins could result from further reduction in γ‐tubulin on centrosomes. Furthermore, these results indicate that ALIX could control MS orientation also by γ‐tubulin‐independent mechanisms in both Drosophila and human cells.
ALIX modulates MT stability
We next examined possible additional γ‐tubulin‐independent mechanism(s) and tested whether it could involve MTs. To this end, the MS orientation was determined in w 1118 and alix 1 mutant FECs or NBs with intact or cold‐induced depolymerized MTs. Cold‐induced MT depolymerization induced spindle misorientation in w 1118 cells, evident by the increased number of FECs showing relative spindle angles below 75° (52.4 ± 3.1% upon cold treatment compared to 16.2 ± 2% at room temperature, P < 0.01; Fig 7A, black bars versus light gray bars). In contrast, the percentage of alix 1 FECs possessing spindle angles below 75° remained unchanged irrespective of cold‐induced depolymerization of MTs [57.1 ± 7.2% alix 1‐room temperature (dark gray bars) and 56.1 ± 1.6% alix 1‐ice (white bars)]. Likewise, 16.4 ± 2.2% of the w 1118 NBs showed relative spindle angle greater than 15° (dark blue bars, Fig 7B) and the fraction increased to 63.9 ± 4.6% (P < 0.01) upon cold treatment (blue bars, Fig 7B), thus indicating spindle misorientation. Again, MT depolymerization did not induce increased MS misorientation in alix 1 NBs (68.7 ± 2.2% (light gray bars) versus 54.8 ± 6% in NBs with intact MTs (dark gray bars). These data imply that ALIX regulates orientation of the MS in an MT‐dependent manner, both dependently and independently of γ‐tubulin.
Figure 7. ALIX controls MT stability.

-
A, BThe relative spindle angle between the polarity axis [perpendicular to the apical surfaces stained with phalloidin (A) or Bazooka (B)] and spindle axis (defined by γ‐tubulin‐stained centrosomes) was determined in wild‐type (w 1118) and alix 1 FECs (A) or NBs (B) incubated at room temperature (RT) or ice for 40 min. The graphs show the percentage of FECs or NBs displaying relative spindle angle 90–75° versus 75–0° or 0–15° versus 15–90°, respectively. The graphs represent the results from three separate experiments analyzing 33 w 1118 FECs‐RT (black bars), 44 w 1118 FECs‐ice (light gray bars), 38 alix 1 FECs‐RT (dark gray bars), 46 alix 1 FECs‐ice (white bars) (A) or 32 w 1118‐NBs‐RT (dark blue bars), 64 w 1118 NBs‐ice (light blue bars), 56 alix 1 NBs‐RT (dark gray bars), and 63 alix 1 NBs‐ice (light gray bars) (B) (± SE), respectively. **P < 0.01, Student's t‐test.
-
CBrains from w 1118 and alix 1 larvae were stained with anti‐acetylated tubulin (green), anti‐Cnn (white), anti‐α‐tubulin (red), and Hoechst (blue). Scale bars, 5 μm. The fluorescence intensities of acetylated MT, total MT, and acetylated MT relative to total MT of 66 w 1118 NBs and 65 alix 1 NBs obtained from three independent experiments are shown graphically (± SE), *P < 0.05, and **P < 0.01 (Student's t‐test).
-
DControl or ALIX‐depleted HeLa cells grown on coverslips were immunostained with anti‐acetylated tubulin (green), anti‐α‐tubulin (red), anti‐Pericentrin (white), and Hoechst (blue). Scale bars, 5 μm. The fluorescence intensities of acetylated MT, total MT, and acetylated MT/total MT of 30 control and 28 ALIX‐depleted HeLa cells are shown in the graph (± SE) (three separate experiments). **P < 0.01, Student's t‐test.
To further investigate the impact ALIX exerts on MTs, we first analyzed the MT stability, which correlates with the acetylation of tubulin (Wloga et al, 2017). Compared to wild‐type NBs, alix 1 NBs showed reduced intensity of acetylated MTs, specifically 21.6 ± 5.4% of the wild‐type NB intensity (set to 100%) (P < 0.01; Fig 7C). In accordance with the reduced total MT intensity we observed in FRT82B, alix 1 NBs (Fig 5A), we also observed slightly less MTs in the MS of alix 1 NBs (78.2 ± 5.6% of wild‐type intensity, P < 0.05) (Fig 7C). However, this did not account for the reduced acetylated MT intensity as evidenced by the decreased levels of acetylated MT relative to total MT in alix 1 NBs (26.8 ± 6.8% of wild‐type, P < 0.01; Fig 7C). Accordingly, HeLa cells depleted of ALIX displayed weaker acetylated MT intensity, total MT intensity, as well as acetylated MT/total MT‐ratio, specifically 51.5 ± 13%, 56.2 ± 7.7, and 51.5 ± 4.9% of control intensities, respectively (P < 0.01) (Fig 7D). Thus, ALIX influences MT stability in Drosophila NBs and HeLa cells.
Identification of proteins associated with MTs in an ALIX‐dependent manner
We performed mass spectrometry to identify proteins associating with MTs in an ALIX‐dependent manner to further characterize the molecular pathway by which ALIX regulates MT stability. In brief, HeLa cells transfected with control or ALIX siRNA were fractionated and the isolated MT‐enriched pellets were subjected to mass spectrometry analysis. A list of MAPs and γTuRC components identified in the mass spectrometry analysis is shown in Fig EV5A and is also highlighted in the full mass spectrometry dataset that is available in Dataset EV1. An at least a 2.5‐fold difference in the Mascot score between control and ALIX siRNA samples was considered to reflect significant differences in MT association of a protein. Since MAP1S was detected in the MT‐pellet of control, but not of ALIX‐depleted cells (Fig EV5A), and has previously been shown to regulate MT stability in dividing cells (Orban‐Nemeth et al, 2005; Halpain & Dehmelt, 2006; Dallol et al, 2007; Tegha‐Dunghu et al, 2014), it represented an interesting candidate to study further. To confirm the mass spectrometry results, we fractionated HeLa cells depleted of ALIX or not, and isolated the MT‐enriched pellet and the corresponding supernatant. In comparison with control cells, only 83 ± 1.9% of MAP1S was associated with the MT‐enriched pellet in ALIX‐depleted cells (P < 0.05; Fig EV5B), implying that ALIX stabilizes the association of MAP1S with polymerized MTs. The efficient knockdown of ALIX was confirmed by Western blotting (Fig EV5B), further showing that ALIX was predominantly detected in the MT‐enriched pellet compared to the corresponding supernatant (Fig EV5B), which is in line with previous observations showing association of ALIX with α‐ and β‐tubulin (Schmidt et al, 2003). Importantly, the total cellular expression levels of MAP1S were not different in control versus ALIX‐depleted cells (Fig 8C), indicating that ALIX regulated the association of MAP1S to MTs without affecting its expression level.
Figure EV5. Overview and validation of MT‐associated and γTuRC proteins detected in mass spectrometry analyses of MT‐enriched fractions.
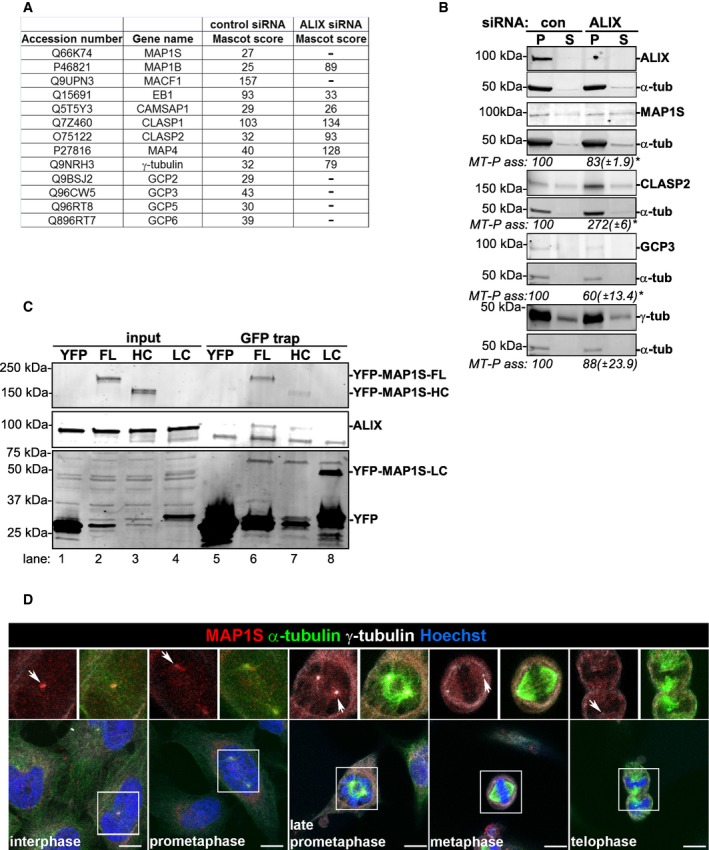
- The table shows the Swissprot accession number, gene name, and the Mascot score of MAPs, GCPs, and γ‐tubulin identified in MT‐pellet fractions of control and ALIX siRNA‐transfected cells by mass spectrometry analysis (one experiment). These are also highlighted in the full dataset presented in Dataset EV1.
- HeLa cells transfected with control or ALIX siRNA were fractionated into MT‐pellet (P) and corresponding supernatant (S) containing non‐polymerized tubulin. The protein levels of ALIX, MAP1S, α‐tubulin, CLASP2, GCP3, and γ‐tubulin in these fractions were determined by Western blot analysis. The levels of MT‐P‐associated MAP1S, CLASP2, GCP3, or γ‐tubulin (relative to α‐tubulin) were determined using the Odyssey software. The protein level ((MAP/GCP/γ‐tubulin)/α‐tubulin intensities) was normalized to the control samples (set to 100%), and the average of three separate experiments (± SE) is shown below the respective panels. *P < 0.05, Student's t‐test.
- Lysates of HeLa cells transiently transfected with pEYFP‐C1, pEYFP‐MAP1S‐full length (FL), heavy chain (HC), or light chain (LC) were applied in GFP‐trap analysis before SDS–PAGE. The membrane was probed with anti‐ALIX and anti‐GFP.
- Confocal micrographs of HeLa cells stained with anti‐MAP1S (red), anti‐γ‐tubulin (white), anti‐α‐tubulin (green), and Hoechst (blue) in different cell cycle phases are shown. Scale bars, 5 μm. MAP1S is clearly located at the centrosomes during interphase and starts to translocate onto the generated MS at prometaphase (centrosomes are indicated with arrows). Some MAP1S is still detected at the centrosomes from prometaphase to telophase, but not as clearly as during interphase.
Source data are available online for this figure.
Figure 8. ALIX regulates MT stability via MAP1S.

-
AHeLa cells transfected with control or ALIX siRNA were fixed, permeabilized, and stained with anti‐MAP1S (red), anti‐γ‐tubulin (white), and Hoechst (blue). Interphase cells are shown, and the insets show close‐ups of the centrosomes. Scale bars, 5 μm.
-
BThe fluorescence intensity of centrosomal MAP1S was determined, and the graph shows the average of three independent experiments (± SE), in which in total 52 control and 36 ALIX siRNA cells were analyzed. Significant difference is indicated as *P < 0.05 (Student's t‐test).
-
CHeLa cells were transfected with control, ALIX, MAP1S, or ALIX + MAP1S siRNA, and the expression of ALIX, MAP1S, and GAPDH (loading control) was determined by Western blotting analysis. Representative results are presented.
-
D, ECells treated as in (C) were immunostained with anti‐α‐tubulin (white), Hoechst (blue) (D), and anti‐acetylated tubulin (green) (E). Scale bars, 5 μm. The intensities of astral MTs relative to total MTs were determined from confocal microscopy images, and the graph in (D) shows the average of four separate experiments (10 cells per condition/experiment) (± SE). *P < 0.05 and **P < 0.01, Student's t‐test. The relative intensity of acetylated MT relative to total MT was determined in (E). The average of four separate experiments (10 cells per condition/experiment) is graphically presented (± SE). Significant differences are indicated as *P < 0.05 (Student's t‐test).
-
FThe regrowth of MTs (i.e., total tubulin intensity) was assessed in cells incubated at 37°C for 0, 60, and 150 s after ice‐induced depolymerization (for 30 min). The graph represents the average of three independent experiments (calculating 10 cells per time point for each condition/experiment) (± SE). Significant differences are noted as *P < 0.05, Student's t‐test.
-
GHeLa cells transfected with control or ALIX siRNA grown on coverslips were transiently transfected with pEYFP‐C1 (green), pEYFP‐MAP1S (green), pEGFP‐C1 (green), or pEGFP‐CLASP2α (green) and immunostained with anti‐α‐tubulin (white), anti‐Pericentrin (red), and Hoechst (blue). Scale bars, 5 μm.
-
HThe lengths and numbers of astral MTs of HeLa cells treated as in (G) were measured (LSM software, version 3.2). The graphs show the average numbers (± SE) based on calculating 30 control siRNA + YFP cells, 23 control siRNA + YFP‐MAP1S cells, 30 ALIX siRNA + YFP cells, 30 ALIX siRNA + YFP‐MAP1S cells, 28 control siRNA + GFP cells, 30 control siRNA + GFP‐CLASP2α cells, 30 ALIX siRNA + GFP cells, and 29 ALIX siRNA + GFP‐CLASP2α cells from three separate experiments (*P < 0.05, Student's t‐test), respectively.
Source data are available online for this figure.
We further validated some of the other proteins found to be ALIX‐dependently associated with polymerized MTs in our mass spectrometry analysis (Fig EV5A), by assessing the levels of the MAP CLASP2 as well as the γTuRC components GCP3 (human homolog of Dgrip91) and γ‐tubulin in MT‐enriched fractions by Western blot analysis (Fig EV5B). CLASP2 was confirmed to be enriched in MT‐pellet fractions in the absence of ALIX in both the mass spectrometry (2.9× enrichment) and Western blot (2.72× accumulation, P < 0.05) analyses (Fig EV5A and B). Likewise, a decrease in GCP3 levels in the MT‐pellet fraction of ALIX‐depleted cells detected in the mass spectrometry analysis (Fig EV5A) was confirmed in the Western blot analysis (ALIX knockdown cells accumulated only 60% of control levels, P < 0.05) (Fig EV5B). In contrast, γ‐tubulin did not associate with the MT‐pellet fraction ALIX‐dependently, as indicated by both mass spectrometry (2.4× differences in Mascot score) and Western blot analysis (Fig EV5A and B).
ALIX regulates MT stability via MAP1S
Based on the ALIX‐dependent association of MAP1S with MTs and its interesting role in binding MTs and regulating MT stability during cell division (Orban‐Nemeth et al, 2005; Halpain & Dehmelt, 2006; Dallol et al, 2007; Tegha‐Dunghu et al, 2014), we decided to investigate the putative relationship between ALIX and MAP1S in regulation of MT dynamics. First, we tested whether ALIX and MAP1S associate with each other in HeLa cells by performing co‐immunoprecipitations from lysates of HeLa cells ectopically expressing empty YFP, YFP‐MAP1S full length (FL), heavy chain (HC), or light chain (LC). These analyses indicated that ALIX interacts with MAP1S‐FL and less efficiently with MAP1S‐HC (Fig EV5C, compare lanes 6 and 7). On the other hand, ALIX did not co‐immunoprecipitate with MAP1S‐LC, although this was very efficiently precipitated by the GFP‐trap beads (Fig EV5C, lane 8). Together, these results suggest that ALIX associates with the heavy chain of MAP1S.
In accordance with the centrosomal localization of MAP1S (Dallol et al, 2007; Fig EV5D), we compared the accumulation of MAP1S at the centrosomes in control and ALIX‐depleted interphase cells because MAP1S was most readily detected on centrosomes in this phase (Figs 8A and EV5D). Compared to control cells, 40 ± 7.7% less MAP1S was detected at the centrosomes upon ALIX depletion (P < 0.05; Fig 8A and B), suggesting that ALIX can promote MAP1S accumulation at centrosomes. We further investigated the functional relationship between ALIX and MAP1S by determining the formation of astral MTs in HeLa cells depleted of ALIX, MAP1S, or both (Fig 8C). Compared to control cells, ALIX knockdown cells displayed weak astral MTs, since the astral MTs constituted only 10.8 ± 1% of the total MTs, in contrast to 25.1 ± 1.9% in the control cells (P < 0.01; Fig 8D). Reduced formation of astral MTs was also observed in MAP1S‐depleted cells (16.7 ± 1.1% of total cellular MTs, P < 0.01; Fig 8D), although the defect was weaker than in ALIX‐deprived cells (P < 0.05). Furthermore, cells depleted of both ALIX and MAP1S exhibited less astral MTs than control cells (13 ± 1.7% of total cellular MTs, P < 0.01), a similar defect as observed in ALIX‐depleted cells and significantly stronger defect compared to MAP1S‐depleted cells (P < 0.05; Fig 8D). Together, these results imply that ALIX affects formation of astral MTs more strongly than MAP1S, most likely reflecting the dual role of ALIX facilitating both nucleation and stabilization of MTs in contrast to the stabilizing role of MAP1S.
Further, we determined the cellular intensity of acetylated MTs to address the relative roles of ALIX and MAP1S in MT stabilization. As already shown in Fig 7D, the levels of acetylated MTs decreased upon ALIX depletion, in this experiment by 25 ± 6.8% compared to control cells (P < 0.05; Fig 8E). In accordance with previous reports (Tegha‐Dunghu et al, 2014), reducing the levels of MAP1S correspondingly reduced the intensity of acetylated MTs by 24.9 ± 7.7% compared to control values (P < 0.05). Simultaneous depletion of both ALIX and MAP1S reduced acetylated MTs relative to total MTs by 22.2 ± 5.2% (P < 0.05), basically to the same extent as depletion of either ALIX or MAP1S. We next addressed the relative impact ALIX and MAP1S exert on astral MT formation by performing a MT regrowth assay in HeLa cells depleted of ALIX, MAP1S, or both (Fig 8F). Compared to control siRNA‐transfected cells, both ALIX‐ and MAP1S‐depleted cells showed significantly reduced capacity of MT regrowth 60 and 150 s after cold‐induced depolymerization (P < 0.05). Interestingly, there was not an evident difference in the reformation of astral MTs upon depletion of ALIX, MAP1S, or both, suggesting that ALIX and MAP1S operate by a common molecular mechanism.
To test this, the length and number of astral MTs were determined in ALIX‐depleted HeLa cells ectopically expressing MAP1S or CLASP2α (Fig 8G and H). Control siRNA cells transfected with YFP displayed on average 15 ± 0.9 astral MT filaments with an average length of 4.2 ± 0.2 μm, whereas ALIX‐depleted cells expressing YFP displayed significantly fewer (10 ± 0.9) and shorter (2.6 ± 0.1 μm) astral MTs (Fig 8H, P < 0.05). The reduced number of astral MTs in ALIX‐deprived cells correlated with the reduced MT nucleation capacity shown in Fig 5D. Ectopic expression of YFP‐MAP1S in control siRNA cells did not affect the number (16.2 ± 0.9) nor the length (4.6 ± 0.1 μm) of astral MTs (Fig 8H). In comparison with YFP‐transfected ALIX siRNA cells, ectopic expression of YFP‐MAP1S did not affect the number of astral MTs (11.1 ± 1.1), but resulted in significantly longer astral MTs (3.8 ± 0.2 μm, P < 0.05), approaching the length observed in control siRNA cells (even though still being significantly shorter than in these cells, P < 0.05, indicating a partial rescue). These data indicate that MAP1S is not implicated in ALIX‐dependent nucleation, but rather ALIX‐mediated stabilization of astral MTs. In order to elucidate whether MAP1S specifically could restore astral MT growth in ALIX‐deprived cells, we ectopically expressed GFP or GFP‐CLASP2α in control and ALIX siRNA cells. As shown in Fig 8H, control siRNA cells expressing GFP or GFP‐CLASP2α displayed the same number (15.1 ± 1 and 15.3 ± 0.8) and length (3.7 ± 0.2 and 3.7 ± 0.1 μm) of astral MTs. Likewise, GFP‐CLASP2α‐expressing ALIX siRNA cells showed equally fewer (11.2 ± 0.4) and shorter (2.5 ± 0.1 μm) astral MTs as GFP‐expressing ALIX siRNA cells (9.9 ± 0.9 and 2.4 ± 0.9 μm). That MAP1S, in contrast to CLASP2α, was able to significantly rescue the defective astral MT formation in ALIX‐depleted cells, further supports that ALIX influences MT stability via MAP1S.
Discussion
Here we have unraveled a novel role of ALIX located at the centrosomes during cell division in regulation of MS orientation by modulating the formation of astral MTs (Fig 9). We discovered that ALIX is recruited to the PCM via DSpd‐2/Cep192, which recruit PCM components (including Cnn/Cep215, γ‐tubulin, and Dgrip91/GCP3), to promote nucleation of astral MTs (Srayko et al, 2005; Gomez‐Ferreria et al, 2007; Fong et al, 2008; Giansanti et al, 2008). Notably, even though DSpd‐2/Cep192 appears to be a major recruiter of ALIX to centrosomes, the fact that ALIX was still partially detected at centrosomes in the absence of DSpd‐2/Cep192 (Fig 2) indicates that additional recruitment mechanisms exist. Centrosomal protein of 55 kDa (CEP55), which localizes to centrosomes during early phases of cell division and moves to and recruits ALIX to the midbody during cytokinesis (Fabbro et al, 2005; Zhao et al, 2006; Carlton & Martin‐Serrano, 2007; Morita et al, 2007; Carlton et al, 2008; Lee et al, 2008; Bastos & Barr, 2010), represents a possible additional recruiter of ALIX to centrosomes in human cells. However, because CEP55 orthologues lack in lower eukaryotes, such as D. melanogaster (and C. elegans; Green et al, 2013; D'Avino et al, 2015), other proteins could also participate in recruiting ALIX to centrosomes. Interestingly, a direct interaction between DSpd‐2/Cep192 and γ‐tubulin has not been elucidated. Based on our results, it is therefore tempting to speculate that ALIX serves a scaffolding role at the interface between DSpd‐2/Cep192 and γTuRC (Fig 9), since we found that ALIX binds DSpd‐2, γ‐tubulin, and Dgrip91 in vitro. Thus, our results provide mechanistic insight into DSpd‐2/Cep192‐mediated regulation of astral MT formation and proper orientation of the MS during metaphase in Drosophila and human cells.
Figure 9. Model of the role of ALIX in promoting correct MS orientation.

The model shows the MS orientation in cells with or without ALIX. The PCM protein DSpd‐2/Cep192 recruits ALIX to the PCM, where ALIX recruits γ‐tubulin of the γTuRC at the centrosomes, thus facilitating nucleation of astral MTs. Furthermore, ALIX recruits MAP1S to the centrosomes, in close proximity to the newly formed MTs which are then stabilized by MAP1S. Thus, ALIX facilitates both nucleation of and stabilization of astral MTs emanating from the centrosomes, thus promoting efficient formation of stable astral MTs which mediate anchoring to the cell cortex and thus correct positioning of the MS. By this mechanism, ALIX is one of several molecules controlling MS orientation, providing robustness to correctly orient the MS during cell division.
Astral MTs seem to be equally essential for correct spindle orientation in diverse cell types, in difference to internal polarity cues or external signals provided by neighboring cells (di Pietro et al, 2016; Santoro et al, 2016; Bergstralh et al, 2017). Interestingly, that loss of ALIX induced spindle misorientation in a variety of cell types, including stem cells (NBs and mGSCs) and epithelial cells (SOPs, FECs, and Caco‐2 cells), corresponds well with our data showing that ALIX controls spindle orientation by facilitating the formation of astral MTs and indicates a general role of ALIX in this process. Furthermore, the defective localization of Miranda and aPKC in alix mutant NBs reflects the compromised formation of astral MTs, rather than aberrant cell polarity, since astral MTs have previously been shown to stabilize these determinants at the basal and apical membranes, respectively (Giansanti et al, 2001, 2008; Basto et al, 2006; Chen et al, 2016b).
ALIX was shown to maintain the epithelial blood–cerebrospinal fluid barrier by facilitating assembly of tight junctions (Campos et al, 2016), which were recently reported to control spindle orientation in Caco‐2 cyst cells (Odenwald et al, 2017). In general, cell–cell contacts such as tight junctions seem to control MS orientation in epithelial cells by F‐actin, an essential component of the cell cortex facilitating capture of astral MTs (di Pietro et al, 2016; Tuncay & Ebnet, 2016). In human epithelial cells, ALIX might thus affect both the formation of astral MTs as we have shown here and their anchoring to the cell cortex. Also in Drosophila SOPs, septate junctions, resembling tight junctions, regulate the MS orientation (Bosveld et al, 2016). Whether ALIX regulates septate junctions in Drosophila epithelial cells remains to be elucidated, but our data showing that cold‐induced depolymerization of MTs potentiated the spindle misorientation only in wild‐type FECs, and not in alix 1 FECs, suggest that ALIX regulates the MS orientation by MT‐dependent mechanisms.
The current study suggests a dual role for ALIX during astral MT formation: (i) by promoting nucleation via γ‐tubulin recruitment and (ii) by stabilization of MTs via stabilizing MAP1S at the centrosomes (Fig 9). Although MAP1S is predominantly associated along MTs, it has also been shown to concentrate at the centrosomes (Fig 8A; Dallol et al, 2007). Here, MAP1S has been suggested to stabilize newly formed MT filaments, which likely explains the reduced regrowth of MTs observed at early time points after cold‐induced depolymerization in MAP1S‐depleted cells by us and others (Dallol et al, 2007; Tegha‐Dunghu et al, 2014). Accordingly, we found that ectopically expressed MAP1S was unable to rescue the reduced number of astral MTs observed in ALIX‐deficient cells, thus arguing against that MAP1S influences the nucleation of MTs as such. Rather, MAP1S significantly increased the length of astral MTs in ALIX knockdown cells, supporting our hypothesis that ALIX facilitates MT stability via MAP1S. We envision that ALIX stabilizes MAP1S adjacent to the PCM, close to the ends of the newly formed MTs emanating from the centrosomes (Fig 9). A simultaneous interaction of MAP1S with both MTs and ALIX seems plausible since the MT‐interacting domain is located in the light chain of MAP1S, whereas ALIX seems to bind the heavy chain.
In summary, the current study identifies a novel evolutionarily conserved role of centrosomal ALIX in promoting astral MT formation to orient the MS. The reduced, rather than absent, recruitment of γ‐tubulin, MAP1S and consequently appearance of astral MTs in ALIX‐deficient cells, clearly suggests that ALIX represents one of several mechanisms to ensure formation of astral MTs. Thus, ALIX provides robustness to correctly orient the MS during asymmetric and planar cell division.
Materials and Methods
Immunostaining of Drosophila larval brains and ovaries
Brains of third‐instar larvae residing in the food were dissected in PBS, fixed, and permeabilized in 4% formaldehyde (EM grade, Polysciences, Inc.) diluted in PBS‐0.1% Triton X‐100 (20 min, room temperature). The specimens were subsequently rinsed three times in PBS‐0.1% Triton X‐100 before staining with indicated primary antibodies (4°C, overnight). The next day, the specimens were washed 3 × 20 min (PBS‐0.1% Triton X‐100), incubated with secondary antibodies and 1 μg/ml Hoechst 33342 (2 h, room temperature), washed three times (each 20 min in PBS‐0.1% Triton X‐100), and mounted in Vectashield (Vector Laboratories, Burlingame, CA). To characterize the MS orientation in Drosophila FECs of the egg chamber, we fed newly hatched female flies yeast paste and kept them with 2–4 males for 2–4 days. The ovaries of the Drosophila female flies were dissected and stained as previously described (Eikenes et al, 2015).
Spindle orientation measurements
Drosophila NBs stained with anti‐Bazooka and anti‐Cnn were used for calculation of the MS orientation. Specifically, the relative spindle angle between the spindle axis (going through the two centrosomes) and polarity axis (perpendicular to the line aligning the apical, Bazooka crescent) was calculated using ImageJ. The MS orientation was measured by ImageJ in Drosophila FECs and Caco‐2 cells as the relative spindle angle between the spindle axis (spanning the centrosomes) and the polarity axis (perpendicular to the apical, phalloidin‐positive membrane).
Calculating astral MT fluorescence intensity
The total MT and mid‐spindle MT intensities were calculated using ImageJ. The intensity of astral MT was defined as mid‐spindle intensity subtracted from the total MT intensity.
Mosaic analysis with a repressible cell marker (MARCM) clonal analysis
The MARCM strategy was applied to directly compare the localization of different proteins in cells deficient of ALIX (GFP‐positive) and surrounding control cells (GFP‐negative). MARCM82 virgin females were crossed with FRT82B con or FRT82B, alix 1 /TM6B,Tb males. The FRT82B con‐strain was used as negative control, to test that the recombination in itself did not affect localization of the indicated proteins. The day after egg lay the embryos were heat shocked (37°C, 1 h) to induce recombination. The brains of third‐instar larvae residing in the food (4 days after egg lay) were dissected and used for the indicated experiments.
Analysis of MS orientation in SOPs by live cell imaging
Live imaging on 16:00 h APF pupa was performed at 22 ± 2°C as described in (Langevin et al, 2005). The movies were acquired using an LSM Leica SPE microscope equipped with a 63× plan Apo‐N.A. 1.4. Spindle rotation angles were measured as illustrated in Fig 3F.
Statistical analysis
The statistical comparison of the MS orientation between wild‐type and different mutant/siRNA conditions was carried out using nested, two‐sided ANOVA (experiment as a factor nested within the factor for wild type relative to mutant/siRNA to take into account which observations arose from the same experiment). The paired, two‐tailed Student's t‐test was used to calculate the significance of protein expression, percentage of cells displaying ALIX at centrosomes, fluorescence intensities, and percentage of cells exhibiting MS misorientation in Fig 7A and B. The statistical tests performed for each experiment are specified in the Figure legends. P‐values are indicated for each experiment, and P‐values below 0.05 were regarded as significant.
Additional Materials and Methods are described in the Appendix Supplementary Materials and Methods.
Data availability
The mass spectrometry proteomics data have been deposited to the ProteomeXchange Consortium via the PRIDE partner repository with the dataset identifier PXD009747.
Author contributions
The project was initiated, conceived, and coordinated by KH, with input on experimental design and strategy from all co‐authors. LM performed experiments presented in Figs 1, 2, 3A–C, and G, and 4, 5, 6, 7, 8, and EV1, EV2B, D–J, and EV3, EV4, EV5. RLB performed the experiments in Figs 3D–F, EV2C, and EV4A. AL‐J performed the experiments in Figs 5B and 8G, and EV2F and G. ÅHE did the experiments in Fig EV2A. LM, RLB, AL‐J, ÅHE, AB, and KH analyzed data. KL performed the statistical analyses. LM and KH wrote the manuscript with input from all the other authors. HS and KH supervised the project.
Conflict of interest
The authors declare that they have no conflict of interest.
Supporting information
Appendix
Expanded View Figures PDF
Dataset EV1
Source Data for Expanded View
Review Process File
Source Data for Figure 2
Source Data for Figure 3
Source Data for Figure 4
Source Data for Figure 5
Source Data for Figure 6
Source Data for Figure 8
Acknowledgements
We thank Eva Rønning and Anne Engen for technical assistance and Ashish Jain for experimental support. Tuula Nyman at the Proteomic Core Facility (Oslo University Hospital, Norway) performed mass spectrometry analysis. We are grateful to Cayetano González, Tony Harris, Chris Doe, Yixian Zheng, Thomas C. Kaufman, Mark Peifer, Jordan Raff, Jurgen A. Knoblich, Oliver J. Gruss, Anna Akhmanova, and Sebastian Patzke for providing antibodies, fly stocks, and plasmids. Members of the Stenmark laboratory are acknowledged for the fruitful discussions of the presented work. We thank Camilla Raiborg and Eva Wenzel for advice concerning Hrs and CHMP4B siRNA experiments. We are grateful to Cayetano González for input on the project and Jens Januschke for training of the Drosophila NB model system during an EMBO Short Term Fellowship in the laboratory of Cayetano González to K.H. Thanks to the Bloomington Drosophila Stock Center at Indiana University and Exelixis at Harvard Medical School for providing fly stocks and DSHB at University of Iowa for antibodies. L.M is granted a Career Development Research Fellowship from the Norwegian Cancer Society (project number 5777228). R.L.B acknowledges La Ligue Nationale contre le Cancer‐Equipe Labellisée (grant number EL2014‐LNCC) and the ANR programme PRC Vie, santé et bien‐être CytoSIGN (grant number ANR‐16‐CE13‐004‐01). Å.H.E was supported by a PhD fellowship from The Norwegian Cancer Society (project number 605009). K.H acknowledges a Career Researcher grant from the South‐Eastern Norway Regional Health Authority (project number 2012054), a Researcher grant from the Norwegian Cancer Society (project number 163303), and an EMBO Short Term Fellowship (ASTF 391‐2010). L.M and A.L‐J have been supported by the above grant to K.H from the South‐Eastern Norway Regional Health Authority (project number 2012054). This work was partly supported by the Research Council of Norway through its Centres of Excellence funding scheme, project numbers 179571 and 262652. Support from the Simon Fougner Hartmann foundation is also acknowledged.
The EMBO Journal (2018) 37: e97741
References
- Akhmanova A, Steinmetz MO (2015) Control of microtubule organization and dynamics: two ends in the limelight. Nat Rev Mol Cell Biol 16: 711–726 [DOI] [PubMed] [Google Scholar]
- Basto R, Lau J, Vinogradova T, Gardiol A, Woods CG, Khodjakov A, Raff JW (2006) Flies without centrioles. Cell 125: 1375–1386 [DOI] [PubMed] [Google Scholar]
- Bastos RN, Barr FA (2010) Plk1 negatively regulates Cep55 recruitment to the midbody to ensure orderly abscission. J Cell Biol 191: 751–760 [DOI] [PMC free article] [PubMed] [Google Scholar]
- Bergstralh DT, Dawney NS, St Johnston D (2017) Spindle orientation: a question of complex positioning. Development 144: 1137–1145 [DOI] [PubMed] [Google Scholar]
- Bissig C, Gruenberg J (2014) ALIX and the multivesicular endosome: ALIX in Wonderland. Trends Cell Biol 24: 19–25 [DOI] [PubMed] [Google Scholar]
- Bosveld F, Markova O, Guirao B, Martin C, Wang Z, Pierre A, Balakireva M, Gaugue I, Ainslie A, Christophorou N, Lubensky DK, Minc N, Bellaiche Y (2016) Epithelial tricellular junctions act as interphase cell shape sensors to orient mitosis. Nature 530: 495–498 [DOI] [PMC free article] [PubMed] [Google Scholar]
- Bowman SK, Neumuller RA, Novatchkova M, Du Q, Knoblich JA (2006) The Drosophila NuMA homolog Mud regulates spindle orientation in asymmetric cell division. Dev Cell 10: 731–742 [DOI] [PubMed] [Google Scholar]
- Cabernard C, Doe CQ (2009) Apical/basal spindle orientation is required for neuroblast homeostasis and neuronal differentiation in Drosophila . Dev Cell 17: 134–141 [DOI] [PubMed] [Google Scholar]
- Campos Y, Qiu X, Gomero E, Wakefield R, Horner L, Brutkowski W, Han YG, Solecki D, Frase S, Bongiovanni A, d'Azzo A (2016) Alix‐mediated assembly of the actomyosin‐tight junction polarity complex preserves epithelial polarity and epithelial barrier. Nat Commun 7: 11876 [DOI] [PMC free article] [PubMed] [Google Scholar]
- Carlton JG, Martin‐Serrano J (2007) Parallels between cytokinesis and retroviral budding: a role for the ESCRT machinery. Science 316: 1908–1912 [DOI] [PubMed] [Google Scholar]
- Carlton JG, Agromayor M, Martin‐Serrano J (2008) Differential requirements for Alix and ESCRT‐III in cytokinesis and HIV‐1 release. Proc Natl Acad Sci USA 105: 10541–10546 [DOI] [PMC free article] [PubMed] [Google Scholar]
- Chen CT, Hehnly H, Yu Q, Farkas D, Zheng G, Redick SD, Hung HF, Samtani R, Jurczyk A, Akbarian S, Wise C, Jackson A, Bober M, Guo Y, Lo C, Doxsey S (2014) A unique set of centrosome proteins requires pericentrin for spindle‐pole localization and spindle orientation. Curr Biol 24: 2327–2334 [DOI] [PMC free article] [PubMed] [Google Scholar]
- Chen C, Fingerhut JM, Yamashita YM (2016a) The ins(ide) and outs(ide) of asymmetric stem cell division. Curr Opin Cell Biol 43: 1–6 [DOI] [PMC free article] [PubMed] [Google Scholar]
- Chen K, Koe CT, Xing ZB, Tian X, Rossi F, Wang C, Tang Q, Zong W, Hong WJ, Taneja R, Yu F, Gonzalez C, Wu C, Endow S, Wang H (2016b) Arl2‐ and Msps‐dependent microtubule growth governs asymmetric division. J Cell Biol 212: 661–676 [DOI] [PMC free article] [PubMed] [Google Scholar]
- Christ L, Wenzel EM, Liestol K, Raiborg C, Campsteijn C, Stenmark H (2016) ALIX and ESCRT‐I/II function as parallel ESCRT‐III recruiters in cytokinetic abscission. J Cell Biol 212: 499–513 [DOI] [PMC free article] [PubMed] [Google Scholar]
- Christ L, Raiborg C, Wenzel EM, Campsteijn C, Stenmark H (2017) Cellular functions and molecular mechanisms of the ESCRT membrane‐scission machinery. Trends Biochem Sci 42: 42–56 [DOI] [PubMed] [Google Scholar]
- Conduit PT, Brunk K, Dobbelaere J, Dix CI, Lucas EP, Raff JW (2010) Centrioles regulate centrosome size by controlling the rate of Cnn incorporation into the PCM. Curr Biol 20: 2178–2186 [DOI] [PubMed] [Google Scholar]
- Conduit PT, Richens JH, Wainman A, Holder J, Vicente CC, Pratt MB, Dix CI, Novak ZA, Dobbie IM, Schermelleh L, Raff JW (2014) A molecular mechanism of mitotic centrosome assembly in Drosophila . eLife 3: e03399 [DOI] [PMC free article] [PubMed] [Google Scholar]
- Conduit PT, Wainman A, Raff JW (2015) Centrosome function and assembly in animal cells. Nat Rev Mol Cell Biol 16: 611–624 [DOI] [PubMed] [Google Scholar]
- Dallol A, Cooper WN, Al‐Mulla F, Agathanggelou A, Maher ER, Latif F (2007) Depletion of the Ras association domain family 1, isoform A‐associated novel microtubule‐associated protein, C19ORF5/MAP1S, causes mitotic abnormalities. Can Res 67: 492–500 [DOI] [PubMed] [Google Scholar]
- D'Avino PP, Giansanti MG, Petronczki M (2015) Cytokinesis in animal cells. Cold Spring Harb Perspect Biol 7: a015834 [DOI] [PMC free article] [PubMed] [Google Scholar]
- Eikenes AH, Malerod L, Christensen AL, Steen CB, Mathieu J, Nezis IP, Liestol K, Huynh JR, Stenmark H, Haglund K (2015) ALIX and ESCRT‐III coordinately control cytokinetic abscission during germline stem cell division in vivo . PLoS Genet 11: e1004904 [DOI] [PMC free article] [PubMed] [Google Scholar]
- Fabbro M, Zhou BB, Takahashi M, Sarcevic B, Lal P, Graham ME, Gabrielli BG, Robinson PJ, Nigg EA, Ono Y, Khanna KK (2005) Cdk1/Erk2‐ and Plk1‐dependent phosphorylation of a centrosome protein, Cep55, is required for its recruitment to midbody and cytokinesis. Dev Cell 9: 477–488 [DOI] [PubMed] [Google Scholar]
- Fong KW, Choi YK, Rattner JB, Qi RZ (2008) CDK5RAP2 is a pericentriolar protein that functions in centrosomal attachment of the gamma‐tubulin ring complex. Mol Biol Cell 19: 115–125 [DOI] [PMC free article] [PubMed] [Google Scholar]
- Fujita H, Yoshino Y, Chiba N (2016) Regulation of the centrosome cycle. Mol Cell Oncol 3: e1075643 [DOI] [PMC free article] [PubMed] [Google Scholar]
- Giansanti MG, Gatti M, Bonaccorsi S (2001) The role of centrosomes and astral microtubules during asymmetric division of Drosophila neuroblasts. Development 128: 1137–1145 [DOI] [PubMed] [Google Scholar]
- Giansanti MG, Bucciarelli E, Bonaccorsi S, Gatti M (2008) Drosophila SPD‐2 is an essential centriole component required for PCM recruitment and astral‐microtubule nucleation. Curr Biol 18: 303–309 [DOI] [PubMed] [Google Scholar]
- Gomez‐Ferreria MA, Rath U, Buster DW, Chanda SK, Caldwell JS, Rines DR, Sharp DJ (2007) Human Cep192 is required for mitotic centrosome and spindle assembly. Curr Biol 17: 1960–1966 [DOI] [PubMed] [Google Scholar]
- Gonzalez C (2007) Spindle orientation, asymmetric division and tumour suppression in Drosophila stem cells. Nat Rev Genet 8: 462–472 [DOI] [PubMed] [Google Scholar]
- Green RA, Mayers JR, Wang S, Lewellyn L, Desai A, Audhya A, Oegema K (2013) The midbody ring scaffolds the abscission machinery in the absence of midbody microtubules. J Cell Biol 203: 505–520 [DOI] [PMC free article] [PubMed] [Google Scholar]
- Halpain S, Dehmelt L (2006) The MAP1 family of microtubule‐associated proteins. Genome Biol 7: 224 [DOI] [PMC free article] [PubMed] [Google Scholar]
- Inaba M, Yamashita YM (2012) Asymmetric stem cell division: precision for robustness. Cell Stem Cell 11: 461–469 [DOI] [PubMed] [Google Scholar]
- Izumi Y, Ohta N, Hisata K, Raabe T, Matsuzaki F (2006) Drosophila Pins‐binding protein Mud regulates spindle‐polarity coupling and centrosome organization. Nat Cell Biol 8: 586–593 [DOI] [PubMed] [Google Scholar]
- Jaffe AB, Kaji N, Durgan J, Hall A (2008) Cdc42 controls spindle orientation to position the apical surface during epithelial morphogenesis. J Cell Biol 183: 625–633 [DOI] [PMC free article] [PubMed] [Google Scholar]
- Kelsom C, Lu W (2012) Uncovering the link between malfunctions in Drosophila neuroblast asymmetric cell division and tumorigenesis. Cell Biosci 2: 38 [DOI] [PMC free article] [PubMed] [Google Scholar]
- Kiyomitsu T (2015) Mechanisms of daughter cell‐size control during cell division. Trends Cell Biol 25: 286–295 [DOI] [PubMed] [Google Scholar]
- Langevin J, Morgan MJ, Sibarita JB, Aresta S, Murthy M, Schwarz T, Camonis J, Bellaiche Y (2005) Drosophila exocyst components Sec5, Sec6, and Sec15 regulate DE‐Cadherin trafficking from recycling endosomes to the plasma membrane. Dev Cell 9: 365–376 [DOI] [PubMed] [Google Scholar]
- Lattao R, Kovacs L, Glover DM (2017) The centrioles, centrosomes, basal bodies, and cilia of Drosophila melanogaster . Genetics 206: 33–53 [DOI] [PMC free article] [PubMed] [Google Scholar]
- Lee HH, Elia N, Ghirlando R, Lippincott‐Schwartz J, Hurley JH (2008) Midbody targeting of the ESCRT machinery by a noncanonical coiled coil in CEP55. Science 322: 576–580 [DOI] [PMC free article] [PubMed] [Google Scholar]
- Meraldi P (2016) Centrosomes in spindle organization and chromosome segregation: a mechanistic view. Chromosome Res 24: 19–34 [DOI] [PubMed] [Google Scholar]
- Morin X, Bellaiche Y (2011) Mitotic spindle orientation in asymmetric and symmetric cell divisions during animal development. Dev Cell 21: 102–119 [DOI] [PubMed] [Google Scholar]
- Morita E, Sandrin V, Chung HY, Morham SG, Gygi SP, Rodesch CK, Sundquist WI (2007) Human ESCRT and ALIX proteins interact with proteins of the midbody and function in cytokinesis. EMBO J 26: 4215–4227 [DOI] [PMC free article] [PubMed] [Google Scholar]
- Oakley BR, Paolillo V, Zheng Y (2015) Gamma‐Tubulin complexes in microtubule nucleation and beyond. Mol Biol Cell 26: 2957–2962 [DOI] [PMC free article] [PubMed] [Google Scholar]
- Odenwald MA, Choi W, Buckley A, Shashikanth N, Joseph NE, Wang Y, Warren MH, Buschmann MM, Pavlyuk R, Hildebrand J, Margolis B, Fanning AS, Turner JR (2017) ZO‐1 interactions with F‐actin and occludin direct epithelial polarization and single lumen specification in 3D culture. J Cell Sci 130: 243–259 [DOI] [PMC free article] [PubMed] [Google Scholar]
- Orban‐Nemeth Z, Simader H, Badurek S, Trancikova A, Propst F (2005) Microtubule‐associated protein 1S, a short and ubiquitously expressed member of the microtubule‐associated protein 1 family. J Biol Chem 280: 2257–2265 [DOI] [PubMed] [Google Scholar]
- Ott C, Nachmias D, Adar S, Jarnik M, Sherman S, Birnbaum RY, Lippincott‐Schwartz J, Elia N (2018) VPS4 is a dynamic component of the centrosome that regulates centrosome localization of gamma‐tubulin, centriolar satellite stability and ciliogenesis. Sci Rep 8: 3353 [DOI] [PMC free article] [PubMed] [Google Scholar]
- Paz J, Luders J (2018) Microtubule‐organizing centers: towards a minimal parts list. Trends Cell Biol 28: 176–187 [DOI] [PubMed] [Google Scholar]
- di Pietro F, Echard A, Morin X (2016) Regulation of mitotic spindle orientation: an integrated view. EMBO Rep 17: 1106–1130 [DOI] [PMC free article] [PubMed] [Google Scholar]
- Pihan GA (2013) Centrosome dysfunction contributes to chromosome instability, chromoanagenesis, and genome reprograming in cancer. Front Oncol 3: 277 [DOI] [PMC free article] [PubMed] [Google Scholar]
- Raynaud‐Messina B, Debec A, Tollon Y, Gares M, Wright M (2001) Differential properties of the two Drosophila gamma‐tubulin isotypes. Eur J Cell Biol 80: 643–649 [DOI] [PubMed] [Google Scholar]
- Raynaud‐Messina B, Mazzolini L, Moisand A, Cirinesi AM, Wright M (2004) Elongation of centriolar microtubule triplets contributes to the formation of the mitotic spindle in gamma‐tubulin‐depleted cells. J Cell Sci 117: 5497–5507 [DOI] [PubMed] [Google Scholar]
- Rebollo E, Sampaio P, Januschke J, Llamazares S, Varmark H, Gonzalez C (2007) Functionally unequal centrosomes drive spindle orientation in asymmetrically dividing Drosophila neural stem cells. Dev Cell 12: 467–474 [DOI] [PubMed] [Google Scholar]
- Sampaio P, Rebollo E, Varmark H, Sunkel CE, Gonzalez C (2001) Organized microtubule arrays in gamma‐tubulin‐depleted Drosophila spermatocytes. Curr Biol 11: 1788–1793 [DOI] [PubMed] [Google Scholar]
- Sanchez AD, Feldman JL (2017) Microtubule‐organizing centers: from the centrosome to non‐centrosomal sites. Curr Opin Cell Biol 44: 93–101 [DOI] [PMC free article] [PubMed] [Google Scholar]
- Santoro A, Vlachou T, Carminati M, Pelicci PG, Mapelli M (2016) Molecular mechanisms of asymmetric divisions in mammary stem cells. EMBO Rep 17: 1700–1720 [DOI] [PMC free article] [PubMed] [Google Scholar]
- Schmidt MH, Chen B, Randazzo LM, Bogler O (2003) SETA/CIN85/Ruk and its binding partner AIP1 associate with diverse cytoskeletal elements, including FAKs, and modulate cell adhesion. J Cell Sci 116: 2845–2855 [DOI] [PubMed] [Google Scholar]
- Seldin L, Poulson ND, Foote HP, Lechler T (2013) NuMA localization, stability, and function in spindle orientation involve 4.1 and Cdk1 interactions. Mol Biol Cell 24: 3651–3662 [DOI] [PMC free article] [PubMed] [Google Scholar]
- Siller KH, Cabernard C, Doe CQ (2006) The NuMA‐related Mud protein binds Pins and regulates spindle orientation in Drosophila neuroblasts. Nat Cell Biol 8: 594–600 [DOI] [PubMed] [Google Scholar]
- Siller KH, Doe CQ (2009) Spindle orientation during asymmetric cell division. Nat Cell Biol 11: 365–374 [DOI] [PubMed] [Google Scholar]
- Singh P, Thomas GE, Gireesh KK, Manna TK (2014) TACC3 protein regulates microtubule nucleation by affecting gamma‐tubulin ring complexes. J Biol Chem 289: 31719–31735 [DOI] [PMC free article] [PubMed] [Google Scholar]
- Sonnen KF, Schermelleh L, Leonhardt H, Nigg EA (2012) 3D‐structured illumination microscopy provides novel insight into architecture of human centrosomes. Biol Open 1: 965–976 [DOI] [PMC free article] [PubMed] [Google Scholar]
- Srayko M, Kaya A, Stamford J, Hyman AA (2005) Identification and characterization of factors required for microtubule growth and nucleation in the early C. elegans embryo. Dev Cell 9: 223–236 [DOI] [PubMed] [Google Scholar]
- Sulimenko V, Hajkova Z, Klebanovych A, Draber P (2017) Regulation of microtubule nucleation mediated by gamma‐tubulin complexes. Protoplasma 254: 1187–1199 [DOI] [PubMed] [Google Scholar]
- Tegha‐Dunghu J, Bausch E, Neumann B, Wuensche A, Walter T, Ellenberg J, Gruss OJ (2014) MAP1S controls microtubule stability throughout the cell cycle in human cells. J Cell Sci 127: 5007–5013 [DOI] [PubMed] [Google Scholar]
- Tuncay H, Ebnet K (2016) Cell adhesion molecule control of planar spindle orientation. Cell Mol Life Sci 73: 1195–1207 [DOI] [PMC free article] [PubMed] [Google Scholar]
- Verollet C, Colombie N, Daubon T, Bourbon HM, Wright M, Raynaud‐Messina B (2006) Drosophila melanogaster gamma‐TuRC is dispensable for targeting gamma‐tubulin to the centrosome and microtubule nucleation. J Cell Biol 172: 517–528 [DOI] [PMC free article] [PubMed] [Google Scholar]
- Wang H, Cai Y, Chia W, Yang X (2006) Drosophila homologs of mammalian TNF/TNFR‐related molecules regulate segregation of Miranda/Prospero in neuroblasts. EMBO J 25: 5783–5793 [DOI] [PMC free article] [PubMed] [Google Scholar]
- Wloga D, Joachimiak E, Fabczak H (2017) Tubulin post‐translational modifications and microtubule dynamics. Int J Mol Sci 18: 2207 [DOI] [PMC free article] [PubMed] [Google Scholar]
- Woodruff JB, Wueseke O, Hyman AA (2014) Pericentriolar material structure and dynamics. Philos Trans R Soc Lond B Biol Sci 369: 20130459 [DOI] [PMC free article] [PubMed] [Google Scholar]
- Zhang X, Cromwell JW, Kunjummen BD, Yee D, Garcia‐Aguilar J (2003) The alpha2 and alpha3 integrins are required for morphologic differentiation of an intestinal epithelial cell line. Surgery 133: 429–437 [DOI] [PubMed] [Google Scholar]
- Zhao WM, Seki A, Fang G (2006) Cep55, a microtubule‐bundling protein, associates with centralspindlin to control the midbody integrity and cell abscission during cytokinesis. Mol Biol Cell 17: 3881–3896 [DOI] [PMC free article] [PubMed] [Google Scholar]
- Zhu M, Settele F, Kotak S, Sanchez‐Pulido L, Ehret L, Ponting CP, Gonczy P, Hoffmann I (2013) MISP is a novel Plk1 substrate required for proper spindle orientation and mitotic progression. J Cell Biol 200: 773–787 [DOI] [PMC free article] [PubMed] [Google Scholar]
Associated Data
This section collects any data citations, data availability statements, or supplementary materials included in this article.
Supplementary Materials
Appendix
Expanded View Figures PDF
Dataset EV1
Source Data for Expanded View
Review Process File
Source Data for Figure 2
Source Data for Figure 3
Source Data for Figure 4
Source Data for Figure 5
Source Data for Figure 6
Source Data for Figure 8
Data Availability Statement
The mass spectrometry proteomics data have been deposited to the ProteomeXchange Consortium via the PRIDE partner repository with the dataset identifier PXD009747.