

Abstract
Enterotoxins increase intestinal fluid secretion through the modulation of ion channels as well as activating the enteric nervous and immune systems. Colonic organoids, also known as colonoids, are functionally and phenotypically similar to in vivo colonic epithelium, and have been used to study intestinal ion transport and subsequent water flux in physiology and disease models. In conventional cultures, organoids exist as spheroids embedded within a hydrogel patty of extracellular matrix, and form at multiple depths impairing efficient imaging which is necessary to capture data from statistically relevant sample sizes. To overcome these limitations, an analytical platform with colonic organoids localized to the planar surface of a hydrogel layer was developed. The arrays of densely-packed colonoids (140-μm average diameter, 4 colonoids/mm2) were generated in a 96-well plate enabling assay of the response of hundreds of organoids so that organoid subpopulations with distinct behaviors were identifiable. Organoid cell types, monolayer polarity, and growth was similar to those embedded in hydrogel. An automated imaging and analysis platform efficiently tracked over time swelling due to forskolin and cholera toxin stimulated fluid movement across the cell monolayer. The platform was used to screen compounds associated with the enteric nervous and immune systems for their effect on fluid movement across epithelial cells. Prostaglandin E2 promoted increased water flux in a subset of organoids resulting in organoid swelling confirming a role for this inflammatory mediator in diarrheal conditions but also illustrating organoid differences in response to an identical stimulus. By sampling a large number of organoids, the arrayed organoid platform permits identification of organoid subpopulations intermixed within a larger group of nonresponding organoids. This technique will enable automated, large-scale screening of the impact of drugs, toxins and other compounds on colonic physiology.
INTRODUCTION
Infectious diarrheas caused by bacterial production of enterotoxins are common diseases worldwide. Enterotoxins, such as cholera toxin produced by the bacteria Vibrio cholerae, interact with intestinal epithelial cells to increase the movement of water and ions into the intestinal lumen, the consequence of which is severe diarrhea.1 Cholera toxin acts through a series of steps that include binding of the toxin to the surface of epithelial cells, endocytosis and a series of enzymatic reactions that result in the release of the cholera toxin A1 (CTA1) chain which binds to the intracellular protein ADP-ribosylation factor 6 (Arf6) resulting in CTA1 activation.2 Through an additional series of enzymatic steps, CTA1 increases the activity of the Gs alpha subunit (Gαs) proteins leading to increased adenylyl cyclase activity that results in an elevation in 3′,5′-cyclic AMP (cAMP) concentration more than 100-fold higher than normal leading to increased activity of protein kinase A (PKA). Phosphorylation of the cystic fibrosis transmembrane conductance regulator (CFTR) chloride channel proteins by PKA then leads to ATP-mediated efflux of chloride ions resulting in the movement of H2O as well as sodium, potassium and bicarbonate ions into the intestinal lumen.1,3,4 The calcium activated chloride channel (CLCA) can also cause fluid migration in response to toxin-mediated increase in the concentration of intracellular Ca2+.5 Other enterotoxins also secreted by the Vibrio bacteria are known to activate the enteric nervous and immune systems producing agonists such as prostaglandins, acetylcholine and histamine which can also participate in intestinal ion and water movement through intracellular cAMP or Ca2+ signaling.1 The synergistic impact of enterotoxin-mediated effects combine to increase intestinal secretion yielding rapid and cumulative fluid loss of up to 2 liters per hour into the intestine causing severe dehydration that may result in death.6
To study intestinal ion secretion and fluid movement, tissue-cultured tumor cell lines are often used as surrogate intestinal cells. However, the genetic profile and functional properties of tumor cells do not match that of primary tissue.7 Intestinal organoids derived from primary cells offer a more accurate functional model of in vivo tissue physiology compared to that of tumor cells.8,9 Proliferative organoids are readily cultured from crypts or stem cells isolated from the intestine and are maintained by culture within a thick layer of hydrogel (typically Matrigel) in the presence of a medium rich in growth factors.10 The organoids possess all cell types of the intestine including stem/proliferative cells, enterocytes and goblet cells. These cells form a monolayer surrounding a central lumen and are polarized so that their luminal surface faces into the central cavity while the basal cell surface makes contacts with the extracellular matrix proteins within the surrounding hydrogel. This cell polarity enables the organoids to retain many physiologic functions such as the transport of ions across the monolayer.8,11 Contact between the basal, cell-surface proteins and the extracellular matrix is thought to be required to provide the correct mechanical and chemical environment for proper organoid formation, monolayer polarity, and ion transport function.8,12,13
Intestinal organoids have been used for nutrient14, P-glycoprotein (P-gp)15, and ion transport assays.11 When ions are secreted by the monolayer, water follows by a passive mechanism termed osmosis. When sufficient numbers of ions are secreted, the increase in luminal volume due to water movement results in the swelling of these spheroidal structures and an increase in the organoid’s cross-sectional area. This area increase can be measured directly11,16 or indirectly17 when imaged by microscopy. This phenomena has enabled intestinal organoids to be used in the study of drug effects, genetic mutation impact, and toxin effect on ion secretion in the organoids.11,16,18–20 However, embedding the organoids fully within a hydrogel poses a number of challenges to increasing the assay throughput.21 The organoids cultured in a Petri dish or multiwell plate are typically positioned at random locations along the x, y, and z axes of the thick hydrogel layer leaving the organoids in varying image planes when viewed by microscopy. This creates two challenges that severely limit assay speed: organoids that are out of focus when using a single image plane and organoids that overlap in the x-y plane when viewed from above or below by standard microscopy. Strategies to mitigate these weaknesses would increase the numbers of organoids per well that are suitable for assay and increase experimental throughput. A second disadvantage is that compounds and drugs must diffuse through the hydrogel to access the organoid. Interactions of the molecules with the Matrigel can impose a time delay in compounds reaching the organoid or decrease the concentration of the compound at the organoid’s location. Thus, the compound-Matrigel interactions represent an uncontrolled variable in organoid experiments.
We describe the development of a method to create a planar array of colonoids with the colonoids located on the surface of a hydrogel and compatible with automated image-based assays. The properties of the surface-positioned colonoids were compared to hydrogel-embedded organoids. Software to perform organoid segmentation and separation of nearby organoids as well as identification of the colonoid location was implemented. An automated analysis pipeline identified and quantified the properties of organoids over time and was compared to manual identification and measurement. Colonoid swelling in response to forskolin, cholera toxin and physiologic molecules was assessed to characterize the extent and heterogeneity of swelling in a population of organoids as well as the rate of fluid movement across the organoid wall. This approach should enable efficient, large-scale screening of the impact of drugs, toxins and other compounds on colonoid physiology.
EXPERIMENTAL SECTION
Materials
Polystyrene 96-well plates were purchased from Denville Scientific, Inc, Holliston, MA. Transwells, Matrigel, EDTA, HEPES and gentamicin were purchased from Corning, NY. DMSO was acquired from Santa Cruz Biotechnology, Dallas, TX. Optimum cutting temperature (O.C.T.) formulation was obtained from Tissue-Tek®, Sakura Finetek USA, Inc. Torrance, CA. Na2HPO4, KH2PO4, NaCl, KCl, advanced DMEM/F-12 medium, dithiothreitol (DTT), GlutaMAX, penicillin and streptomycin were from Thermo Fisher Scientific, Waltham, MA. Epidermal growth factor (EGF), N-acetyl cysteine, sucrose, D-sorbitol, cholera toxin and subunit B, bradykinin, prostaglandin E2, adenosine, serotonin, acetylcholine and histamine were purchased from Sigma, St. Louis, MO. Vasoactive intestinal peptide was purchased from AnaSpec, Fremont, CA. Fetal bovine serum (FBS) was obtained from Atlanta Biologicals, Flowery Branch, GA. Collagenase Type iv was purchased from Worthington Biochemical Corporation, Lakewood, NJ. Information for staining and assay kits are provided in the relevant sections of the Experimental Section.
Isolation of crypts from mouse colon and initial culture
The cytomegalovirus enhancer plus chicken actin promoter (CAG)-DsRed mouse model in which all cells expressed the DsRed fluorescent protein, and wild-type (WT) mice were used for experiments.22,23 All experiments and animal usage were in compliance with the University of North Carolina animal care protocol and were approved by the Institutional Animal Care and Use Committee (IACUC). Mice heterozygous for DsRed expression were bred on a CD-1 background and WT mice were bred on a C57BL/6 background. Mice (male and female ages 6-10 months) were humanely euthanized by a lethal dose of isoflurane followed by cervical dislocation under the UNC IACUC-approved protocol #13-200. A detailed procedure for crypt isolation and culture was previously reported.24,25 Briefly, a colon was surgically extracted from a mouse following euthanasia. The colon was then opened longitudinally and incubated with EDTA (2 mM) and DTT (0.5 mM) in isolation buffer (5.6 mM Na2HPO4, 8.0 mM KH2PO4, 96.2 mM NaCl, 1.6 mM KCl, 43.4 mM sucrose, 54.9 mM D-sorbitol at pH 7.4) for 75 min at room temperature prior to isolation of crypts. Then the tissue was vigorously shaken in a conical tube with isolation buffer to release the crypts from the underlying stroma. Released crypts were pelleted by centrifugation and mixed with Matrigel (2500 crypts in 100 μL of Matrigel) on ice (4 °C). 10 μL of this mix was plated in wells of a 24-well plate, and the plate was immediately inverted to prevent any contacts between tissue pieces and the polystyrene surface. The Matrigel was then cured at 37 °C in a cell culture incubator for 15 min. These cultures were subcultured up to 5 times.
Both embedded and arrayed cultures were grown in medium rich in growth factors termed stem cell medium (SM). SM was prepared by diluting Wnt 3A, R-spondin 2 and Noggin conditioned medium in advanced DMEM/F-12 basal medium and adding necessary nutrients and buffers. Final concentrations of each growth factor were Wnt 3A (80 ng/mL), R-spondin 2 (38 ng/mL), Noggin (36 ng/mL), GlutaMAX (1×), HEPES (10 mM), N-acetyl cysteine (1.25 mM), murine EGF (50 ng/mL), penicillin (100 unit/mL), streptomycin (100 μg/mL), and gentamicin (50 μg/mL). The concentration of Wnt 3A was determined by Wnt 3A ELISA kit (LifeSpan BioSciences, Inc, Seattle, WA). R-spondin 2 and Noggin growth factor concentrations were measured as described previously.22 The assay medium contained the same nutrients and buffers in similar concentrations to SM except Wnt 3A (26 ng/mL), R-spondin 2 (30 ng/mL), and Noggin (56 ng/mL).
Generation of arrayed colonoids
A planar biomimetic scaffold comprised of Matrigel (protein concentration 9.2 mg/mL) was prepared in a multiwell plate. For a 96-well plate, 75 μL of Matrigel was dispensed to each well, and for 12-well Transwells® 200 μL Matrigel was dispensed to produce a Matrigel layer 2.4 mm thick. The plate was centrifuged for 1.5 min using 2000 rcf at 1 °C. The plate was transferred to a 37 °C cell culture incubator for 10 min for Matrigel gelation. To grow organoids on these surfaces, colonoids grown in a Matrigel patty were isolated by incubation with collagenase (Type IV, 500 U/mL) to breakup the Matrigel. After release of the colonoids from the hydrogel, the colonoids were gently, mechanically dissociation. Fragmented colonoids (≤50 μm in diameter) containing cells derived from a WT or CAG Ds-Red mouse were added to the surface of a Matrigel-filled well as a suspension (120,000 cells) in SM. The number of cells in the isolated colonoids was calculated using CellTiter-Glo® luminescence cell viability assay (Promega US, Madison, WI) according to the manufacturer’s protocol. Over the first 24 h in culture, colonoid fragments (≤50 μm diameter) were allowed to adhere to the Matrigel layer. Over the course of the subsequent 2-3 days, these fragments developed into colonoids ≥100 μm in diameter. Arrays were imaged using a Nikon Eclipse TE300 inverted epifluorescence microscope with an estimated objective depth of field of >59 μm (N.A. 0.13) for comparison with 3D embedded cultures. The viability of colonoids after culturing 72 h on an array was measured using propidium iodide (PI) as a marker of cells death and Hoechst 33342 as a counterstain. After 72 h of culture 100% of the colonoids were viable.
Colonoid characterization
Colonoids were grown on the surface of Matrigel layered onto the membrane of a 12-well Transwell® insert. After culturing the colonoids for 3-days, the array was fixed using 4% paraformaldehyde for 25 min. The array was incubated with 30% sucrose for 3 h and kept in O.C.T. formulation overnight. The membrane was cut out of the insert and the tissue was sectioned using a cryostat to obtain 10-μm thick slices. These slices were stained using fluorescently-labeled phalloidin for F-actin (ActinGreen™ 488, Molecular Probes, Thermo Fisher Scientific, Waltham, MA) and Hoechst 33342, then imaged by fluorescence microscopy.
Cell lineages in arrayed colonoids
To mark S-phase cells, 5-ethynyl-2′-deoxyuridine (EdU, 10 μM in SM) was incubated on the arrays for 4 h. The arrays were then fixed in 4% paraformaldehyde for 20 min and incubated with 0.5% Triton X-100 for 20 min to facilitate diffusion of the labeling reagents into the cells. EdU-marked cells were then stained using Click-iT EdU Alexa Fluor 647 imaging kit (Thermo Fisher Scientific, Waltham, MA). Next the goblet cells were stained using rabbit anti-mucin2 (α-Muc2, 1:200, Santa Cruz Biotechnology, Inc, Dallas, Texas, #sc-15334).26 A secondary antibody, Alexa Fluor 488 α-rabbit (1:500, Jackson Immunoresearch, West Grove, PA, # 711-545-152), was used to fluorescently label the primary antibody. Stained colonoids were imaged using a Nikon Eclipse TE300 inverted epifluorescence microscope with an estimated objective depth of field of >11 μm (N.A. 0.3).
Automated fluorescence imaging of arrayed colonoids
Automated imaging of arrayed colonoids was performed using an Olympus IX81 inverted epifluorescence microscope with a 4× objective (Olympus UPlanFL N, N.A. of 0.13 with an estimated objective depth of field of 40 μm) and a CoolSNAP HQ2 CCD camera (Photometrics, Tucson, AZ) or Hamamatsu Flash 4.0 VZ (Hamamatsu, Japan). Colonoids in this study were fluorescently labeled, either by labeling with Hoechst 33342 to stain DNA or by using colonoids derived from CAG-DsRed mouse model in which all cells expressed the DsRed fluorescent protein. For fluorescence imaging of DSRed and Hoechst 33342, a Chroma ET-YFP 49003, and Chroma ET-DAPI 49000 were used, respectively. The microscope was equipped with a humidified incubation chamber maintaining an environment at 5% CO2 and 37 °C. All automated image acquisition was controlled by a custom MATLAB program (MATLAB 2014b, The MathWorks, Inc., Natick, MA) harnessing Micro-Manager microscopy software. Individual wells within plates were imaged using overlapping fields of view (i.e. a 6 × 4 image tiling to covering a single well of a 96-well plate).
Despite the curved shape of the Matrigel substrate (a concave meniscus measuring 595 ± 84 μm from top to bottom over a 2 × 2 mm area, mean ± standard deviation, n=3), well-focused images of the colonoid arrays were obtained in an automated fashion. Two strategies were combined to compensate for any curvature of the Matrigel surface upon which the arrayed colonoids were cultured. First, prior to image acquisition, an autofocus scan of the colonoid array was performed to determine focal positions for each desired imaging region throughout the array. A software-based autofocus was used that maximized the standard deviation of the pixel intensity in fluorescence images of the colonoids. To further guarantee well-focused images, 40% image overlap was employed during mosaicking and only the highly focused, central non-overlapped portion of each image was used for subsequent analysis. Once the imaging positions were determined utilizing these approaches, a 15 mm2 area composed of 4 × 6 images with 40% overlap between fields was acquired for each well in 22 s. The 15 mm2 area was chosen to avoid imaging too close to the well walls (well area: 32 mm2 for 96-well plates).
Image analysis and assay metrics
All image analyses were performed using custom MATLAB scripts. The analyses began by forming full-well images by stitching together the well-focused central portions of the images from a well. Colonoids were identified by segmenting the Hoechst or DsRed fluorescent images using Otsu’s automatic intensity thresholding.27 For some colonoids the fluorescence labeling was dim, which interfered with basic intensity-thresholded segmentation. For these colonoids intensity thresholding did not detect the full colonoid boundary, and thus the segmentation was discontinuous when in reality the colonoids had an intact and continuous border. To compensate, a morphological closing operation using a disk of 19 μm radius (3 pixels) was applied. Objects below 100 μm in effective diameter were removed to eliminate debris, dead cells, and organoid fragments. Segmentation holes were filled and adjacent colonoids separated using a geometric watershed transform.28 Colonoid centroids, areas, and mean fluorescence intensities were automatically recorded within the colonoid boundaries identified in the final segmentation masks.
In order to track colonoid properties over time, an algorithm was constructed to match the colonoids in the images acquired at different time points. Every identified colonoid’s centroid was measured at each time point. When tracking colonoids over time, colonoids whose centroids varied less than 100 μm along the plane of the array and whose areas varied by less than 25% between time-points were considered to be the same colonoid. In the event of temporal gaps in the tracking of a colonoid, the algorithm linearly interpolated colonoid measurements for up to 2 time points. Colonoids with 3 or more untracked time points were excluded from analysis.
Several metrics were used to quantify changes in colonoid size over time. The magnitude of the change in a colonoid’s area was measured as the percent area increase relative to the initial area (ΔA expressed as a %) or maximal value of ΔA during the assay time (ΔAmax expressed as a %). The initial rate of size increase of colonoids was quantified as the slope of a linear fit (R2>0.85) of area as a function of time. By assuming colonoids are spherical and swell isotropically, area rates of change could be converted into net fluid flux occurring between time points 1 and 2 according to: , where Vi, and Ai, represent the colonoid volume and colonoid surface at time 1 and 2 (ti). To cluster colonoid subpopulations, an expanded 10 dimensional data set was extracted per colonoid (See Supporting Information Methods). Supervised clustering to classify individual colonoids into “non-responsive” (i.e. negative control-like) or “responsive” (i.e. positive control-like) groups was performed using a binary linear support vector machine classifier (MATLAB’s fitcsvm).29 Unsupervised clustering was performed using k-means clustering with k = 2. For classification, each dimension of the data was centered and scaled by the mean and standard deviation. Classification accuracy was estimated using 5 cross-validation folds.
cAMP-stimulated transport
Colonoids at day 2 of growth on the array were used for all fluid transport assays since these colonoids are comprised primarily of stem/proliferative cells which are thought to play a major role in fluid secretion.30 Wild type colonoids were stained with Hoechst 33342 (2 μM in assay medium) for 25 min. Forskolin was used for activation of adenylyl cyclase to increase the intracellular cAMP concentration. Forskolin (1 μM), cholera toxin (C-T, 5 μg/mL or 0.5 μg/mL) or subunit B of C-T (C-B, 5 μg/mL or 0.5 μg/mL) in assay medium was added to arrayed colonoids which were then immediately imaged every 3 min for 1-1.5 h. DMSO in an amount equivalent to that in the added forskolin was added to control wells. The viability of colonoids after 48 h on the array with and without an additional 1 h forskolin challenge was measured using propidium iodide to assay dead cells and Hoechst 33342 as a counter stain. 100% of colonoids were viable in both the forskolin or DMSO treated samples.
Investigation of fluid movement using compounds of the enteric nervous and immune systems
Eight compounds that are known to be associated with cAMP or Ca2+-regulated ion transport were assessed for the ability to induce fluid movement into the colonoids leading to colonoid swelling (Supporting Information, Table 1). All compounds except forskolin were dissolved in 1× PBS or distilled water and diluted 1000× in assay medium prior to addition to the colonoids. Forskolin was dissolved in DMSO and diluted 1000× in assay medium. Addition of assay medium or DMSO (0.1%) was used as a control. After culturing for 2 days in SM, colonoids were stained with Hoechst 33342 for 25 min. The medium in each well was then replaced with the appropriate experimental or control medium and the plate was transferred to the microscope for time-lapse fluorescence imaging every 3.6 min for 32 min. Compound screening was performed in triplicate by culturing arrayed colonoids in three 96-well plates utilizing 16 wells within each plate: one for each of the 8 compounds to be screened, one each for the forskolin and cholera toxin positive and negative controls, respectively, five for the assay medium controls, and one for the DMSO control. To control for plate-to-plate variance, each plate used a random well order for the compounds.
Statistical analysis
Unless otherwise specified, data is presented as the sample mean and standard deviation. Two-tailed t-tests were utilized for comparisons between 2 groups. Statistical analyses of multiple experimental groups and controls were performed using one-way ANOVA and Tukey’s test for multiple comparisons. For statistical analysis of multiple experimental groups between embedded and arrayed organoids, two-way unbalanced ANOVA with Type III sum of squares and Tukey’s test for multiple comparisons was used. All statistical tests were performed at a significance level of 0.05 and were computed using MATLAB or GraphPad Prism (GraphPad Software, Inc. La Jolla, CA). G*Power software (Heinrich Heine University, Germany) was used to for a priori sample size determination based off of a two-tailed t-test for differences in ΔAmax of two groups with α=1-β=0.05.
Box-and-whisker plots were used to show ΔAmax (%) of colonoids. The small box indicates the mean of the data, the bar shows the median, and the upper and lower boxes represent the 75th and 25th percentiles of the data, respectively. The whiskers extend to the 5th and 95th percentiles, and “x” denotes outliers. For all statistical comparisons p values were represented as follows: * for p<0.05, ** for p<0.01, *** for p<0.001, and **** for p<0.0001.
RESULTS AND DISCUSSION
Generation of a colonoid array and its characterization
To generate colonoid arrays, a protocol similar to that used to create acinar cultures from tumor cell lines was adapted for the primary intestinal epithelial organoids.13,31 Colonoid fragments possessing proliferative cells were plated on the surface of a layer of polymerized Matrigel. Cells in the colonoids adhered to the upper surface of the Matrigel and expanded in size while remaining attached to the surface (Figure 1A, B). Under these conditions, 24 ± 11% (n =19) of the colonoid diameter was embedded within the Matrigel with the remainder extending above the Matrigel surface into the overlying medium (Figure 1D). None of the colonoids (n=70) on the Matrigel surface overlapped in the Z dimension. In contrast, colonoids embedded in conventional 3D cultures were frequently found to overlap one another and reside in multiple focal planes throughout the gel (Supporting Information Figure 1). The polarity of the cell layer surrounding the colonoid lumen was investigated by fixing and cryosectioning the colonoids after 3 days of growth followed by staining F-actin with fluorescently-labeled phalloidin. F-actin was localized to the inner surface of the colonoid lumen suggesting that the actin-rich microvilli were also located on the luminal organoid surface and that the organoids were properly polarized (Figure 1C).32
Figure 1.

Generation and characterization of arrayed colonoids and comparison to embedded colonoids. A.) Work flow for generating the arrayed colonoids. B.) Brightfield image of an individual colonoid within the array. C.) F-actin (green) and Hoechst (blue) stained cryo-sectioned image of an arrayed colonoid. D.) Cryo-sectioned brightfield image of an arrayed colonoid. E & F.) EdU (green), MUC2 (red) and Hoechst (blue) stained images of an arrayed colonoid (E) and embedded colonoid (F) G.) Percent normalized area positive for EdU or MUC2 fluorescence in arrayed and embedded organoids. All scale bars represent 75 μm.
Intestinal organoids consist of proliferative and differentiated cell types similar to those found in vivo. To identify cell lineages present in the arrayed colonoids, arrayed and embedded colonoids were pulsed with EdU to identify S-phase cells and immunostained for mucin 2 (Muc-2) to identify the differentiated goblet cells. Colonoids were imaged using a fluorescence microscope. The area of the colonoid displaying EdU-based or Muc-2 immunofluorescence was quantified and normalized to the total area of the organoid, i.e. the organoid image area positive for Hoechst 33342 fluorescence. Colonoids were cultured on the arrays in a medium rich in growth factors (SM) displayed an EdU+/Hoechst area of 47.2 ± 24.5% (n=27) suggesting large numbers of S-phase or proliferative cells (Figure 1E,G). The MUC-2+/Hoechst area was 0.5 ± 1.1 (n=29) indicating that few of the differentiated goblet cells were present under these culture conditions (Figure 1E, G). For comparison, Matrigel-embedded colonoids cultured in the presence of the SM possessed an EdU+/Hoechst area of 34.6 ± 22.0% (n=25) that was not significantly different from that of the arrayed colonoids (p=0.852) (Figure 1F, G). Similarly, the MUC-2+/Hoechst area for the embedded colonoids (0.3 ± 0.9%, n=25) was not significantly different than that of the arrayed colonoids (p=0.486) (Figure 1F, G). Thus, the arrayed colonoids displayed similar numbers of proliferative and differentiated cells to that found in the embedded colonoids suggesting that the two organoid culture systems were similar. Additionally the large standard deviation in the area of EdU uptake and muc-2 immunostaining suggested that the colonoids might be quite heterogeneous in their properties in both culture systems.
Automated assay of colonoid arrays
Since the colonic organoids displayed heterogeneous behavior, significant sample sizes would likely be required to identify subpopulations and/or responses to some compounds. Thus, automated microscopy and image analysis were implemented so that hundreds of colonoids could be assayed per experiment. A motorized microscope acquired a grid of images spanning each well of a 96-well plate (Figure 2A). As the colonoids lay above the hydrogel surface and the structures did not overlap, autofocus routines could be applied to image rapidly the colonoid arrays (22 s/well). The images of each well were stitched together followed by application of an automated analysis pipeline (Figure 2A, B). The colonoids were segmented using Otsu’s method for thresholding to create a mask for subsequent fluorescence measurements.27 The masks were size-filtered to remove objects less than 60 μm in diameter and adjacent colonoids were separated using a watershed transform.28 Colonoid centroids, areas, and mean fluorescence intensities were then quantified for the masked regions and these features as well as the colonoid location tracked over time.
Figure 2.

Automated imaging and image analysis. A.) Work flow of automated image acquisition and analysis. i: Arrayed colonoids are imaged over time using a motorized widefield microscope. ii: A top-view image of each colonoids is obtained. iii: The images of the colonoids are stitched into a single image per well (black dash-dotted line represent well perimeter). iv: Colonoids are segmented using automated image analysis to produce a binary map of each colonoid. v: Assay metrics such as colonoid size over time are extracted. B.) Stitched, full-well image showing DsRed fluorescence of colonoids after 3 days of growth on the array. The scale bar represents 500 μm. C.) Box-and-whisker distributions of colonoid diameter over time. D.) Histogram of percent of colonoids versus their percent area rate of change (%/h). E.) A time series of DsRed fluorescence images of the single colonoid indicated by the yellow arrow in panel B. F.) Change in colonoid cross-sectional area over time, relative to time zero. Each trace represents a single colonoid (n=62 colonoids), with the population median colonoid swelling represented by the black trace.
To develop the automated platform, murine colonoids expressing DsRed were cultured on the arrays and imaged over 3 days. The wells contained a total of 214 colonoids (n=3 wells). The median colonoid diameter increased from 105.0 ± 12.8 μm to 139.0 ± 6.7 (p <0.02) over the 3-day culture time (Figure 2C, D, E). Between days 2 and 3, the majority of the colonoids (52.6% ± 6.5%) experienced a ≤25% increase in image plane-area (Figure 2D, Supplemental Video S1). The colonoids were nearly stationary over this time with an average linear velocity of 2.8 ± 0.3 μm per hour. A small percentage (9.4%) of the colonoid population displayed a >75% increase in image area during the 24 h time with the fastest growing colonoid expanding in area from 17,850 μm2 to 36,237 μm2 (equivalent diameter increase from 151 μm to 215 μm). Most of the colonoids (95%) displayed area growth rates <4.3%/h and absolute area growth rates <479 μm2/h.
The performance of automated image analysis of colonoid area and position was evaluated from image data acquired between day 2 and 3 of culture (Figure 2F). The automated image analysis routines segmented and tracked 72.6% ± 7.9% of the wells’ colonoids (154 colonoids across 3 wells). A goal of this work was to segment the entire colonoid without including adjacent colonoids during the 24-h analysis window. Only 5.2% ± 0.5% (11 colonoids in total) of the colonoids were segmented or tracked incorrectly by the automated software. This accuracy was attained at the expense of excluding 22.3% ± 7.7% (49 colonoids in total) of the colonoids based upon thresholds of allowable colonoid diameter, swelling rates, and centroid velocities. Both inaccurate measurements and colonoid exclusion occurred predominantly when the colonoids were clustered too densely for successful segmentation or possessed regions that fell below the fluorescence threshold for the mask. Notably, the array with the lowest colonoid density (4 colonoids/mm2) exhibited the least instances of clustered colonoids and the highest rate of accurate analysis (81.7%). Thus, increasing the density beyond 4-6 colonoids/mm2 may have diminishing returns on throughput when strict colonoid exclusion criteria are used in image analysis algorithms.
cAMP-regulated transport
Intracellular cAMP production initiates ion transport into the intestinal lumen, which is followed by the passive movement of water into the lumen. In the colonoids, ions and fluid move into the enclosed lumen causing the structure to swell. To assess the cAMP-regulated transport, arrayed colonoids were stained with Hoechst 33342, stimulated with forskolin (0 or 1 μM), which is commonly used to stimulate the production of cAMP by adenylyl cyclase in cells. The colonoids were imaged over time using the automated platform, and Hoechst fluorescence was used to identify and segment the colonoids. Addition of forskolin to cells resulted in a visible increase in the colonoid diameter in less than 1 h while the DMSO control had no impact on the structures (Figure 3A, B). Colonoid area was tracked over time to determine net rate of fluid movement across the monolayer of colonic epithelial cells (Figure 3C-E). The percent maximal area increase, ΔAmax, of forskolin-treated colonoids was 21.2% [5.3%, 41.9%] (median [25th, 75th percentile], n=66 colonoids) relative to their area prior to forskolin addition (Supplemental Video S2). In contrast colonoids receiving media or DMSO demonstrated a ΔAmax of 1.1% [0%, 2.5%] and 1.4% [0%, 4.1%] (median [25th, 75th percentile], nmedia=63 and nDMSO=71 colonoids), respectively, which were both statistically different than the response of the forskolin-treated organoids (p<0.0001 for all comparisons) (Supplemental Video S3). On average, colonoids achieved 75% of their maximal swelling within 23 min of forskolin addition and 100% of their maximal size within 46 min. The estimated maximal rate of fluid movement in forskolin-treated colonoids during the 1 h assay window was 4.23 ± 3.34 μL h−1 cm−2, which was significantly different than that estimated for control colonoids (media addition, 1.50 ± 2.02 μL h−1 cm−2; DMSO addition, 1.75 ± 1.93 μL h−1 cm−2, p<0.0001 for all comparisons). The average initial net fluid flux was between 9-30% that of the average maximal net fluid flux for colonoids in media, DMSO, and forskolin. Overall, the fluid transport rate of arrayed colonoids treated with forskolin was comparable to that of 3D embedded cultures under the same conditions, which was 2.16 ± 0.55 μL h−1 cm−2. These results suggested that cAMP-regulated ion transport followed by passive water movement occurs in the arrayed colonoids.
Figure 3.
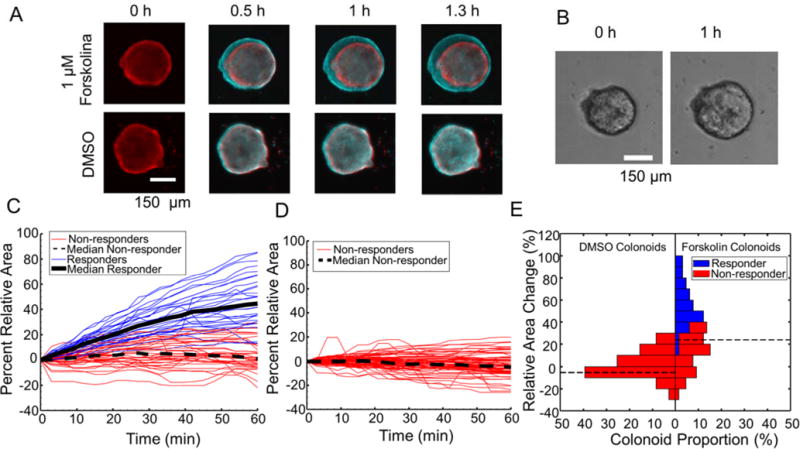
Colonoid swelling initiated by forskolin. A.) A time series of composite DsRed fluorescence images over 1.3 h (time 0: red; other time points: cyan) of a colonoid on an array after addition of forskolin or DMSO at time zero. B.) Brightfield images of a colonoid after addition of forskolin (1 μM) at zero. C & D.) Shown is ΔA of the colonoids over time. Forskolin (C, 1 μM) or DMSO (D, 0.1%) was added at time zero. k-means clustering with k = 2 was performed to classify the population into nonresponders (red) and responders (blue) E.) A comparison of ΔA versus the number of colonoids treated with forskolin or DMSO for the data in panels C and D.
The information-rich images of arrayed colonoids can be used for identification of heterogeneous behaviors after a perturbation such as application of a drug. For the forskolin-treatment experiment described above, each colonoid’s size, swelling magnitude, and swelling kinetics were quantified using a panel of 10 metrics (Supporting Information Methods). To identify treatment-dependent subpopulations of colonoids, the experimental dataset consisting of 66 forskolin-treated, 71 DMSO-treated, and 63 untreated colonoids was clustered into 2 groups using k-means clustering (Figure 3C, D). Forskolin-treated colonoids disproportionally fell into the “responder” cluster, which was composed exclusively of 30 forskolin-treated colonoids. The remaining 36 forskolin-treated and 134 non-forskolin treated organoids clustered into a “nonresponder” group. Forskolin-treated responders and non-responders possessed ΔAmax values of 47.7% [35.8%, 63.7%] and 7.6% [4.0%, 20.0%] (median [25th, 75th percentile]), respectively (Figure 3C, E). The DMSO-treated colonoid nonresponders exhibited ΔAmax values of 2.2% [0.5%, 6.0%] (Figure 3D, E). The maximum nonresponder ΔAmax was 20.5%, with 48% of forskolin-treated colonoids exceeding this swelling amount (8 nonresponders and 24 responders out of 66 total forskolin-treated colonoids) (Figure 3E). These data demonstrate the heterogeneity of colonoids swelling, even in response to the same stimulus, i.e. forskolin, a direct activator of adenylyl cyclase.
To further validate the swelling assay using arrayed colonoids, the repeatability of forskolin induced swelling using colonoids derived from four, wild-type mice (3 male, 1 female) was investigated (Supporting Information Figure 2). Arrayed colonoids grown from these mice were treated with forskolin while a control well received 0.1% DMSO-containing medium only. The median ΔAmax of forskolin-treated colonoids from the four mice were 28.8% [20.5%, 33.1%], 15.1% [8.5%, 24.2%], 7.5% [2.7%, 14.5%], and 20.2% [9.4%, 28.8%] while the matching percent ΔAmax for the DMSO control from these mice was 7.4% [4.3%, 10.3%], 5.6% [3.3%, 9.9%], 2.4% [0.9%, 4.9%], and 4.1% [0.1%, 6.9%] (median [25th percentile, 75th percentile]), respectively. The mean ΔAmax of all three samples was significantly different from their respective DMSO control (two-way ANOVA, p<10−7 for all comparisons) as well as between all four mice except between mice 1 and 4 (p<0.05 for all comparisons) (Supporting Information Figure 2). While a functional variation between animal tissue can be expected, colonoid swelling did increase across all forskolin-treated samples relative to the paired DMSO control.
The dose dependence of forskolin-induced swelling in arrayed colonoids was then investigated and compared to embedded cultures using colonoids from the same mouse. Both arrayed and embedded colonoids demonstrated a dose-dependent swelling for forskolin concentrations of 50 nM to 5 μM (Supporting Information Figure 3A). The dose responses were fit to sigmoidal logistic functions using nonlinear regression with least-squares estimation (Supporting Information Figure 3B). For arrayed colonoids, the EC50 and maximal relative area increase of forskolin-induced swelling were 175.7 nM (95% c.i.= [52.4, 299.0] nM) and 344% (95% c.i.= [279, 410] %), respectively. These metrics were not significantly different from the EC50 and maximum response of embedded colonoids from the same mouse, which were 232.4 nM (95% c.i.= [106.9, 357.9] nM) and 284% (95% c.i.= [248, 321] %), respectively. Thus, overall forskolin-induced swelling in arrayed colonoids was similar to that of hydrogel-embedded cultures.
The dose-dependence response to forskolin permits an estimate of the number of colonoids needed to obtain a statistically significant swelling response as the forskolin concentration is altered. The lowest forskolin concentration that induced a statistically different response relative to the control was 250 nM (p<0.001, two-way ANOVA), which induced a 2.1 and 2.6-fold increases in the median ΔAmax over the DMSO control for embedded and arrayed colonoids, respectively. Based off of these data, the estimated total sample size required to detect statistically significant differences between the ΔAmax of forskolin and DMSO-treated colonoids is 2868 for the expected 1.2X difference, 322 for a 1.5X difference, 80 for a 2.8X difference and 42 for a 2.9X difference. Thus even for a moderate level of swelling (1.5 fold size increase), hundreds of colonoids must be screened for statistical confidence. The use of arrayed organoid strategy enables the assay of sufficient colonoids for these biologically-relevant swelling conditions.
Investigation of fluid secretion by cholera toxin
Cholera is a well-known toxin that causes persistent diarrhea through cAMP production as well as activation of enteric nervous and immune systems. The toxin consists of two units, cholera toxin A and B. The combined toxin A & B (CT) is required to activate adenylyl cyclase and produce cAMP.1 The B subunit of cholera toxin (C-B) binds to intestinal epithelial cells but does not stimulate cAMP production.33 The impact of cholera toxin on colonoid arrays was investigated by adding CT, C-B, or media to the cultures and applying the automated platform to track the colonoids over time. CT at both 0.5 μg/mL and 5 μg/mL induced a significantly greater increase in the ΔAmax than the media control, 0.5 μg/mL C-B, or 5 μg/mL C-B (p<0.01 for all comparisons, Figure 4A). There was no statistical difference between wells treated with media alone and wells treated with 0.5 μg/mL C-B or 5 μg/mL C-B (Figure 4A). These data demonstrate the utility of our platform in the measurement of cellular responses to enterotoxins.
Figure 4.
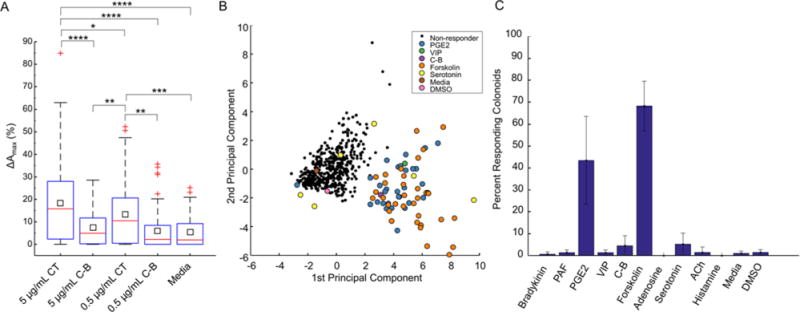
Colonoid swelling initiated by CT and compounds associated with the enteric nervous and immune systems. A.) Box-and-whisker plots of the maximal area attained by colonoids as a percentage of their area at time zero. The colonoids were incubated with CT or its B subunit at the indicated concentrations for 1.5 h. Colonoid responses to CT, C-B and assay medium was statistically compared. B.) 2-D reduction of a 10-dimensional colonoid dataset using principle component analysis. The data set consisted of 768 colonoids across 16 wells of a 96 well plate treated with 8 compounds and 4 controls. For clarity, the non-responding colonoids in negative control media are omitted. All non-responding colonoids are shown in black, whereas colonoids with forskolin-like swelling responses are shown color-coded by treatment compound. C.) Proportion of colonoids that exhibit swelling within a 32 min window in response to compound treatment. Error bars represent ±1 standard deviation using 3 replicate experiments. An SVM classifier was trained for each replicate experiment using that replicate’s forskolin-treated and control colonoids as the classification’s positive and negative training groups, respectively.
Screening of compounds associated with the enteric nervous and immune systems during infectious diarrhea
Cell-enterotoxin interactions can activate enteric nervous and immune systems to produce compounds that induce ion transport or inhibit ion absorption with subsequent water movement producing diarrhea and significance water loss through the colon.1 To investigate the potency of such compounds on fluid transport on intestinal cells, 8 compounds (bradykinin, prostaglandin E2, vasoactive intestinal peptide, adenosine, serotonin, acetylcholine, and histamine) generated by enteric nerves or inflammatory cells during infectious diarrhea were selected for screening on the primary arrayed colonoids (Supporting Information, Table 1).1 Colonoids at day 2 of culture were incubated with the compounds for 32 min while undergoing time lapse imaging. Forskolin was used as a positive control while culture media and C-B were included as negative controls. Automated image analysis enabled each colonoid’s size, swelling magnitude, and swelling kinetics to be quantified using a panel of 10 metrics (Supporting Information, Methods). We then proceeded to analyze this rich dataset for unique subpopulations. Support vector machine (SVM) classification was used to distinguish between responsive and non-responsive colonoids. For each well-plate replicate, the forskolin-treated positive controls and standard media negative controls were used to train a linear SVM binary classifier, which had an estimated accuracy of 91.3% – 94.5% when distinguishing between swelling responders and static non-responders. The effects of the screened compounds on individual colonoid area and resulting classification for a single well plate are shown in Supporting Information, Figure 4. For the PGE2-treated sample, a large number of colonoids were identified as responders (49.6% ± 17.9%, total of 70 out of 139) (Figure 4 B, C, Supplemental Video S4). This PGE2-responsive subpopulation possessed a greatly increased median ΔAmax (16.2%) compared to that of PGE2-nonresponders (median ΔAmax of 4.6%). PGE2 is known to be produced during infection with Vibrio cholerae34 leading to an increase in cAMP35. These results show that colonoids in the cultures were not functionally equal. Previously, the Magness group has shown the transcriptional heterogeneity of small intestinal organoids within the same culture.36 Small numbers of colonoids treated with compounds other than forskolin or PGE2 were classified as responders (1.9%, or 37 out of 1955 colonoids) (Figure 4 B, C). These responding colonoids could represent unique subpopulations within colonoids, but larger numbers of colonoids would need to be tracked to ascertain whether such subpopulations exist. Overall, these data support the utility of the arrayed colonoids when combined with automated imaging and computation as a screening platform to identify the intestinal response to exogenous compounds such as drugs and toxins.
CONCLUSIONS
This paper demonstrates the development of an arrayed colonoid culture system on the surface of a hydrogel support. The colonoids resided on a locally flat surface such that efficient automated imaging was possible using a computer-controlled microscope. Moreover, the cell types and polarity of the arrayed organoids were indistinguishable from hydrogel-embedded organoids. Using simple and accessible automated image analysis methods, we demonstrated the measurement of individual colonoid positions and sizes over time frames as long as 72 hours. Using this approach, the net fluid movement across the epithelial cell monolayer of the organoids was tracked and quantified using the colonoid cross-sectional area as a proxy. This image-based tracking of organoid swelling was used to screen a small set of physiologic molecules associated with the enteric nervous and immune system for their impact on water movement across the colonoid epithelium. Heterogeneity in organoid response to chemicals such as forskolin and PGE2, and toxins such as cholera was readily observed. For example, PGE2-treated colonoids displayed a responsive subpopulation that possessed 3.5× higher response compared to that of PGE2-nonresponders. To detect smaller swelling responses i.e. from 1 to 2 fold that of the control, hundreds to thousands of colonoids are required to identify statistically significant responses. This arrayed colonoid system readily permits large numbers of organoids to be assayed enabling small subpopulations to be identified. In this instance, 2248 colonoids were assayed in less than 4 h for the compound screen. We anticipate the utility of this arrayed colonoid culture for applications involving screens of drugs, bacterial products, and dietary metabolites on primary intestinal tissue. Further, we anticipate that this platform can be readily extended to culture human intestinal organoids for personalized medicine applications.
Supplementary Material
Acknowledgments
Research reported in this publication was supported by the National Institutes of Health under award number R01DK109559 to N.L.A. and S.T.M. and UNC translational team science award under CTSA grant UL1TR001111 (S.T.M.). The authors thank Ian Williamson for coordinating the procurement of mouse colons.
Footnotes
Electronic supplementary information (ESI) available.
SUPPORTING INFORMATION AVAILABLE
The supporting information files and videos are available free of charge via the Internet at http://pubs.acs.org.
The authors declare the following competing financial interest(s): N.L.A., Y.W., C.E.S., S.T.M., have a financial interest in Altis Biosystems LLC.
References
- 1.Field M. J ClinInvest. 2003;111:931–943. doi: 10.1172/JCI18326. [DOI] [PMC free article] [PubMed] [Google Scholar]
- 2.O’neal CJ, Jobling MG, Holmes RK, Hol WG. Science. 2005;309:1093–1096. doi: 10.1126/science.1113398. [DOI] [PubMed] [Google Scholar]
- 3.Hodges K, Gill R. Gut Microbes. 2010;1:4–21. doi: 10.4161/gmic.1.1.11036. [DOI] [PMC free article] [PubMed] [Google Scholar]
- 4.Greger R. Annu RevPhysiol. 2000;62:467–491. doi: 10.1146/annurev.physiol.62.1.467. [DOI] [PubMed] [Google Scholar]
- 5.Thiagarajah JR, Verkman A. Curr OpinPharmacol. 2013;13:888–894. doi: 10.1016/j.coph.2013.08.005. [DOI] [PMC free article] [PubMed] [Google Scholar]
- 6.Muanprasat C, Chatsudthipong V. Future MedChem. 2013;5:781–798. doi: 10.4155/fmc.13.42. [DOI] [PubMed] [Google Scholar]
- 7.Grabinger T, Luks L, Kostadinova F, Zimberlin C, Medema JP, Leist M, Brunner T. Cell Death Dis. 2014;5:e1228. doi: 10.1038/cddis.2014.183. [DOI] [PMC free article] [PubMed] [Google Scholar]
- 8.Shamir ER, Ewald AJ. Nat Rev MolCell Biol. 2014;15:647–664. doi: 10.1038/nrm3873. [DOI] [PMC free article] [PubMed] [Google Scholar]
- 9.Ranga A, Gjorevski N, Lutolf MP. Adv Drug Deliv Rev. 2014;69–70:19–28. doi: 10.1016/j.addr.2014.02.006. [DOI] [PubMed] [Google Scholar]
- 10.Sato T, Vries RG, Snippert HJ, van de Wetering M, Barker N, Stange DE, van Es JH, Abo A, Kujala P, Peters PJ. Nature. 2009;459:262–265. doi: 10.1038/nature07935. [DOI] [PubMed] [Google Scholar]
- 11.Dekkers JF, Wiegerinck CL, de Jonge HR, Bronsveld I, Janssens HM, de Winter-de Groot KM, Brandsma AM, de Jong NWM, Bijvelds MJC, Scholte BJ, Nieuwenhuis EES, van den Brink S, Clevers H, van der Ent CK, Middendorp S, Beekman JM. NatMed. 2013;19:939–945. doi: 10.1038/nm.3201. [DOI] [PubMed] [Google Scholar]
- 12.Yamada KM, Cukierman E. Cell. 2007;130:601–610. doi: 10.1016/j.cell.2007.08.006. [DOI] [PubMed] [Google Scholar]
- 13.Debnath J, Brugge JS. NatRev Cancer. 2005;5:675–688. doi: 10.1038/nrc1695. [DOI] [PubMed] [Google Scholar]
- 14.Zietek T, Rath E, Haller D, Daniel H. SciRep. 2015;5:16831. doi: 10.1038/srep16831. [DOI] [PMC free article] [PubMed] [Google Scholar]
- 15.Mizutani T, Nakamura T, Morikawa R, Fukuda M, Mochizuki W, Yamauchi Y, Nozaki K, Yui S, Nemoto Y, Nagaishi T. Biochem Biophys ResCommun. 2012;419:238–243. doi: 10.1016/j.bbrc.2012.01.155. [DOI] [PubMed] [Google Scholar]
- 16.Schwank G, Koo B-K, Sasselli V, Dekkers JF, Heo I, Demircan T, Sasaki N, Boymans S, Cuppen E, van der Ent CK, Nieuwenhuis EES, Beekman JM, Clevers H. Cell Stem Cell. 2013;13:653–658. doi: 10.1016/j.stem.2013.11.002. [DOI] [PubMed] [Google Scholar]
- 17.Jin B-J, Battula S, Zachos N, Kovbasnjuk O, Fawlke-Abel J, In J, Donowitz M, Verkman AS. Biomicrofluidics. 2014;8:24106. doi: 10.1063/1.4870400. [DOI] [PMC free article] [PubMed] [Google Scholar]
- 18.Moon C, Zhang W, Ren A, Arora K, Sinha C, Yarlagadda S, Woodrooffe K, Schuetz JD, Valasani KR, de Jonge HR, Shanmukhappa SK, Shata MTM, Buddington RK, Parthasarathi K, Naren AP. J BiolChem. 2015;290:11246–11257. doi: 10.1074/jbc.M114.605410. [DOI] [PMC free article] [PubMed] [Google Scholar]
- 19.Fujii S, Suzuki K, Kawamoto A, Ishibashi F, Nakata T, Murano T, Ito G, Shimizu H, Mizutani T, Oshima S, Tsuchiya K, Nakamura T, Araki A, Ohtsuka K, Okamoto R, Watanabe M. SciRep. 2016;6:1–15. doi: 10.1038/srep36795. [DOI] [PMC free article] [PubMed] [Google Scholar]
- 20.Foulke-Abel J, In J, Kovbasnjuk O, Zachos NC, Ettayebi K, Blutt SE, Hyser JM, Zeng X-L, Crawford SE, Broughman JR, Estes MK, Donowitz M. Exp BiolMed. 2014;239:1124–1134. doi: 10.1177/1535370214529398. [DOI] [PMC free article] [PubMed] [Google Scholar]
- 21.Spence JR. Cell Mol GastroenterolHepatol. 2017;4:203–204. doi: 10.1016/j.jcmgh.2017.04.006. [DOI] [PMC free article] [PubMed] [Google Scholar]
- 22.Wang Y, DiSalvo M, Gunasekara DB, Dutton J, Proctor A, Lebhar MS, Williamson IA, Speer J, Howard RL, Smiddy NM, et al. Cell Mol GastroenterolHepatol. 2017;4:165–182. doi: 10.1016/j.jcmgh.2017.02.011. [DOI] [PMC free article] [PubMed] [Google Scholar]
- 23.Gracz AD, Ramalingam S, Magness ST. AJP GastrointestLiver Physiol. 2010;298:G590–G600. doi: 10.1152/ajpgi.00470.2009. [DOI] [PMC free article] [PubMed] [Google Scholar]
- 24.Ahmad AA, Wang Y, Gracz AD, Sims CE, Magness ST, Allbritton NL. J BiolEng. 2014;8:1–10. doi: 10.1186/1754-1611-8-9. [DOI] [PMC free article] [PubMed] [Google Scholar]
- 25.Miyoshi H, Stappenbeck TS. NatProtoc. 2013;8:2471–2482. doi: 10.1038/nprot.2013.153. [DOI] [PMC free article] [PubMed] [Google Scholar]
- 26.Ramalingam S, Daughtridge GW, Johnston MJ, Gracz AD, Magness ST. Am J Physiol - GastrointestLiver Physiol. 2011;302:G10–G20. doi: 10.1152/ajpgi.00277.2011. [DOI] [PMC free article] [PubMed] [Google Scholar]
- 27.Otsu N. Automatica. 1975;11:23–27. [Google Scholar]
- 28.Roerdink JB, Meijster A. Fundam Informaticae. 2000;41:187–228. [Google Scholar]
- 29.Schölkopf B, Smola AJ. Learning with kernels: support vector machines, regularization, optimization, and beyond. MIT press; 2002. [Google Scholar]
- 30.Rao MC, Sarathy J, Sellin JH. Sleisenger and Fordtran’s Gastrointestinal and Liver Disease. 2016:1713–1735. [Google Scholar]
- 31.Debnath J, Muthuswamy SK, Brugge JS. Methods. 2003;30:256–268. doi: 10.1016/s1046-2023(03)00032-x. [DOI] [PubMed] [Google Scholar]
- 32.Ubelmann F, Chamaillard M, El-Marjou F, Simon A, Netter J, Vignjevic D, Nichols BL, Quezada-Calvillo R, Grandjean T, Louvard D, Revenu C, Robine S. Proc Natl AcadSci. 2013;110:E1380–E1389. doi: 10.1073/pnas.1218446110. [DOI] [PMC free article] [PubMed] [Google Scholar]
- 33.Sánchez J, Holmgren J. Indian J MedRes. 2011;133:153–163. [PMC free article] [PubMed] [Google Scholar]
- 34.Hecht G. Am J Physiol-Cell Physiol. 1999;277:C351–C358. doi: 10.1152/ajpcell.1999.277.3.C351. [DOI] [PubMed] [Google Scholar]
- 35.Dey I, Lejeune M, Chadee K. Br JPharmacol. 2006;149:611–623. doi: 10.1038/sj.bjp.0706923. [DOI] [PMC free article] [PubMed] [Google Scholar]
- 36.Gracz AD, Williamson IA, Roche KC, Johnston MJ, Wang F, Wang Y, Attayek PJ, Balowski J, Liu XF, Laurenza RJ, Gaynor LT, Sims CE, Galanko JA, Li L, Allbritton NL, Magness ST. NatCell Biol. 2015;17:340–349. doi: 10.1038/ncb3104. [DOI] [PMC free article] [PubMed] [Google Scholar]
Associated Data
This section collects any data citations, data availability statements, or supplementary materials included in this article.