Abstract
Objective
We used epidemiologic data of clinical periodontal status from two population-based samples in two countries, USA and Germany, to examine (i) the impact of age on the relative contribution of recession and pocketing on the distribution of clinical attachment loss, and (ii) whether it is feasible to define age-dependent thresholds for severe periodontitis.
Methods
The analytical sample was based on persons age 30 and older and included 10,713 individuals in the US, participants in NHANES 2009-2014, and 3,071 individuals in Pomerania, Germany, participants in the SHIP-Trend 2008-2012. NHANES used a full-mouth examination protocol to collect data on recession (R), pocket depth (PD) and clinical attachment loss (CAL) for 6 sites/tooth on a maximum of 28 teeth; SHIP-Trend used a half-mouth examination at 4 sites/tooth. In both samples, percentile distributions of mean CAL/person were generated for each 5-year age interval. Age-dependent thresholds defining the upper quintile of mean CAL were calculated for both samples. The topographic intraoral distribution of CAL and the relative contribution of R and PD on CAL was assessed.
Results
Mean CAL increased linearly with age in both samples and was higher in SHIP-Trend than NHANES across the age spectrum. In contrast, mean PD was constant across age groups in both populations. R contributed increasingly to CAL with age, especially after 45-49 years. Upper quintile mean CAL thresholds in NHANES were under 3 mm for ages up to 39 years, and under 3.58 mm in all other age groups. Corresponding values in SHIP-Trend were also under 3 mm in ages up to 39 years, but increased linearly with age up to 7.21 mm for ages ≥ 75 years.
Conclusions
Despite substantial differences in the overall severity of attachment loss between the two samples, common patterns of CAL and of the relative contribution of R and PD to CAL with increasing age were identified. Although periodontitis severity may vary in different populations, empirical evidence-driven definitions of CAL thresholds signifying disproportionate severity of periodontitis by age are feasible.
Keywords: Periodontitis, epidemiology, clinical attachment loss, recession, severity, age
INTRODUCTION
It is estimated that severe periodontitis affects 11% of the world population with prevalence increasing by age (Kassebaum et al., 2014, Frencken et al., 2017). There has been considerable discussion over the years regarding the role of age as a risk factor or risk indicator for periodontitis. A risk factor is an attribute or exposure that increases the likelihood of developing a disease or injury in an individual. Conceptually, risk factors are part of the causal chain with exposure to the risk factor occurring before the outcome, and can be modifiable (e.g., lifestyle factors) or non-modifiable (e.g., genetic factors). In contrast, risk indicators are characteristics that are associated with a disease or condition without being etiologically related, and for which temporality or direction of the observed relationship remains unclear (Burt, 2001). The influence of age on periodontitis is complex. While the likelihood of developing periodontitis increases with age in populations across the globe, suggesting that age is an important risk indicator (Eke et al., 2016), aging per se is not necessarily a risk factor (Papapanou et al. 1991, Van Dyke and Sheilesh, 2005), but likely a health determinant, or the underlying characteristic of a group that shapes the health of individuals and populations. As such, aging can account for a substantial part of the variance of periodontitis in the population and can influence incidence rates.
Although severe periodontitis can occur throughout the life span, it is estimated that the global incidence of severe periodontitis peaks around the age of 38 years (Kassebaum et al., 2014). Because age may increase susceptibility to the onset of periodontal disease and its progression, there have been many attempts to incorporate age—as a risk factor/indicator or determinant—into risk assessment tools for the prevention of periodontal disease progression (Lang et al., 2015). A high-utility risk assessment tool can improve screening for disease and may improve diagnostic decision-making for clinicians. However, understanding the distinction between the cause of disease in individuals and the cause of patterns of incidence in a population is important because effective disease mitigation may require distinct prevention strategies (Rose, 1985). More importantly, recognizing the role of a characteristic as a risk factor or health determinant informs the diagnostic process.
A disease is diagnosed in a patient based on a constellation of signs, symptoms, clinical and/or laboratory tests. Such criteria used by clinicians in the diagnosis and treatment planning are commonly known as diagnostic criteria. However, diagnostic criteria and classification criteria are not synonymous. Classification criteria are developed with the goal of utilizing standardized case definitions, facilitating comparability between studies and consequently generating uniformity in interpretation of study results. Classification criteria are not designed to characterize every single patient with a unique set of disease manifestations but rather to set a foundation to aggregate a majority of patients with specific phenotypes into a category. The main attribute of a classification scheme is to have high specificity, that is, to ensure that healthy people are not misclassified as having disease. However, if both the sensitivity and the specificity of a classification system approach 100%, then these classification criteria may also serve as diagnostic criteria. Nevertheless, given that classification criteria are not designed to have an accuracy of 100%, it is inevitable that a certain proportion of patients will be misclassified, hence why classification criteria are not meant to be used to diagnose disease in a particular patient or to guide treatment planning. To avoid introducing error in study design that can compromise validity, classification criteria for diseases must be developed utilizing empirical evidence-driven methodologies and should not be based on expert opinion alone.
The evolution of classification criteria for periodontal diseases over the years has been shaped by a rich discussion in the scientific community. Our understanding of the pathobiology of periodontitis has changed over these years and the expansion of new knowledge is generating the need to revisit the existing classification criteria. In view of the upcoming World Workshop for a revised classification of periodontal and peri-implant diseases and conditions organized by the American Academy Periodontology (AAP) and the European Federation Periodontology (EFP), and given the ubiquity and state of equipoise over elements of the classification system, the purpose of this study was to critically ascertain the association between age and periodontitis in an empirical evidence-driven manner. Specifically, our objectives were to address the following questions: (i) how does age affect the distribution of periodontitis in the general population, and (ii) is it feasible to define age-dependent thresholds for severe periodontitis. Epidemiologic data from two population-based samples in two countries, USA and Germany were used to address these questions.
METHODS
Study Populations
We used data from the National Health and Nutrition Examination Survey (NHANES), for years 2009-2014 and from the Study of Health in Pomerania (SHIP-Trend) for years 2008-2012.
NHANES is a population-based cross-sectional survey conducted in the United States by the National Center for Health Statistics (NCHS), which is part of the Centers for Disease Control and Prevention (CDC). The survey uses a stratified, multistage, cluster sampling design with the non-institutionalized civilian resident population of the United States as the target population. Approximately 5,000 sampled participants of all ages are interviewed in their homes and undergo a health examination in Mobile Examination Centers (MEC). Dental examinations, including full-mouth periodontal examinations involving participants age 30 and older, were conducted by trained dental examiners on the MEC. Details on NHANES methodology, the oral health component, and related data quality assurance may be found elsewhere (Dye et al., 2014, Dye & Iafolla, 2017). The NHANES 2009-2014 interviewed 30,468 people, of which, 9,667 were edentulous, and 9,393 did not have a periodontal examination and were therefore excluded, resulting in a total of 10,713 participants for analysis in this study (see Fig. L, supplementary Appendix in online journal).
SHIP-Trend is a large population-based longitudinal survey conducted in Germany. SHIP uses a stratified, random sampling design with a target population for community dwelling persons between ages 20 and 79 years in Pomerania, a region in northeast Germany. The survey uses interviews, questionnaires, and a physical examination to collect a broad range of health data, including oral health data. Details on SHIP-Trend methodology may be found elsewhere (Volzke et al., 2011). SHIP-Trend examined a total of 4,420 people during 2008-2012. After excluding the edentulous and those without a periodontal examination, a total of 3,071 participants remained for inclusion in the analysis of this study (Fig. Y, Appendix).
Periodontal examination
Between 2009-2014, NHANES conducted a full-mouth periodontal examination (FMPE) among those ≥30 years who did not have a health condition that required antibiotic prophylaxis prior to periodontal probing. The FMPE was undertaken with the intent to produce gold standard assessments for clinical attachment loss (CAL). Direct measurements of the distance between the cemento-enamel junction and the free gingival margin (CEJ-FGM) and the pocket depth (PD) at 6 sites (mesio-buccal, mid-buccal disto-buccal, mesio-lingual, mid-lingual and disto-lingual) for each tooth (excluding third molars) were made. All measurements were rounded to the lower whole millimeter. Clinical attachment loss was calculated based on these two measurements.
SHIP-Trend involved a partial-mouth periodontal examination (PMPE) randomly selecting the right or left side and carried out probing assessments at only 4 sites per tooth (the disto-lingual and mesio-lingual sites were not assessed) (Schutzhold et al., 2015). The assessment of PD employed direct measurements. However, for the assessment of CAL, either direct or indirect measurements were used, depending on the position of the CEJ relative to the FGM. If the FGM was located coronal to the CEJ, CAL was calculated as the difference between PD and the distance between FGM and CEJ. If the FGM was located apical to the CEJ indicating clinical recession, CAL was directly measured as the distance between CEJ and the base of the pocket.
In both studies, where the determination of the CEJ was indistinct (wedge-shaped defects, fillings, and crown margins), CAL was not recorded.
Study variables
Age in years was categorized into 10 groups: 30-34, 35-39, 40-44, 45-49, 50-54, 55-59, 60-64, 65-69, 70-74 and ≥75 years. When participants were initially selected, the age target was 20-79 years, because some individuals participated later, the age range at time of examination extended to 83 years. Age eligibility for a periodontal examination began at age 30 for NHANES and there was no maximum age, but individuals aged 80 and older were top-coded at 80 years of age for public data use. In all subsequent Figures and Tables, “clinical recession” refers to the clinical presentation where the FGM was located either at (clinical recession of 0) or apical to the CEJ (clinical recession >0). All figures presented as stacked histograms convey two conditions: CAL (the entire length of the bar) and clinical recession (the portion of CAL attributed to clinical recession; blue portion).
Statistical Analysis
Exploratory data analysis was performed to ascertain the relationship between age and the three clinical measures of periodontitis, namely recession (R), pocket depth and clinical attachment loss. Analyses were conducted using survey weights and design variables to account for the sampling design to produce representative estimates for both United States and Pomerania, Germany. Analytical datasets included those dentate, with tooth count ≥2, and 1age >29 years. Mean R, PD and CAL across 28 teeth, for each individual and the total sample were computed. Percentiles with a step of 5 for mean R, PD and CAL were computed to arrive at cumulative distributions for the total sample and each age category, with the contribution of R to CAL plotted in stacked histograms. Mean number of sites (each individual could have maximum of 6×28=168 sites affected) with CAL ≥ 4mm, PD ≥ 5mm and R ≥ 3mm were computed for each age category. In addition, data of the top 20% (upper quintile) of mean CAL were analyzed separately for the total sample and each age category. Stacked histograms of these upper quintiles were generated to indicate the distribution of the contribution of R to CAL by site. Finally, the linear relationship between mean R, mean PD, mean CAL and age were explored and linear regression lines were fitted. All analyses were undertaken using Stata/SE 14.0 (StataCorp. 2015. Stata Statistical Software: Release 14. College Station, TX: StataCorp LP) and SAS (SAS Institute Inc, Cary, North Carolina version 9.4).
RESULTS
Findings from NHANES 2009-2014
The mean age of the study population was 50.9 years (SE: 0.25), with the majority falling within the age range of 30-59 years (Table 1). Within this age range, the population was fairly equally distributed among each of the six 5-year age categories (~12%). Age categories within the age range of 60 years and over constituted ~27% of the total sample. The majority of the population was non-Hispanic Whites (68.4%), had some education beyond high school (63.8%).
Table 1.
Demographic Characteristics of Total Population – Age 30+ years
| Characteristics | NHANES 2009–2014 (n=10,713) |
SHIP-Trend 2008–2012 (n=3,071) |
|---|---|---|
| Age (years) | ||
| Average age in years (SE) | 50.86 (0.25) | 51.94 (0.23) |
| n (%) | n (%) | |
| Age 30–34 | 1,298 (12.26) | 297 (10.28) |
| Age 35–39 | 1,253 (12.22) | 320 (8.89) |
| Age 40–44 | 1,304 (12.85) | 383 (12.49) |
| Age 45–49 | 1,198 (12.55) | 409 (16.03) |
| Age 50–54 | 1,196 (12.27) | 369 (13.59) |
| Age 55–59 | 989 (11.12) | 371 (11.70) |
| Age 60–64 | 1,157 (9.15) | 314 (7.30) |
| Age 65–69 | 795 (6.55) | 282 (7.72) |
| Age 70–74 | 604 (4.53) | 188 (6.97) |
| Age ≥75* | 919 (6.48) | 138 (5.03) |
| Race/Ethnicity* | ||
| Non-Hispanic White | 4,594 (68.43) | 3,071 (100.00) |
| Non-Hispanic Black | 2,229 (10.68) | - |
| Hispanic | 2,588 (13.51) | - |
| Other | 1,302 (7.38) | - |
| Education* | ||
| Less than High School | 2,511 (15.36) | 560 (19.16) |
| High School Grad/GED or Equivalent | 2,307 (20.81) | 1,683 (54.76) |
| More than High School | 5,882 (63.75) | 821 (26.09) |
| Smoking | ||
| Current Smoker | 2,015(17.42) | 1,158 (37.23) |
| Former Smoker | 2,680(26.17) | 1,151 (37.56) |
| Never Smoked | 6,013(56.41) | 755 (25.21) |
NHANES - National Health and Nutrition Examination Survey; SHIP - Study of Health in Pomerania | GED – General Equivalency Diploma
In SHIP-Trend last age category is 75-83 years; Race is categorized as European Caucasian; Education is categorized as <10 years of schooling, 10 years of schooling and >10 years of schooling | All percentages are weighted.
Fig. 1A shows the mean CAL, PD, and clinical recession for each age group. Mean CAL ranged from 1.3 mm in the youngest age group (age 30-34 years) to 2.3 mm in the oldest age group (age 75 years and older). Average mean clinical recession steadily increased with age and was lowest in the age group of 30-34 years (Average: 0.1, SE: 0.2) and highest in the age group of ≥75 years (Average: 1.0, SE: 0.9). Unlike mean CAL and mean recession, the mean PD was fairly constant across age groups; thus, the 30-34 year age group had a mean pocket depth of 1.5mm (SE: 0.5) and the ≥75 year age group had a mean PD of 1.50 mm (SE: 0.5). Thus, it appears that the observed increase in mean CAL with age was primarily driven by increased recession.
Figure 1A.
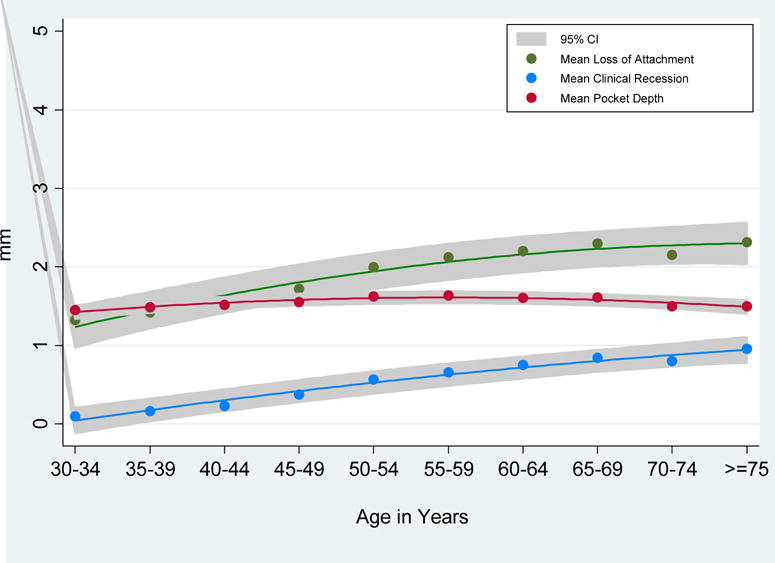
Trend in mean loss of attachment, clinical recession and pocket depth by age group, National Health and Nutrition Examination Survey (NHANES), 2009-2014. Lines show quadratic fits to averages (points).
The pattern of mean recession, pocket depth and clinical attachment loss per participant is investigated in greater detail in Fig. 2A, which presents boxplots of their distribution across age groups. The box boundaries identify the 25th and 75th percentiles, the horizontal line within the box represent median value, the whiskers define the interval between the 25th percentile minus 1.5 times the interquartile distance and the 75th percentile plus 1.5 times the interquartile distance, and the dots depict the outliers. When evaluating clinical recession by age group, the median value of subject-based mean recession gradually increased with age as did the interquartile range. Unlike recession, the interquartile range and median value for subject-based mean PD remained relatively stable across all age groups, as illustrated by the minimal difference in the size of the boxes across the age groups. For CAL, the increase in the median value of subject-based average attachment loss was minimal across the age groups, but the interquartile range increased with age, especially in ages between 45-64 years where this increase appeared to be more dependent on the third and fourth quartiles.
Figure 2A.

Boxplots of mean clinical recession, mean pocket depth and mean loss of attachment by age groups, National Health and Nutrition Examination Survey (NHANES), 2009-2014.
When the cumulative distribution of the entire sample with respect to mean CAL was analyzed (Fig. 3A), it was observed that 95% of the sample had a mean CAL of ≤4.2 mm and a mean clinical recession of ≤2 mm. In contrast, persons in the top 5% of the population had a mean CAL of 11.4 mm and a mean clinical recession of 7.8 mm. In 75% of the sample, the mean CAL did not exceed 2.2 mm. When stratified by age (Figs. 3B-3K), 95% of the 30-34 year olds had a mean CAL of ≤ 2.5 mm and a mean clinical recession of ≤ 0.3 mm while the top 5% reached a mean CAL of 6.0 mm and a mean clinical recession of 2.5 mm. In contrast, 95% of the oldest participants (Fig. 3K) had a mean CAL ≤ 4.5 mm and a mean clinical recession of <2.7 mm, whereas the top 5% had a mean CAL of 11.1 mm and a mean clinical recession of 6.7 mm. When comparing across the lifespan by age group, the contribution of recession to CAL appeared to increase substantially between 35 and 54 years with the mean recession increasing from 3.9 mm (age 35-39 years, Fig. 3C) to 7.8 mm (age 50-54 years, Fig. 3F) for the top 5% of the sample.
Figure 3A.
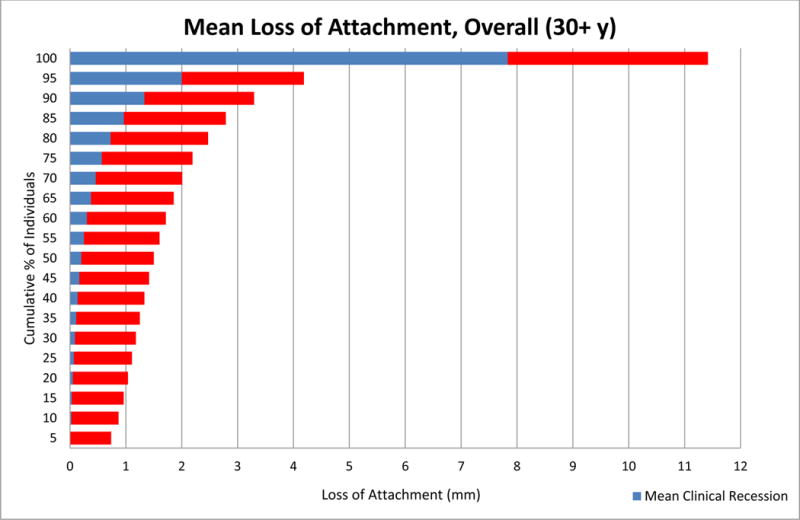
Mean Loss of Attachment in Total Population, Full-Mouth Exam, National Health and Nutrition Examination Survey (NHANES) 2009-2014.
Figure 3B.
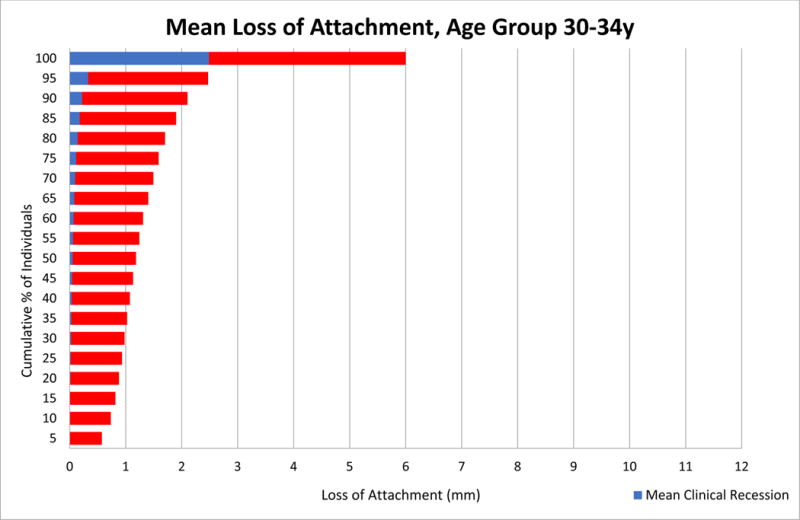
Mean Loss of Attachment in Age Group 30-34y, Full-Mouth Exam, National Health and Nutrition Examination Survey (NHANES) 2009-2014.
Figure 3K.
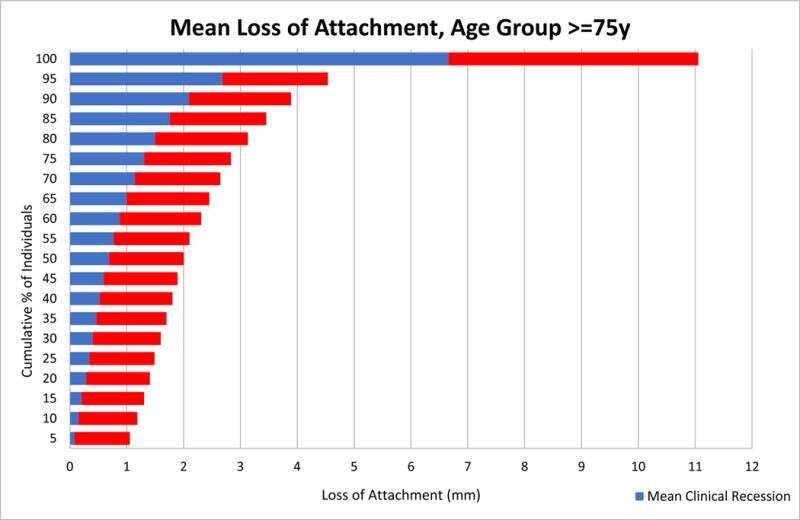
Mean Loss of Attachment in Age Group ≥75y, Full-Mouth Exam, National Health and Nutrition Examination Survey (NHANES) 2009-2014.
Figure 3C.
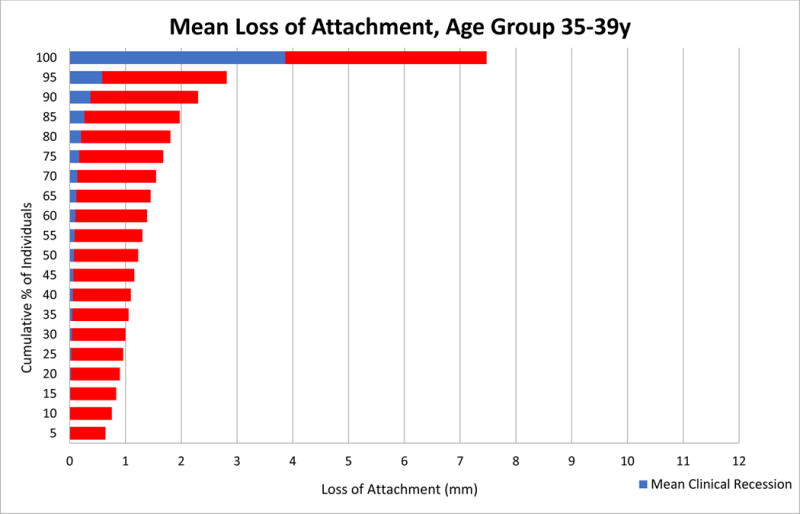
Mean Loss of Attachment in Age Group 35-39y, Full-Mouth Exam, National Health and Nutrition Examination Survey (NHANES) 2009-2014.
Figure 3F.
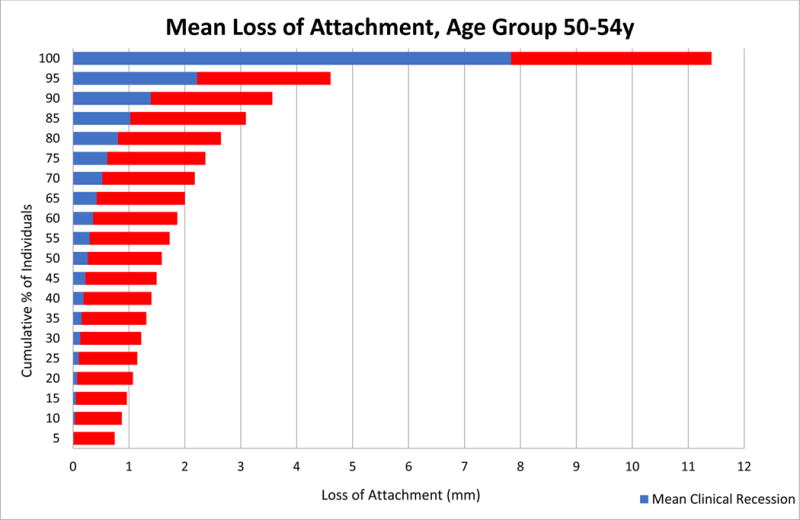
Mean Loss of Attachment in Age Group 50-54y, Full-Mouth Exam, National Health and Nutrition Examination Survey (NHANES) 2009-2014.
Table 2A shows the mean CAL, average number of sites with CAL ≥4 mm, average number of sites with PD ≥5 mm, average number of sites with clinical recession ≥3 mm, and mean number of missing teeth for all participants in the sample, as well as those in the upper quintile of mean CAL by age group. For example, in the 30-34 year old age group the upper quintile of CAL had a mean CAL of 2.6 mm and an average of 25 sites per person with CAL ≥ 4 mm, whereas in the overall sample the mean CAL was 1.3 mm and the number of sites affected by CAL ≥ 4 mm was 4. In ages 55-59 years, individuals in the upper quintile had a mean CAL of 3.5 mm and an average of 38 sites with CAL ≥ 4 mm, versus a mean CAL of 2.1 mm and 16 sites with CAL ≥ 4 mm among similarly aged individuals in the total sample. Persons in the youngest age group averaged about 1 missing tooth and this number increased to 9 for persons in the oldest age group. In contrast, those age 30-34 years in the upper quintile group averaged about 2 missing teeth whereas those age 75 years and older were missing an average of 12 teeth.
Table 2A.
Comparison of participants in the upper quintile of mean clinical attachment levels (CAL) with the entire sample, by age. National Health and Nutrition Examination Survey (NHANES) 2009-2014
| Age | Total Population* | Upper Quintile Group (top 20%)* | ||||||||||
|---|---|---|---|---|---|---|---|---|---|---|---|---|
|
| ||||||||||||
| N | Mean CAL | Mean No. of Sites with CAL ≥ 4mm |
Mean No. of Sites with PD ≥ 5mm |
Mean No. of Sites with Recession ≥ 3mm |
Mean No. of teeth missing ** | n | Mean CAL | Mean No. of Sites with CAL ≥ 4mm |
Mean No. of Sites with PD ≥ 5mm |
Mean No. of Sites with Recession ≥ 3mm |
Mean No. of teeth missing ** | |
| 30–34 | 1,298 | 1.32 | 4 | 1 | 1 | 1 | 139 | 2.58 | 25 | 6 | 3 | 2 |
| 35–39 | 1,253 | 1.42 | 6 | 1 | 2 | 2 | 154 | 2.98 | 34 | 8 | 7 | 3 |
| 40–44 | 1,303 | 1.54 | 8 | 2 | 2 | 2 | 215 | 3.04 | 37 | 9 | 9 | 4 |
| 45–49 | 1,195 | 1.72 | 10 | 2 | 4 | 3 | 281 | 3.16 | 36 | 7 | 12 | 6 |
| 50–54 | 1,195 | 2.00 | 14 | 2 | 6 | 5 | 389 | 3.43 | 36 | 6 | 16 | 8 |
| 55–59 | 986 | 2.13 | 16 | 2 | 8 | 5 | 355 | 3.46 | 38 | 6 | 17 | 9 |
| 60–64 | 1,150 | 2.20 | 17 | 2 | 8 | 7 | 459 | 3.47 | 37 | 4 | 18 | 10 |
| 65–69 | 790 | 2.30 | 16 | 1 | 9 | 8 | 325 | 3.58 | 34 | 3 | 18 | 12 |
| 70–74 | 598 | 2.15 | 13 | 1 | 8 | 8 | 217 | 3.40 | 28 | 2 | 17 | 12 |
| >=75 | 902 | 2.32 | 17 | 1 | 10 | 9 | 417 | 3.25 | 30 | 1 | 17 | 12 |
Based on Full-Mouth Examination
Based on a 28 -tooth dentition.
When we further analyzed the distribution of average CAL in the upper quintile by tooth type and site location (disto-facial, mid-facial, mesio-facial, disto-lingual, mid-lingual and mesio-lingual), it was observed that across all 6 sites, the average CAL was generally lower for maxillary anterior teeth compared to the remaining dentition (Fig. A, Appendix). Average CAL was notably higher in the mid-lingual and mesio-lingual sites of lower anterior teeth. Clinical recession showed a variable pattern, but was more pronounced across most of the mid-facial sites and mid-lingual (predominantly among anterior teeth) sites.
When similar analyses were undertaken for individuals in the upper quintile in each age group separately (Figs. B-K, Appendix), it was observed that, in the youngest age group, predominantly mid-facial and mid-lingual sites were affected by recession. However, as age increased, interproximal sites were increasingly affected by recession, although the portion of CAL attributed to PD was relatively stable across age groups.
Findings from SHIP-Trend 2008-2012
SHIP-Trend participants were on average 51.9 years old (SE: 0.23), with the majority falling within the age range of 40-59 years (Table 1). Within this age range, proportions peaked at 45-49 years (16%). Subjects aged 60 years and over constituted ~27% of the total sample. Ethnicity of the study population was European Caucasian. The majority had 10 years of schooling (54.8%).
Figure 1B shows mean CAL, mean PD, and mean clinical recession across age groups. For mean CAL, averages ranged from 1.2 mm in the youngest age group (age 30-34 years) to 4.6 mm in the oldest age group (age 75-83 years). Mean recession steadily increased with age and was lowest in the age group of 30-34 years (mean: 0.05, SE: 0.1) and highest in the age group of 75-83 years (mean: 1.9, SE: 1.3). In contrast, mean PD was fairly constant across age groups, with the 30-34 year age group having a mean PD of 2.3 mm (SE: 0.4) and the 75-83 year age group having a mean PD of 2.8 mm (SE: 1.0). Consistent with NHANES findings, the observed increase in mean CAL with age was primarily driven by increased recession.
Figure 1B.
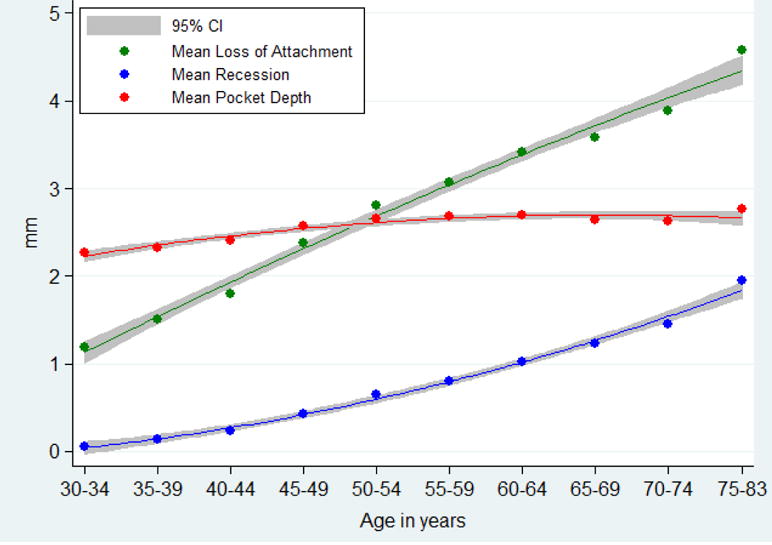
Trend in mean loss of attachment, clinical recession and pocket depth by age group, Study of Health in Pomerania (SHIP)-Trend 2008-2012. Lines show quadratic fits to averages (points).
Distributions of mean recession, mean PD, and mean CAL per participant were more closely investigated in boxplots of their distribution across age groups (Figure 2B). The median of subject-based mean recession steadily increased with age as did the interquartile range (i.e., the box height). Unlike recession, the median value for subject-based mean PD increased up to age 45-49 years and then remained relatively stable across the older age strata. Also, interquartile ranges doubled between the youngest and the 45-49 year age group and remained constant thereafter. For CAL, the median value of subject-based mean CAL increased substantially across the age groups as did the interquartile range.
Figure 2B.

Boxplots of mean clinical recession, mean pocket depth and mean loss of attachment by age groups, Study of Health in Pomerania (SHIP)-Trend 2008-2012.
When subjects were grouped according to 5%-percentiles of the entire sample with respect to mean CAL (Figure 3L), it was observed that 95% of the sample had a mean CAL of <5.5 mm and a mean clinical recession of <2.1 mm. In contrast, for persons in the top 5% of the sample, a mean CAL of 7.2 mm and a mean recession of 3.3 mm was observed. In 75% of the sample, the mean CAL did not exceed 3.4 mm. When stratified by age (Figs. 3M-3V), 95% of the 30-34 year olds had a mean CAL of <2.3 mm and a mean recession of <0.1 mm. In the top 5% group, mean CAL was 2.9 mm and mean recession was 0.2 mm. In contrast, 95% of the oldest participants (Fig. 3V) had a mean CAL <7.2 mm and mean recession of <3.6 mm. In contrast, the top 5% mean CAL was 9.5 mm and the mean recession was 4.3 mm. Thus, the contribution of recession to CAL appeared to increase dramatically over the whole age range with the mean recession increasing from 0.2 mm to 4.3 mm, respectively, for the top 5% of each age-stratified sample.
Figure 3L.
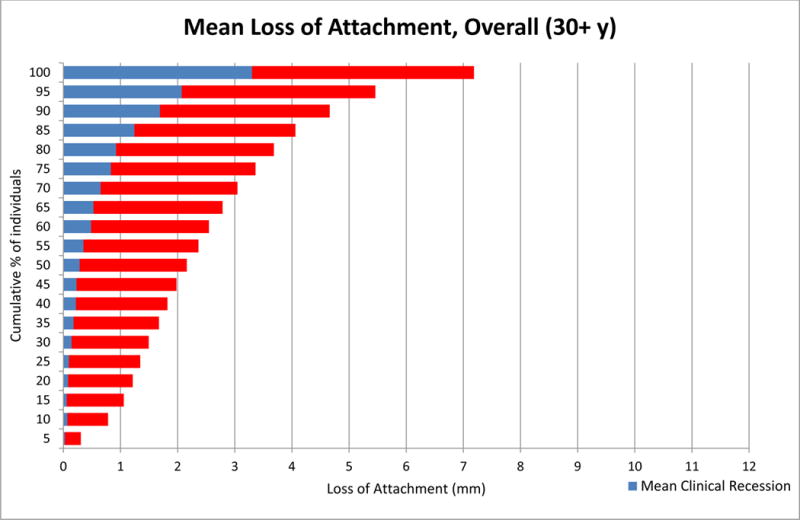
Mean Loss of Attachment in Total Population, Half-Mouth Exam, Study of Health in Pomerania (SHIP)-Trend 2008-2012.
Figure 3M.
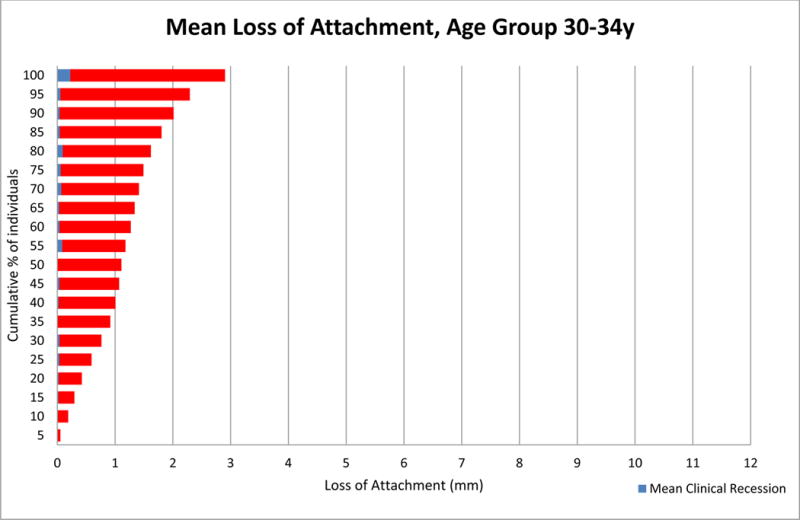
Mean Loss of Attachment in Age Group 30-34y, Half-Mouth Exam, Study of Health in Pomerania (SHIP)-Trend 2008-2012.
Figure 3V.
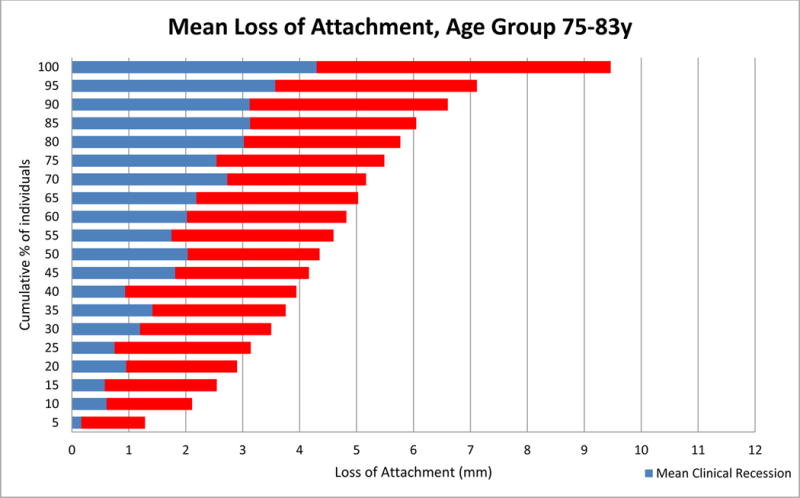
Mean Loss of Attachment in Age Group 75-83y, Half-Mouth Exam, Study of Health in Pomerania (SHIP)-Trend 2008-2012.
Table 2B lists additional clinical characteristics of individuals in the entire sample as well as in the upper quintile of mean CAL stratified by age group. For example, the youngest age group of the entire sample had a mean CAL of 1.19 mm, an average of 1.2 sites per person with CAL ≥ 4 mm, an average of 0.7 sites per person with PD ≥ 5 mm, an average of 0.1 sites per person with recession ≥ 3 mm, and an average of 1.5 missing teeth. Corresponding figures for the upper quintile in the same age group were 2.26 mm, 4.4 sites, 2.6 sites, 0.1 sites, and 2.3 missing teeth, respectively. In the 55-59 year old group, individuals in the entire sample had a mean CAL of 3.09 mm, 9.8 sites with CAL ≥ 4 mm, 2.3 sites with PD ≥ 5 mm, 2.5 sites with recession ≥ 3 mm and 7.2 missing teeth, versus a mean CAL of 5.72 mm, 19.7 sites with CAL ≥ 4 mm, 6.8 sites with PD ≥ 5 mm, 6.7 sites with recession ≥ 3 mm and 11.9 missing teeth in the upper quintile of the corresponding age group.
Table 2B.
Comparison of participants in the upper quintile of mean clinical attachment levels (CAL) with the entire sample, by age. Study of Health in Pomerania (SHIP)-Trend 2008–2012
| Age | Total Population* | Upper Quintile Group (top 20%)* | ||||||||||
|---|---|---|---|---|---|---|---|---|---|---|---|---|
|
| ||||||||||||
| N | Mean CAL | Mean No. of Sites with CAL ≥ 4mm |
Mean No. of Sites with PD ≥ 5mm |
Mean No. of Sites with Recession ≥ 3mm |
Mean No. of teeth missing** | n | Mean CAL | Mean No. of Sites with CAL ≥ 4mm |
Mean No. of Sites with PD ≥ 5mm |
Mean No. of Sites with Recession ≥ 3mm |
Mean No. of teeth missing ** | |
| 30–34 | 297 | 1.19 | 1.2 | 0.7 | 0.1 | 1.5 | 59 | 2.26 | 4.4 | 2.6 | 0.1 | 2.3 |
| 35–39 | 320 | 1.52 | 3.1 | 1.2 | 0.3 | 2.5 | 64 | 2.94 | 11.1 | 4.1 | 1.1 | 4.0 |
| 40–44 | 383 | 1.83 | 4.9 | 1.6 | 0.8 | 3.1 | 75 | 3.52 | 16.0 | 5.6 | 2.5 | 4.9 |
| 45–49 | 409 | 2.41 | 6.9 | 2.1 | 1.4 | 4.6 | 78 | 4.58 | 18.3 | 6.4 | 4.3 | 8.0 |
| 50–54 | 369 | 2.80 | 8.6 | 2.2 | 2.0 | 6.5 | 73 | 5.17 | 19.0 | 6.4 | 5.8 | 11.6 |
| 55–59 | 371 | 3.09 | 9.8 | 2.3 | 2.5 | 7.2 | 73 | 5.72 | 19.7 | 6.8 | 6.7 | 11.9 |
| 60–64 | 314 | 3.43 | 10.6 | 2.0 | 3.3 | 8.5 | 59 | 5.93 | 16.2 | 4.1 | 7.3 | 14.7 |
| 65–69 | 282 | 3.61 | 11.3 | 1.6 | 4.1 | 9.4 | 56 | 6.30 | 17.4 | 4.0 | 9.2 | 15.5 |
| 70–74 | 188 | 3.84 | 11.3 | 1.4 | 4.7 | 11.1 | 36 | 6.40 | 17.7 | 3.3 | 9.7 | 16.1 |
| 75–83 | 138 | 4.54 | 11.5 | 1.4 | 4.8 | 14.3 | 27 | 7.20 | 9.8 | 3.1 | 5.7 | 20.7 |
Based on Half-Mouth Examination
Based on a 28 –tooth dentition.
We further analyzed average CAL levels in the upper quintile group by tooth type and site location (disto-facial, mid-facial, mesio-facial and mid-lingual). Across all 4 sites, the average CAL was generally higher for posterior than anterior teeth, except for anterior mandibular teeth (Fig. M, Appendix). Average recession varied among sites and teeth, with more pronounced recession occurring at mid-facial and mid-lingual (predominantly among posterior maxillary and anterior mandibular teeth) sites. The average contribution of PD to CAL was lowest at mid-facial sites, followed by mid-lingual sites, and highest at interproximal sites.
When similar analyses were repeated for the upper quintile within each age group, (Figs. N-X, Appendix), primarily mid-facial and mid-lingual sites were affected by recession in the youngest age groups. As age increased, interproximal sites were equally affected by recession. Across all age groups, in participants in the upper quintile of attachment loss, the contribution of PD to CAL was lower at facial and lingual sites as compared to interproximal sites.
DISCUSSION
Our primary aim with this study was to attempt to generate age-dependent thresholds of periodontitis severity, using an empirical evidence-driven epidemiologic approach derived from two population-based studies of clinical periodontal status. To provide some context, one currently adopted definition of “severe periodontitis” is based on a specific threshold of linear clinical attachment loss (> 5 mm) (Armitage, 1999). An alternative commonly used definition of “severe periodontitis”, developed by the American Academy of Periodontology and the Centers of Disease Control calls for presence of ≥ 2 interproximal sites with ≥ 6 mm CAL (not on the same tooth) and ≥1 interproximal sites with ≥ 5mm PD. Neither approach is ideal because the same level of attachment loss or pocket depth at different ages can signify vastly different levels of risk for disease progression and tooth loss (Papapanou and Susin, 2017). Moreover, use of the above definitions in epidemiologic studies has resulted in questionably high estimates of the prevalence of severe periodontitis, especially in older age groups (Papapanou, 2012). Therefore, the alternative strategy adopted in this study was to (i) examine in detail the cumulative distribution of attachment loss in two different population samples across the age spectrum, (ii) identify within each age group subsets of individuals mostly affected by attachment loss, and (iii) quantify thresholds of mean attachment loss which, if exceeded, identify individuals whose periodontitis severity is disproportionate to their age.
Overall, mean attachment loss was higher in the Pomeranian than in the US sample across all age groups (Figs. 1A and 1B), although individuals in the upper 5% of the NHANES sample displayed substantially higher average mean CAL than their SHIP-Trend counterparts (Figs. 3A and 3L). However, common patterns were identified in the two populations, including a linear association of CAL with age. Interestingly, PD appeared to be the main contributor to CAL in ages up to 44 years, but in the older ages the contribution of recession to CAL increased substantially. As demonstrated by the cumulative distributions of CAL by age, for every five-year age group in the US sample, there was a subset of the sample (at least half), where the mean attachment loss did not exceed 2 mm in each age cohort. In Pomerania, approximately a quarter of the sample had a mean attachment loss of approximately 3 mm or more. Importantly, in these cohorts, attachment loss was mostly a result of pocket depth. However, on the other end of the continuum, the slope of the percentile distribution curve changed dramatically and the upper 10-20% subset of the sample showed substantially higher mean CAL. In this group, the mean CAL exceeded 2 mm in both the US and Pomerania across all age groups.
A steeper increase in average CAL in percentiles above the median was noticeable in ages over 45-49 years, where recession, rather than pocket depth, gradually accounted for an increasing portion of clinical attachment loss. Although the median scores of the mean CAL increased with each age group in both the US and Pomeranian population, the rate of increase was higher in the SHIP-Trend sample (Figs. 2A, 2B). In both populations, the rate of increase of CAL by age was mirrored by a similar trend in recession. In nearly all age groups from both populations, adults in percentiles below the median had PD accounting for more than half of their mean CAL.
Interestingly, our data demonstrate that the mean PD remains fairly consistent across the lifespan. Furthermore, as illustrated by the boxplots, the median scores of mean PD showed little variation across age groups. Equally important, the interquartile range remained consistent across age groups, suggesting no differential change in PD by increasing age in the majority of the participants in both the US and Pomeranian samples.
Since the NHANES and SHIP-Trend populations displayed significantly different levels of periodontitis, thresholds for mean attachment loss based on population percentiles were obviously different in the two samples. Thus, although the threshold values for mean CAL in the upper quintile in NHANES and SHIP-Trend were very close to each other in the two youngest age groups (2.58 mm and 2.98 mm vs. 2.26 and 2.94 mm), these thresholds diverged substantially in older ages. In NHANES, the upper quintile CAL threshold values increased gradually after the age of 40-44 years, peaked at 3.58 mm at the age 65-69 years, and were somewhat lower in the two older age groups (3.40 and 3.25 mm), partly also because of an increasing number of missing teeth. In contrast, in SHIP-Trend, the upper quintile mean CAL values increased linearly and more steeply with age and peaked at 7.20 mm at the oldest age group. Thus, “universal” age-dependent thresholds of periodontitis severity by age may be better defined by the magnitude of the attachment loss per se rather than by a specific percentile distribution cut-off.
Nevertheless, it must be realized that utilization of such thresholds obviously requires full-mouth assessments of clinical attachment loss which is time consuming and relatively uncommon in everyday clinical practice. We therefore sought to examine in more detail the clinical periodontal characteristics of those individuals who were identified as belonging to the upper quintile of their age group with respect to mean CAL. Thus, the value of the data presented in Tables 2A and 2B, as well as in the Appendix graphs that visualize the tooth- and site-specific patterns of CAL, lies with their potential to provide surrogate markers that can be employed in the identification of individuals in the upper quintile of mean CAL, in the absence of full mouth CAL. For example, it would be useful to attempt to employ easily assessable measures of periodontal status, such as number of missing teeth, number of pockets beyond a certain depth, or number of sites with visible recession exceeding a defined threshold to identify individuals in the upper quintile of CAL. Obviously, the development of such a predictive tool has to undergo a formal validation process before it can be implemented, and is beyond the scope of the current work.
Alternatively, validation of these thresholds should include a longitudinal assessment examining whether identified individuals ran a higher risk of tooth loss due to periodontitis, in a manner analogous to the utility of hypertension thresholds generated in the Framingham Studies to predict incident cardiovascular disease or mortality (Port et al., 2000). These subsequent analyses should be carried out in existing longitudinal data sets from different population samples to examine whether there are “inherent” age-dependent thresholds of periodontitis severity, beyond which tooth loss is inevitable.
Furthermore, the Appendix graphs provide a clear illustration of the commonalities in the relationship between recession and CAL in specific teeth and periodontal sites in NHANES and SHIP-Trend. In both populations, individuals in the upper quintile of CAL showed highest average CAL and recession at the lower anterior teeth and posterior molars. In both populations, the disto-facial aspect of the upper first molar and the mesio-facial of the upper second molar showed the highest average CAL. Lower anterior teeth consistently presented with high levels of clinical recession.
Our study has important strengths, notably the fact that it is based on two large population-based national surveys from two developed countries. Although NHANES is based on a FMPE assessing 28 teeth at 6 sites per tooth, thereby providing an accurate estimation of the prevalence of periodontitis in the US population, SHIP-Trend is based on a PMPE assessing 4 sites per tooth, which may have resulted in underestimation of prevalence. However, given that the focus of our study was the age-dependent distribution of CAL and related periodontal measures rather than assessment of prevalence of periodontitis within the respective populations, it is unlikely that this methodological limitation has had any substantial impact on our findings. Moreover, the study does not attempt to make any causal inferences on the role of age on periodontal status due to its cross-sectional design. The study samples were limited to adults ≥30 years, consequently, age-dependent patterns of CAL in younger individuals were unascertainable. Both studies excluded those with a medical condition that would require antibiotic prophylaxis prior to probing and institutionalized individuals, therefore, a segment of the population with potentially more severe periodontitis may have not been assessed. Nevertheless, it is unlikely that the age-dependent distributions of CAL generated in the study would be substantially different, had these individuals been included in the samples examined.
Lastly, we note that the NHANES and SHIP-Trend populations showed substantially different levels of periodontitis severity, a finding that is likely attributed to cohort effects. Typically, cohort effects are driven by age, as age and related period effects can be a strongly associated, resulting in confounding. However, the mean age of both populations did not differ substantially (51 vs. 52 years) and the sample sizes among the analyzed age groups were similar. Additional attributes, rather than age, that were unique to each population and are more likely underlying the cohort effect include social/political/economic conditions, access to care, and exposure to important risk factors such as cigarette smoking. In the US, cigarette smoking has been declining and only 18% of the NHANES sample analyzed in this study were current smokers. In contrast, smoking was more prevalent in the SHIP-Trend cohort, with more than 35% of the participants being current smokers. Because the population attributable risk for periodontitis due to smoking is high, the differences seen in periodontitis severity between the two countries can be attributed to a large extent to differences in smoking. Tooth loss was also different between the two populations and could have contributed to a cohort effect as well. Although loss of periodontitis-affected teeth can conceivably result in “healthy tooth survivor” effects, it has been shown that individuals with fewer remaining teeth have higher mean CAL and PD measures (Holtfreter et al. 2009, 2012). However, the reasons underlying the observed differences in periodontitis severity between NHANES and SHIP-Trend was not the main purpose of this report which rather focused on illustrating patterns of attachment loss by age.
Our study is an exploratory, initial step towards introducing empirical evidence-driven, age-dependent thresholds for severe periodontitis. It provides detailed evidence that age is a significant determinant of the clinical presentation of periodontitis, and demonstrates that the relative contribution of pocketing and recession to total attachment loss differs with age. At the same time, the substantial phenotypic variability within each age group strongly suggests that exposures other than age are pivotal in determining susceptibility to periodontitis. Additional data from other populations must be used to augment the generalizability of the present findings.
Supplementary Material
Figure 3D.
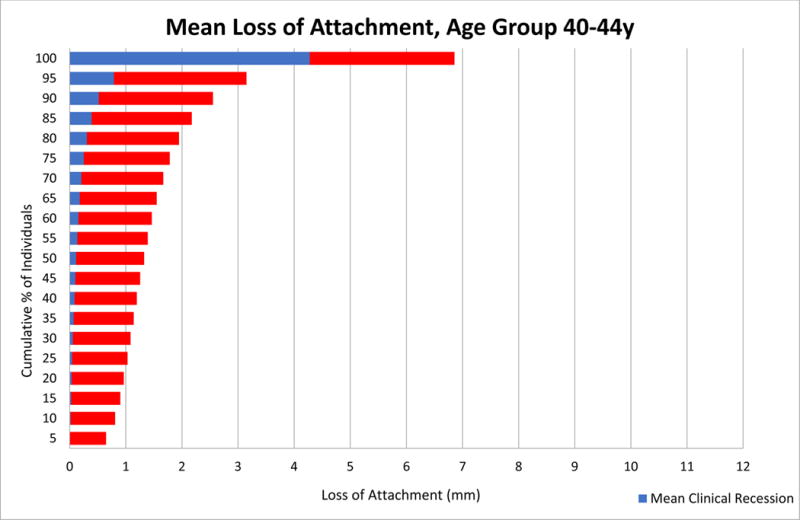
Mean Loss of Attachment in Age Group 40-44y, Full-Mouth Exam, National Health and Nutrition Examination Survey (NHANES) 2009-2014.
Figure 3E.
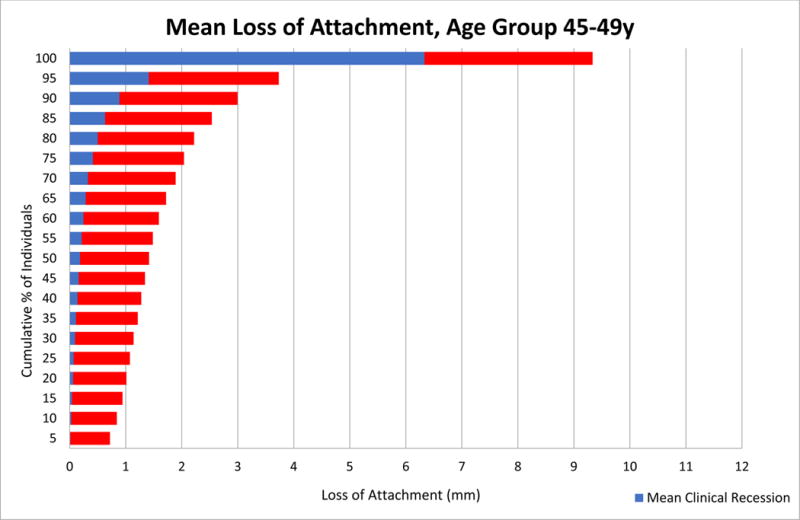
Mean Loss of Attachment in Age Group 45-49y, Full-Mouth Exam, National Health and Nutrition Examination Survey (NHANES) 2009-2014.
Figure 3G.
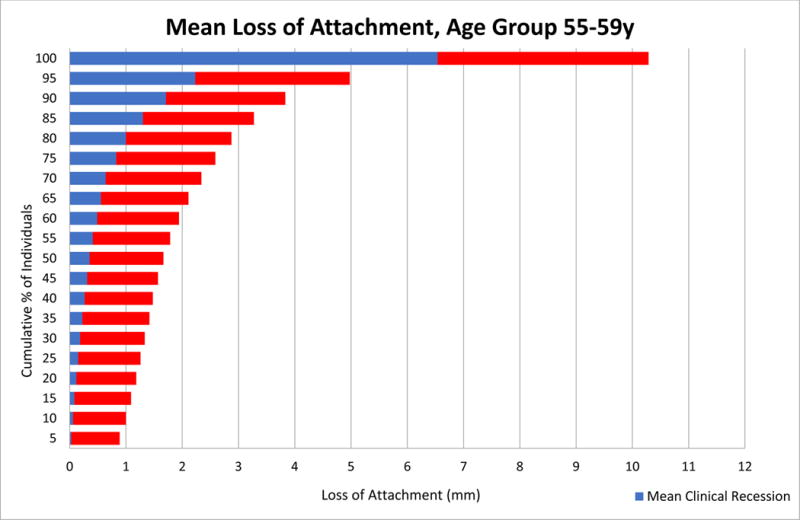
Mean Loss of Attachment in Age Group 55-59y, Full-Mouth Exam, National Health and Nutrition Examination Survey (NHANES) 2009-2014.
Figure 3H.
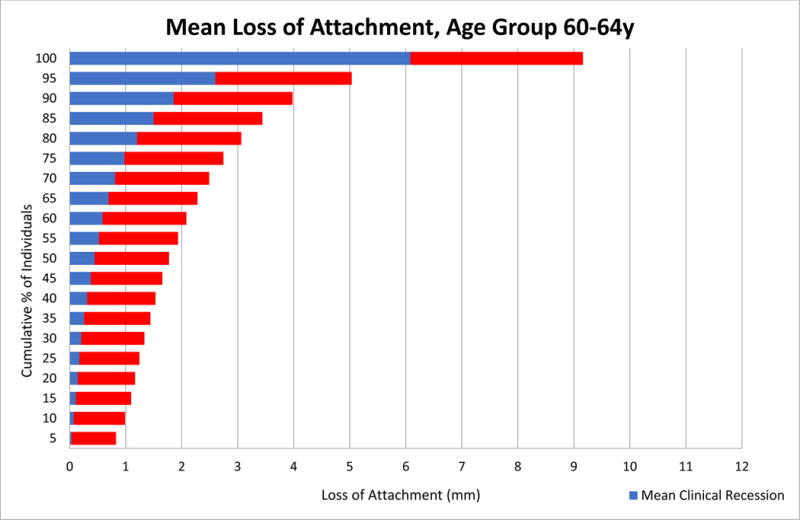
Mean Loss of Attachment in Age Group 60-64y, Full-Mouth Exam, National Health and Nutrition Examination Survey (NHANES) 2009-2014.
Figure 3I.
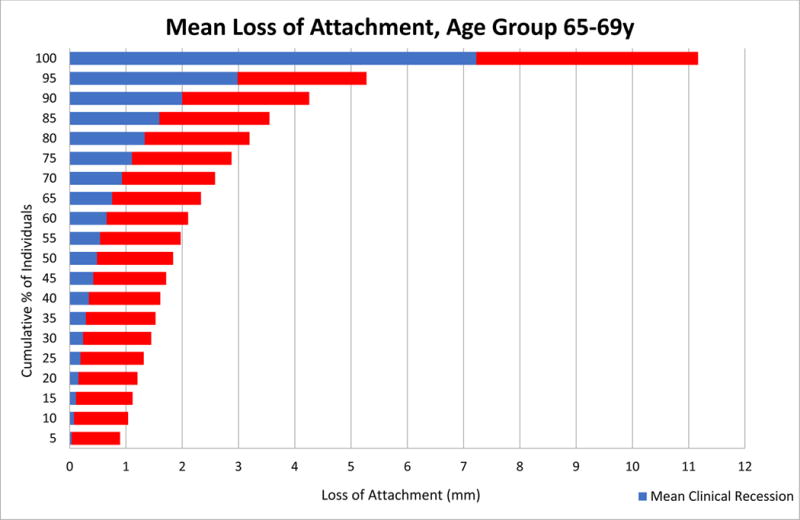
Mean Loss of Attachment in Age Group 65-69y, Full-Mouth Exam, National Health and Nutrition Examination Survey (NHANES) 2009-2014.
Figure 3J.
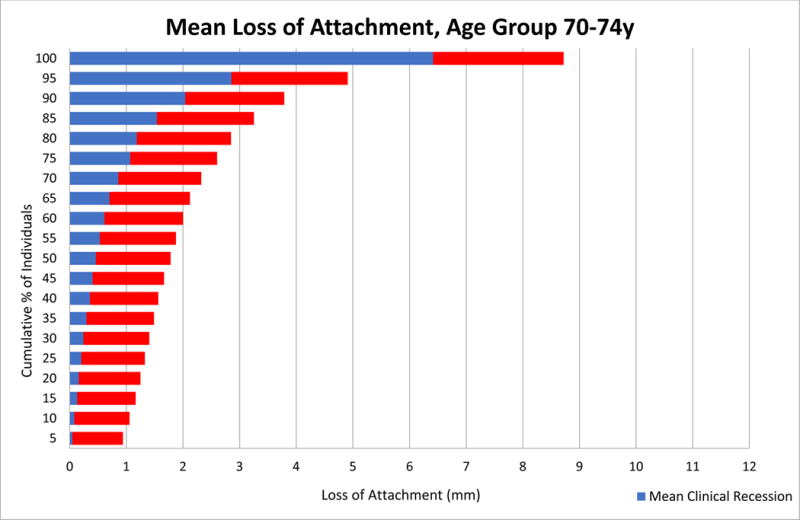
Mean Loss of Attachment in Age Group 70-74y, Full-Mouth Exam, National Health and Nutrition Examination Survey (NHANES) 2009-2014.
Figure 3N.
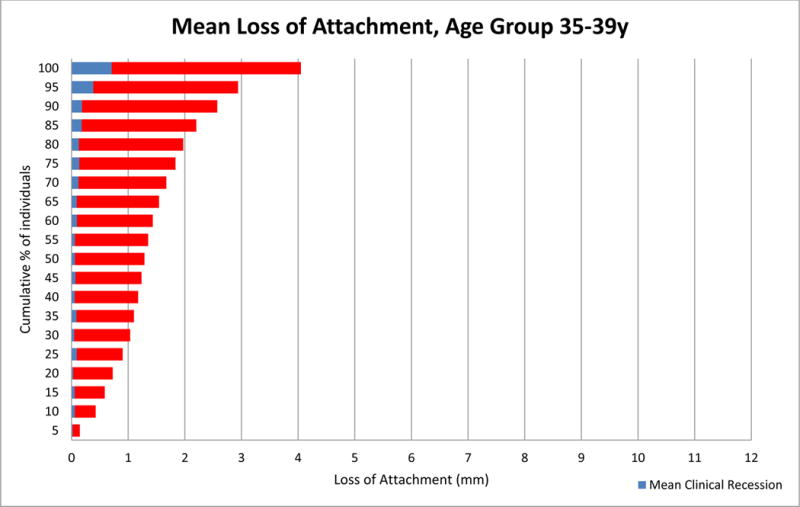
Mean Loss of Attachment in Age Group 35-39y, Half-Mouth Exam, Study of Health in Pomerania (SHIP)-Trend 2008-2012.
Figure 3O.
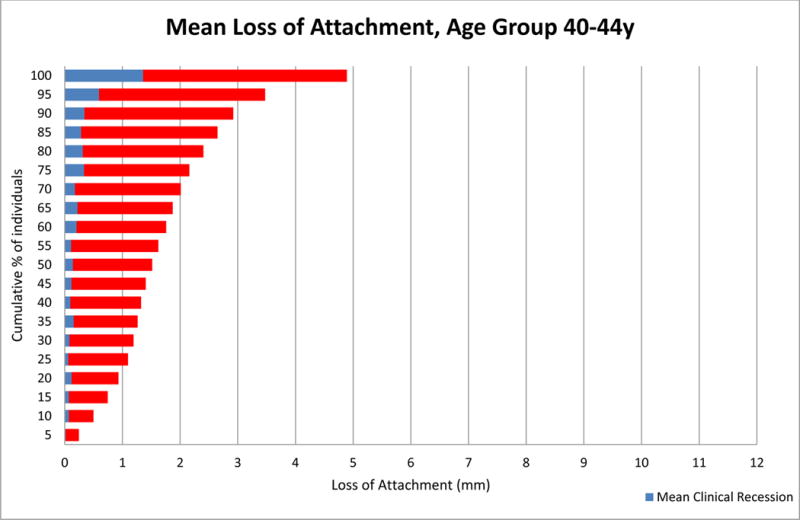
Mean Loss of Attachment in Age Group 40-44y, Half-Mouth Exam, Study of Health in Pomerania (SHIP)-Trend 2008-2012.
Figure 3P.
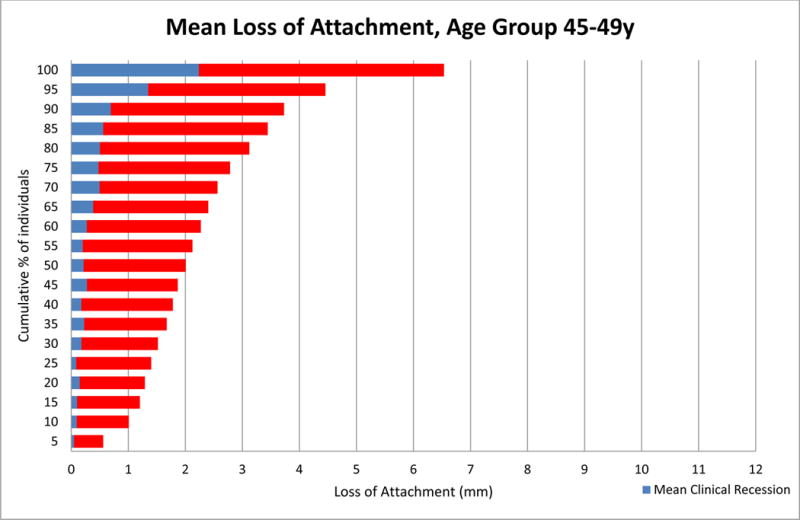
Mean Loss of Attachment in Age Group 45-49y, Half-Mouth Exam, Study of Health in Pomerania (SHIP)-Trend 2008-2012.
Figure 3Q.
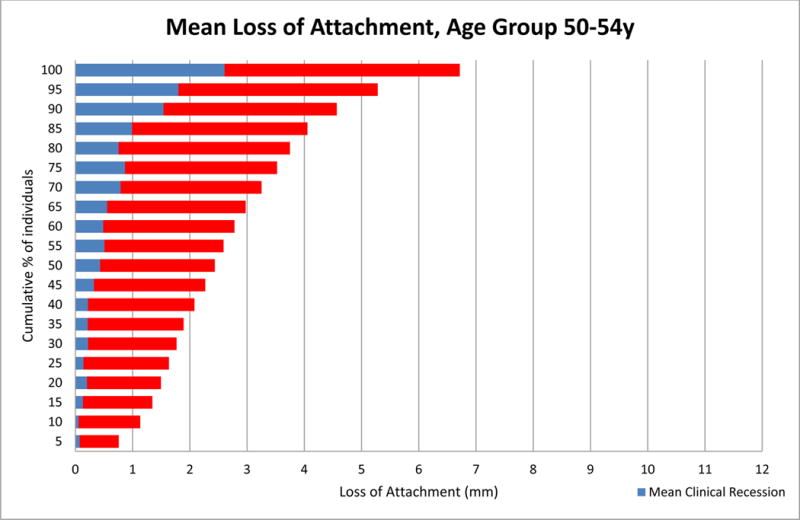
Mean Loss of Attachment in Age Group 50-54y, Half-Mouth Exam, Study of Health in Pomerania (SHIP)-Trend 2008-2012.
Figure 3R.
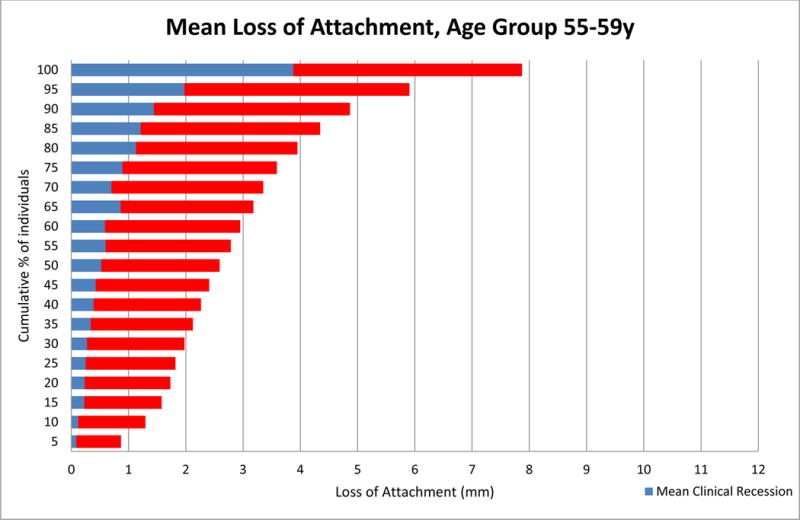
Mean Loss of Attachment in Age Group 55-59y, Half-Mouth Exam, Study of Health in Pomerania (SHIP)-Trend 2008-2012.
Figure 3S.
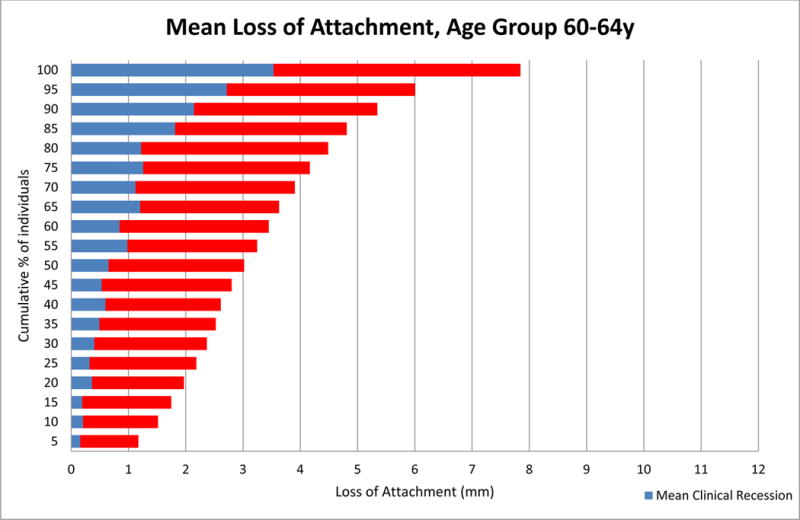
Mean Loss of Attachment in Age Group 60-64y, Half-Mouth Exam, Study of Health in Pomerania (SHIP)-Trend 2008-2012.
Figure 3T.
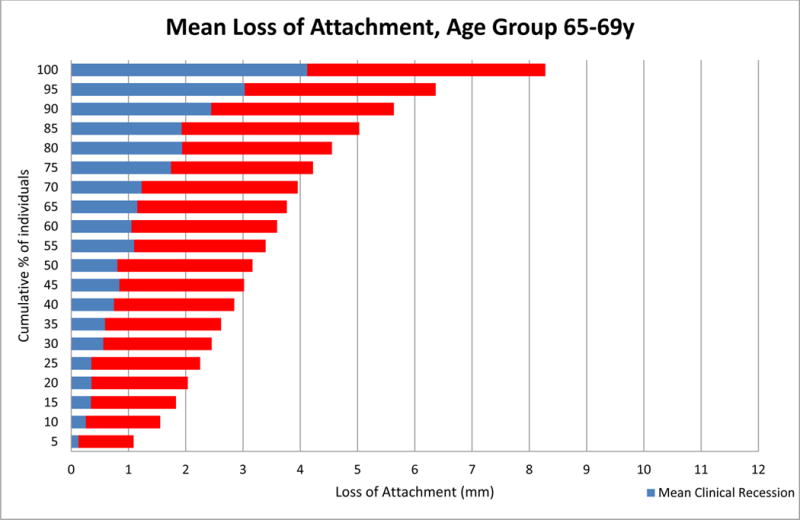
Mean Loss of Attachment in Age Group 65-69y, Half-Mouth Exam, Study of Health in Pomerania (SHIP)-Trend 2008-2012.
Figure 3U.
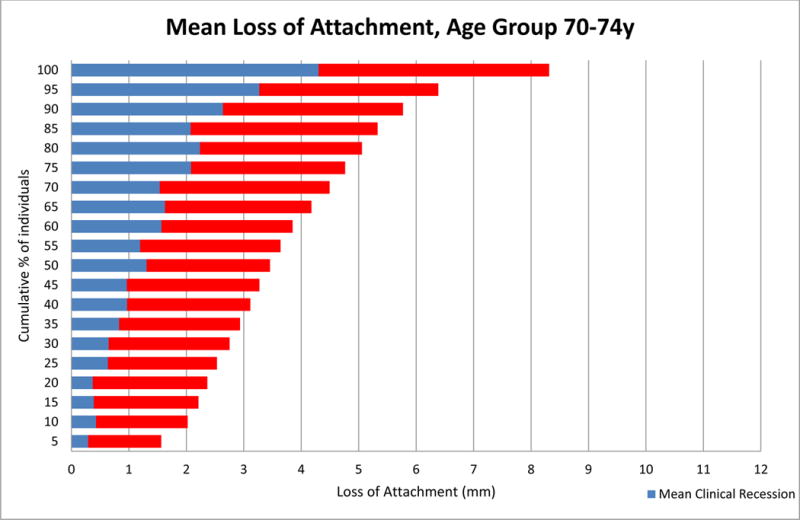
Mean Loss of Attachment in Age Group 70-74y, Half-Mouth Exam, Study of Health in Pomerania (SHIP)-Trend 2008-2012.
Ethics Statement.
All study participants gave informed consent in accordance with the respective Research Ethics Review Boards for both the NHANES and SHIP-Trend studies.
Acknowledgments
Funding Body Agreements & Policy:
SHIP is part of the Community Medicine Research net CMR of the University Medicine of Greifswald, Germany, which is funded by the Federal Ministry of Education and Research, the Ministry of Cultural Affairs as well as the Social Ministry of the Federal State of Mecklenburg-West Pomerania. The CMR encompasses several research projects, which are sharing data of population-based studies SHIP (http://ship.community-medicine.de). The National Health and Nutrition Survey (NHANES) is conducted by the National Center for Health Statistics of the Centers for Disease Control and Prevention and receives additional funding from various agencies of the US Government. This research was partially supported by the National Institute of Dental and Craniofacial Research (NIDCR) and some authors were paid a salary by the NIH. The views expressed in this article are that of the authors and do not necessarily represent the views of the National Institutes of Health or the US Government.
APPENDIX
Figure A.
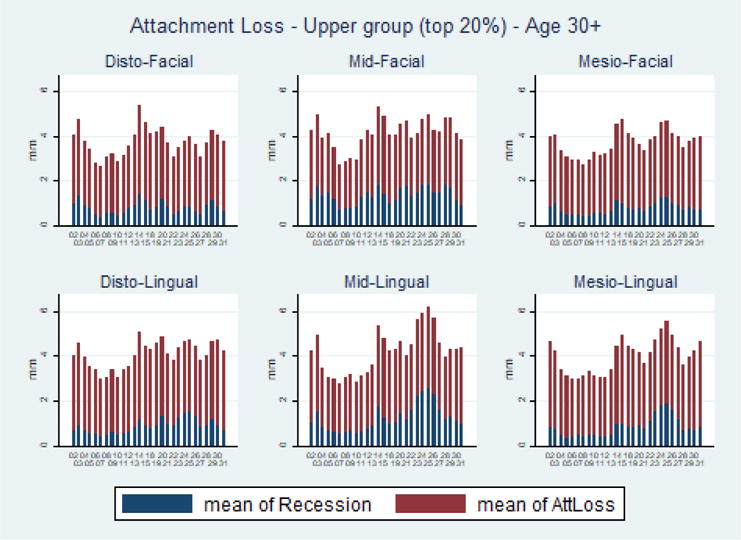
Average Clinical Attachment Loss by Site – Upper Quintile, Total Sample, National Health and Nutrition Examination Survey (NHANES) 2009-2014
Figure B.
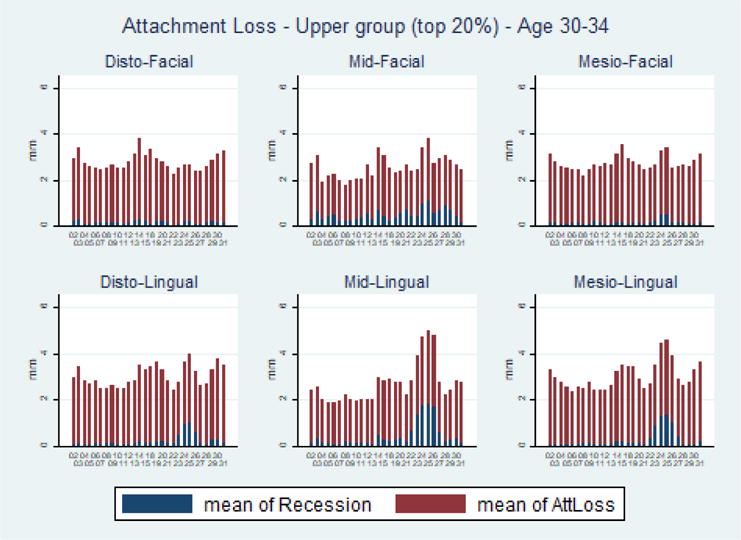
Average Clinical Attachment Loss by Site – Upper Quintile, Age 30-34, National Health and Nutrition Examination Survey (NHANES) 2009-2014
Figure C.
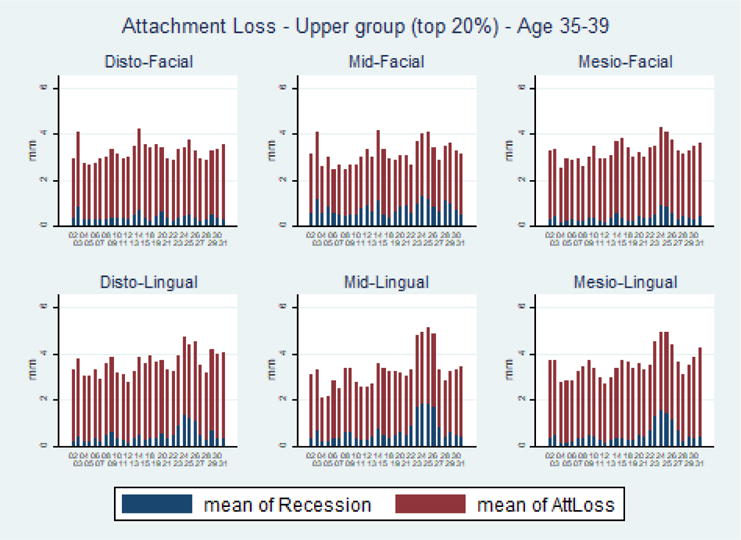
Average Clinical Attachment Loss by Site – Upper Quintile, Age 35-39, National Health and Nutrition Examination Survey (NHANES) 2009-2014
Figure D.
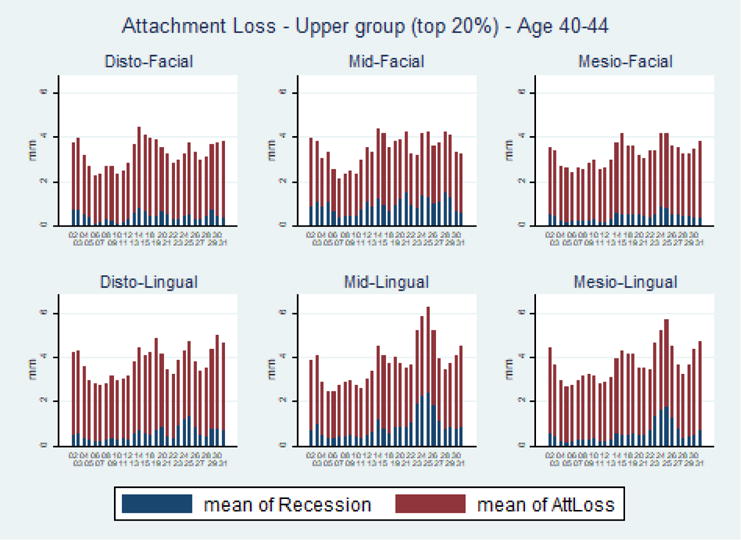
Average Clinical Attachment Loss by Site – Upper Quintile, Age 40-44, National Health and Nutrition Examination Survey (NHANES) 2009-2014
Figure E.
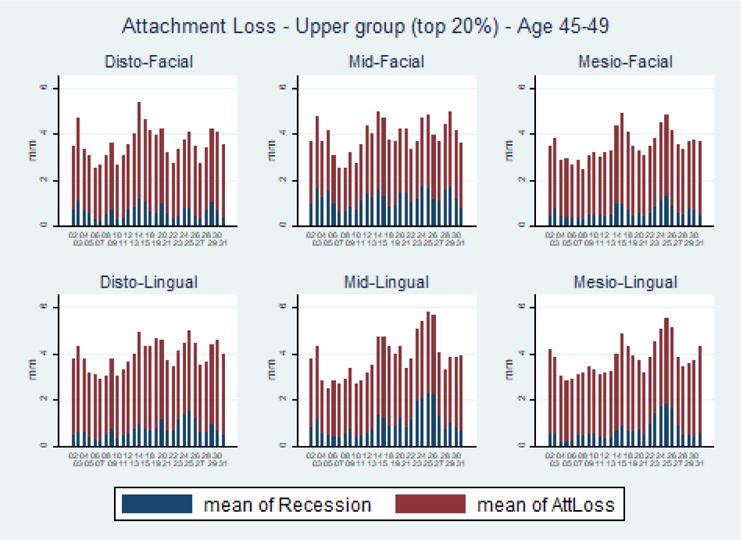
Average Clinical Attachment Loss by Site – Upper Quintile, Age 45-49, National Health and Nutrition Examination Survey (NHANES) 2009-2014
Figure F.
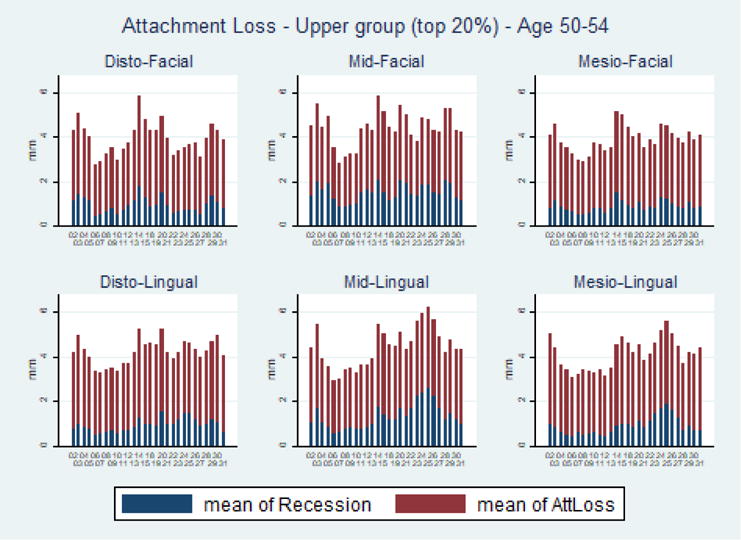
Average Clinical Attachment Loss by Site – Upper Quintile, Age 50-54, National Health and Nutrition Examination Survey (NHANES) 2009-2014
Figure G.
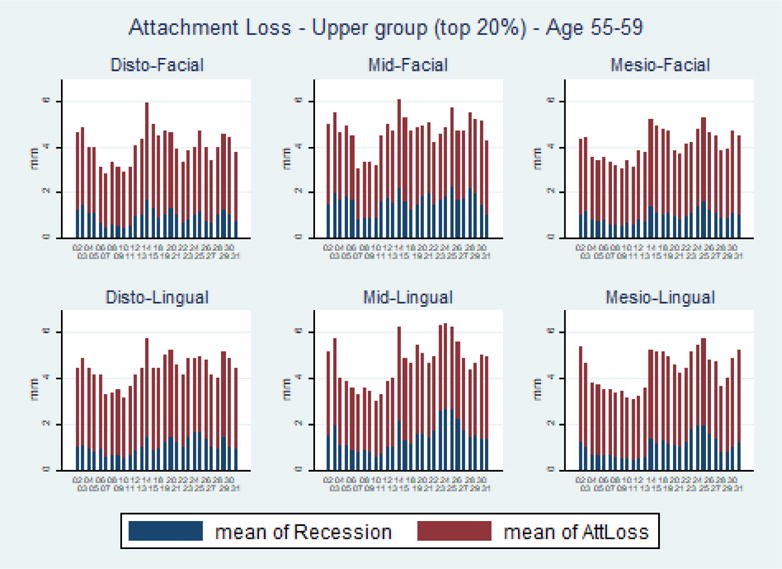
Average Clinical Attachment Loss by Site – Upper Quintile, Age 55-59, National Health and Nutrition Examination Survey (NHANES) 2009-2014
Figure H.
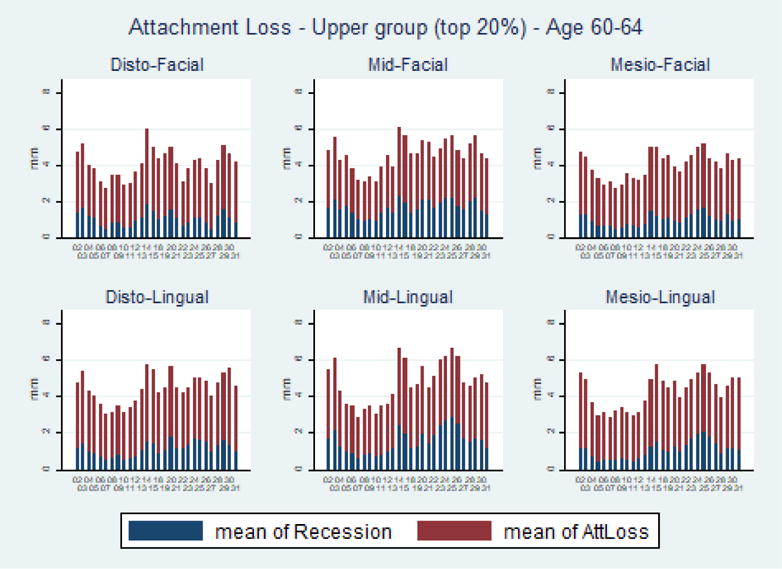
Average Clinical Attachment Loss by Site – Upper Quintile, Age 60-64, National Health and Nutrition Examination Survey (NHANES) 2009-2014
Figure I.
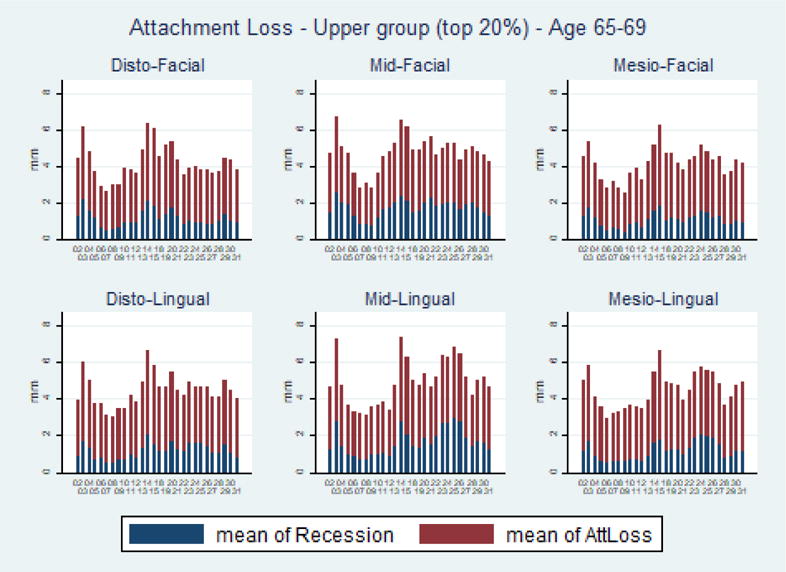
Average Clinical Attachment Loss by Site – Upper Quintile, Age 65-69, National Health and Nutrition Examination Survey (NHANES) 2009-2014
Figure J.
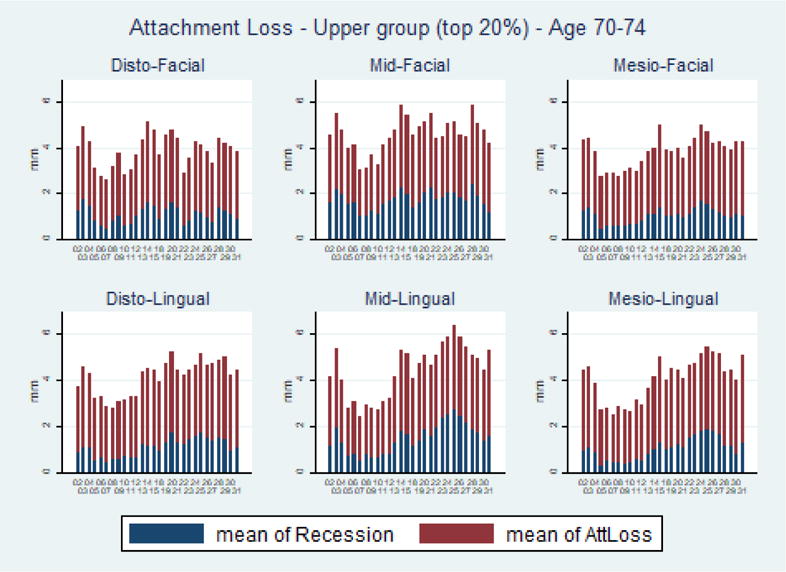
Average Clinical Attachment Loss by Site – Upper Quintile, Age 70-74, National Health and Nutrition Examination Survey (NHANES) 2009-2014
Figure K.
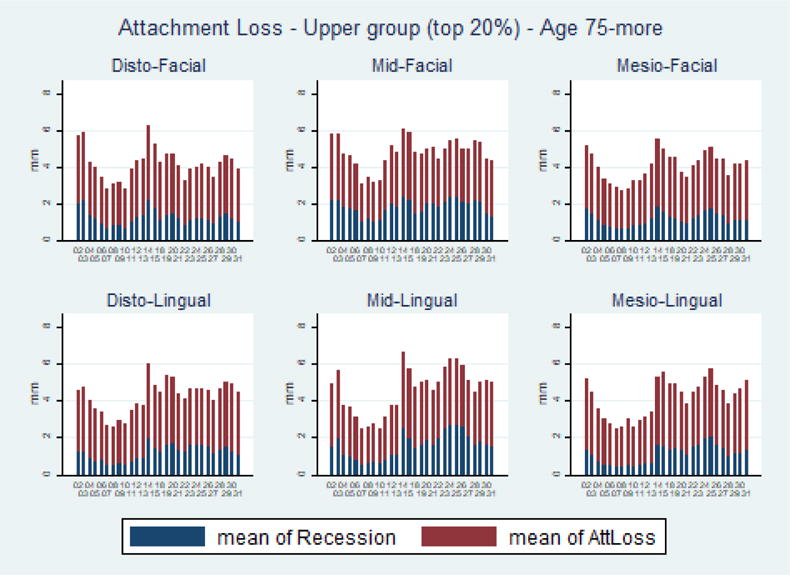
Average Clinical Attachment Loss by Site – Upper Quintile, Age 75-more, National Health and Nutrition Examination Survey (NHANES) 2009-2014
Figure L.
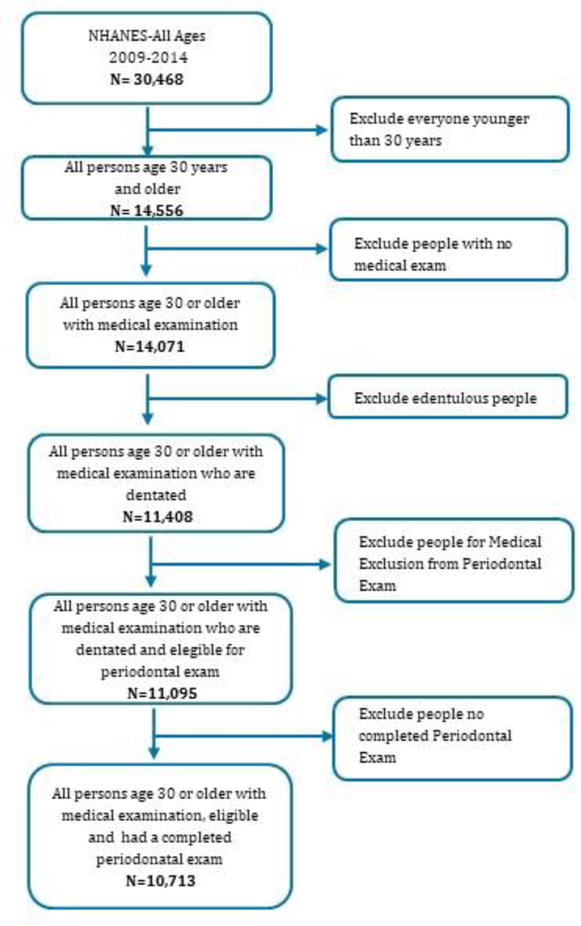
Flow Chart
Figure M.
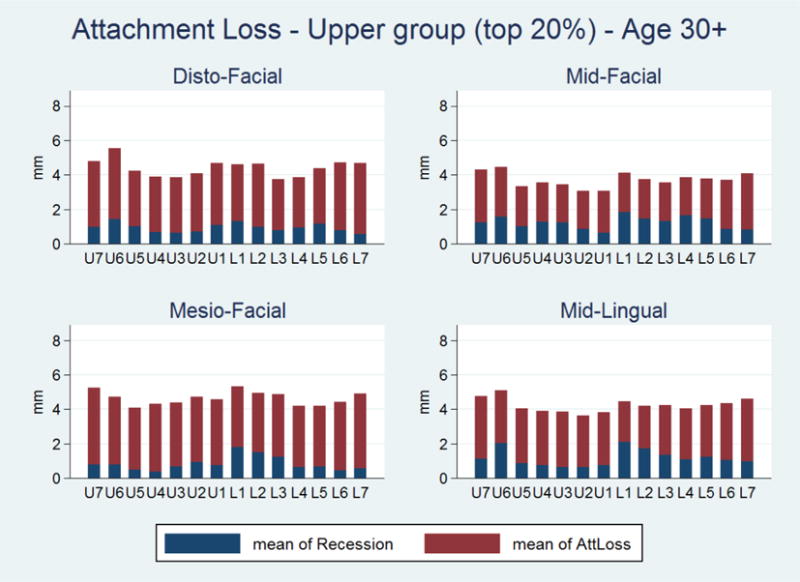
Average Clinical Attachment Loss by Site – Upper Quintile, Total Sample, Study of Health in Pomerania (SHIP)-Trend 2008-2012
Figure N.
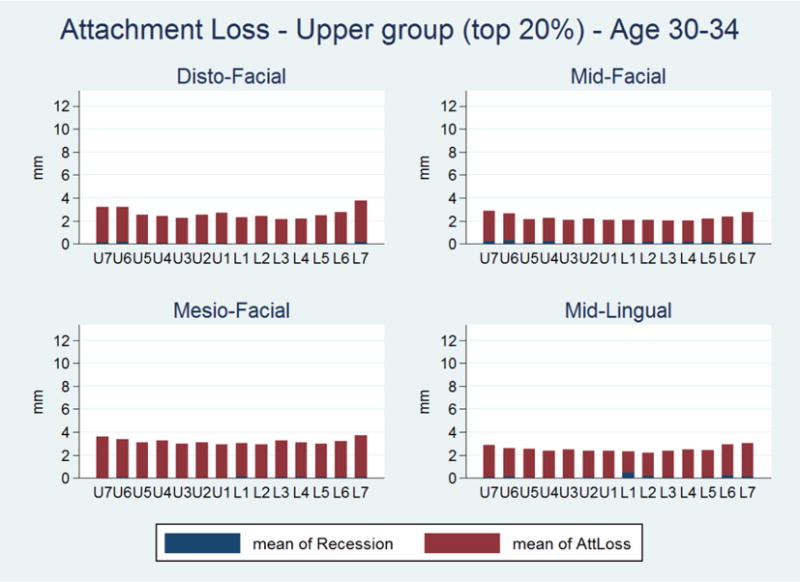
Average Clinical Attachment Loss by Site – Upper Quintile, Age 30-34, Study of Health in Pomerania (SHIP)-Trend 2008-2012
Figure O.
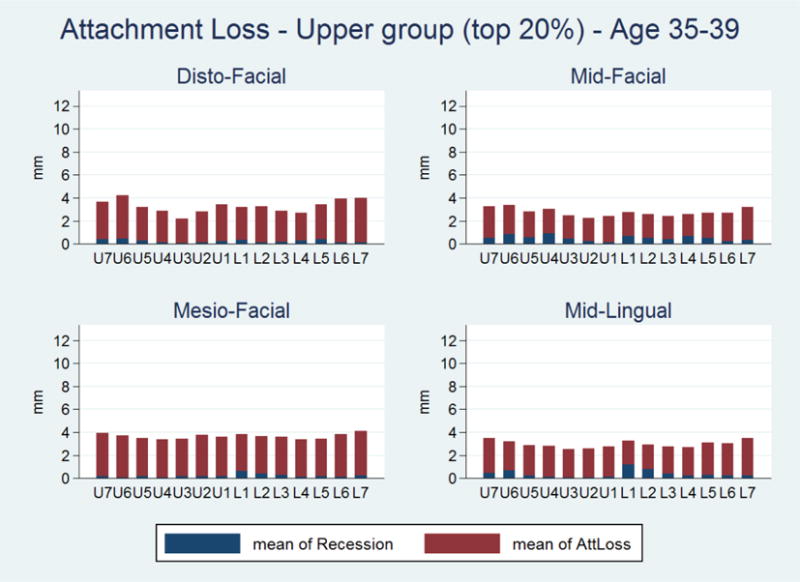
Average Clinical Attachment Loss by Site – Upper Quintile, Age 35-39, Study of Health in Pomerania (SHIP)-Trend 2008-2012
Figure P.
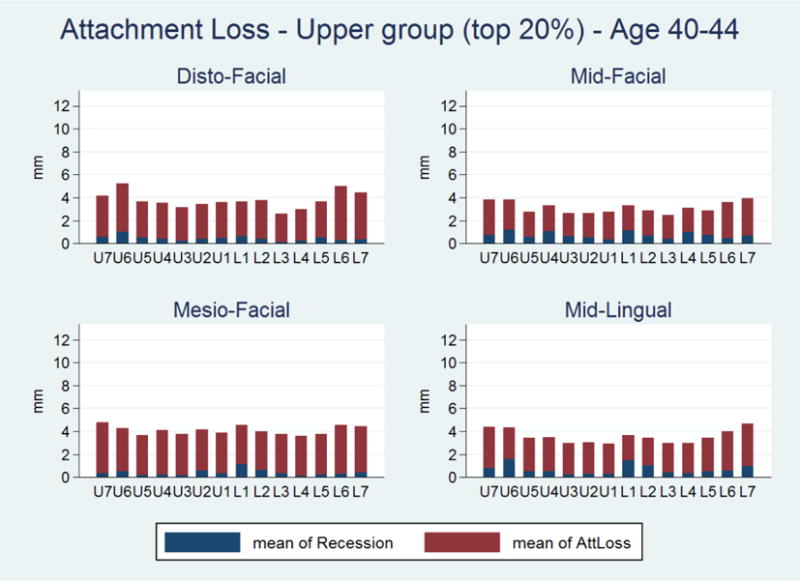
Average Clinical Attachment Loss by Site – Upper Quintile, Age 40-44, Study of Health in Pomerania (SHIP)-Trend 2008-2012
Figure Q.
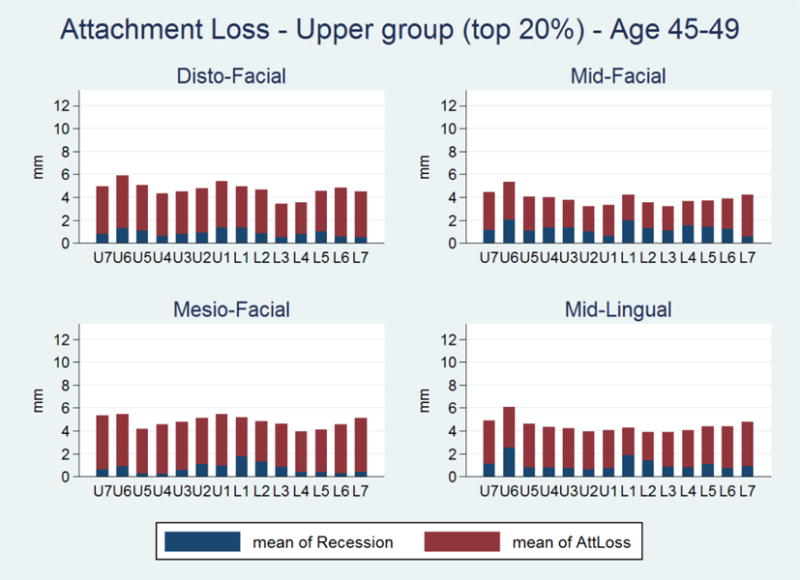
Average Clinical Attachment Loss by Site – Upper Quintile, Age 45-49, Study of Health in Pomerania (SHIP)-Trend 2008-2012
Figure R.
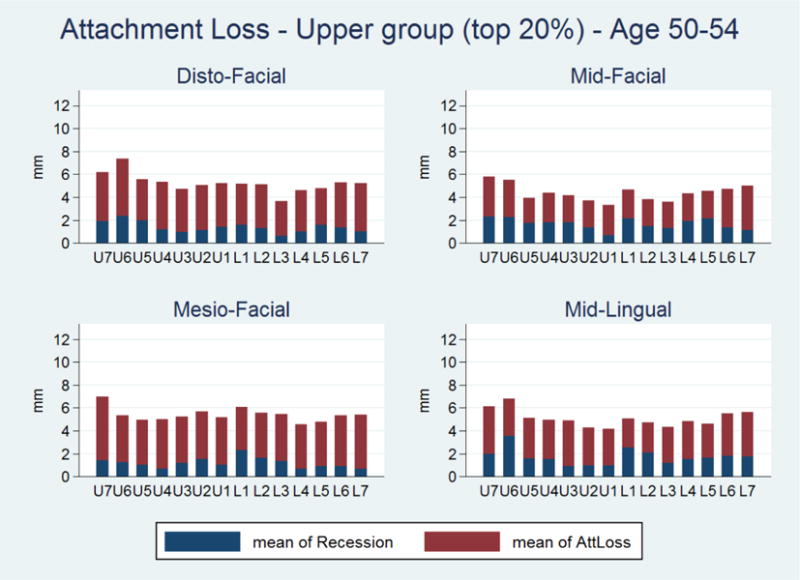
Average Clinical Attachment Loss by Site – Upper Quintile, Age 50-54, Study of Health in Pomerania (SHIP)-Trend 2008-2012
Figure S.
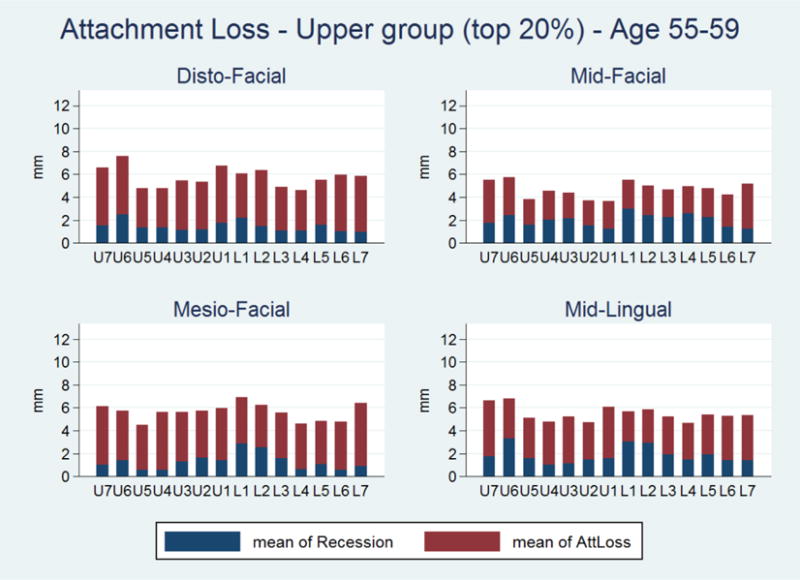
Average Clinical Attachment Loss by Site – Upper Quintile, Age 55-59, Study of Health in Pomerania (SHIP)-Trend 2008-2012
Figure T.
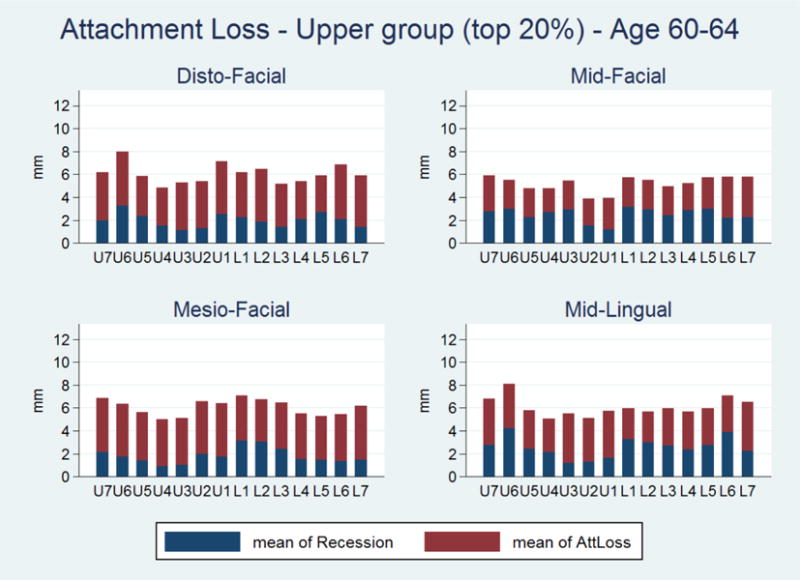
Average Clinical Attachment Loss by Site – Upper Quintile, Age 60-64, Study of Health in Pomerania (SHIP)-Trend 2008-2012
Figure U.
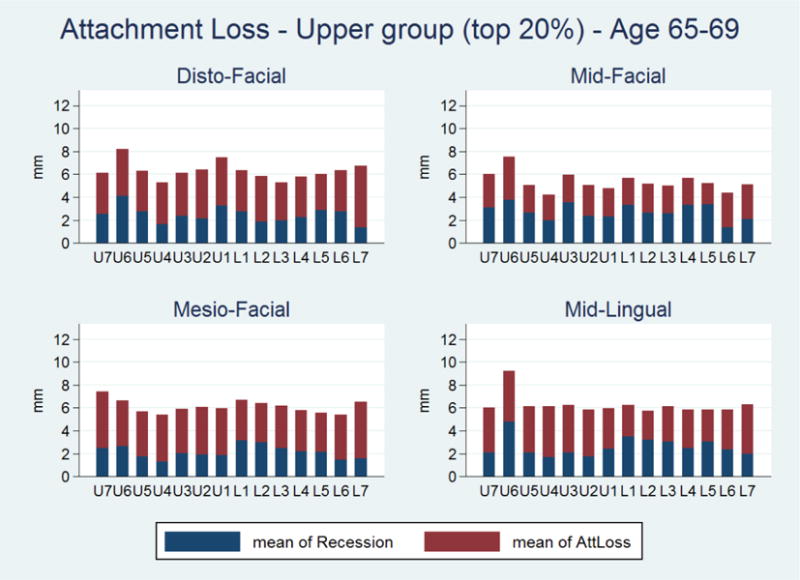
Average Clinical Attachment Loss by Site – Upper Quintile, Age 65-69, Study of Health in Pomerania (SHIP)-Trend 2008-2012
Figure V.
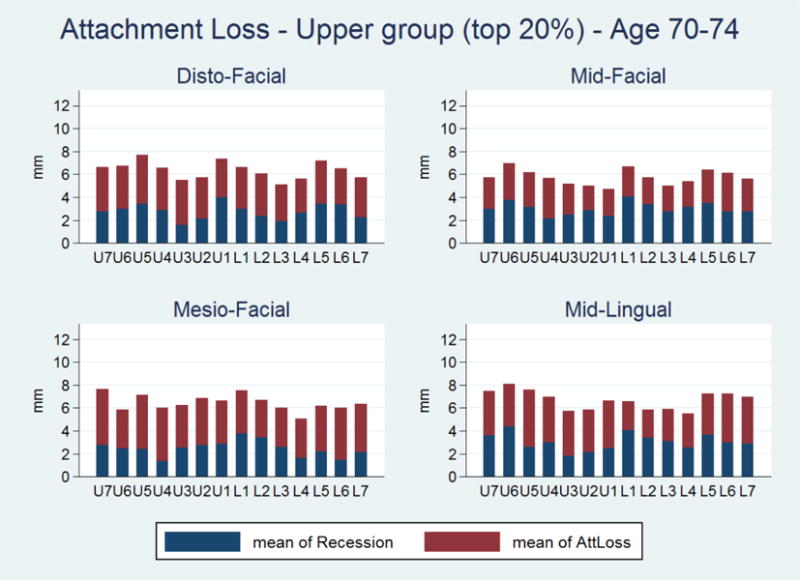
Average Clinical Attachment Loss by Site – Upper Quintile, Age 70-74, Study of Health in Pomerania (SHIP)-Trend 2008-2012
Figure X.
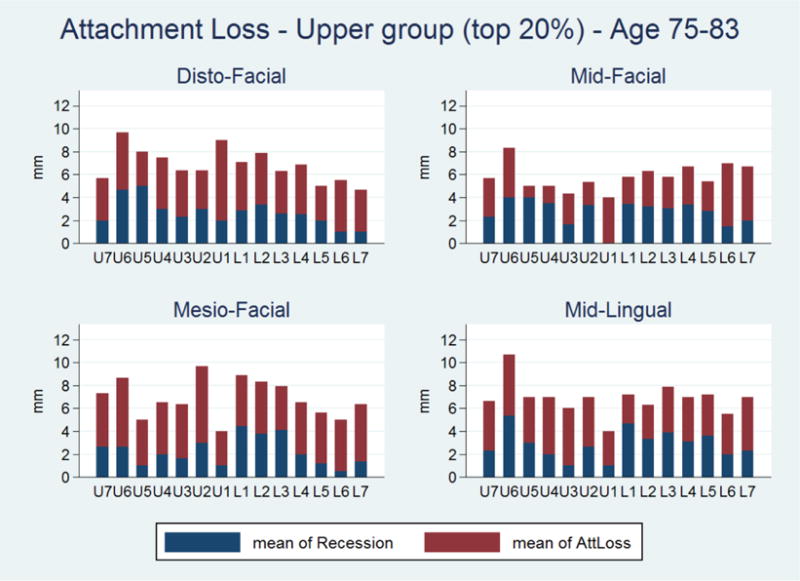
Average Clinical Attachment Loss by Site – Upper Quintile, Age 75-83, Study of Health in Pomerania (SHIP)-Trend 2008-2012
Figure Y.
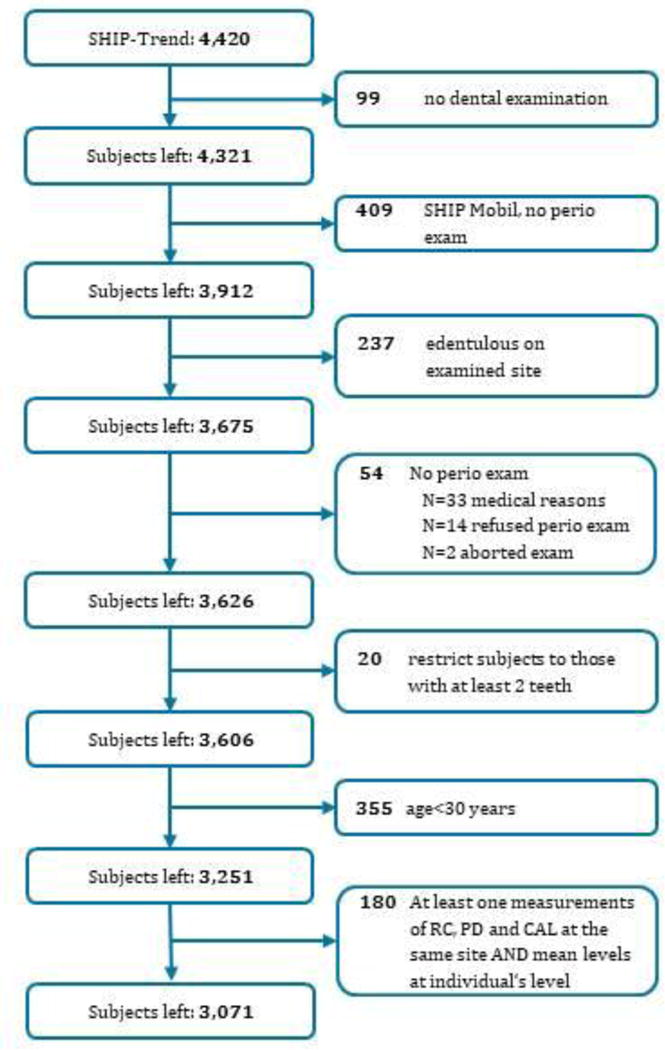
Flow Chart
Footnotes
The authors do not have any financial or other competing interests to declare.
Contributor Information
Monisha Billings, NIDCR, USA.
Birte Holtfreter, University Greifswald, Germany.
Panos N. Papapanou, Columbia University, USA
Gabriela Lopez Mitnik, NIDCR, USA.
Thomas Kocher, University Greifswald, Germany.
Bruce A. Dye, NIDCR, USA
References
- Centers for Disease Control and Prevention. National Health and Nutrition Examination Survey. Questionnaires, Datasets, and Related Documentation. Available at: http://www.cdc.gov/nchs/nhanes/nhanes_questionnaires.htm. Accessed September 29, 2017.
- World Health Organization Health Impact Assessment. The Determinants of Health. Available at http://www.who.int/hia/evidence/doh/en/. Accessed October 2017.
- Armitage GC. Development of a classification system for periodontal diseases and conditions. Ann Periodontol. 1999;4:1–6. doi: 10.1902/annals.1999.4.1.1. [DOI] [PubMed] [Google Scholar]
- Burt BA. Definitions of risk. J Dent Educ. 2001;65:1007–1008. [PubMed] [Google Scholar]
- Dye BAAJ, Iafolla T. Overview and Quality Assurance for the Oral Health Component of the National Health and Nutrition Examination Survey (NHANES), 2011-2014. Under review. 2017 doi: 10.1186/s12903-019-0777-6. [DOI] [PMC free article] [PubMed] [Google Scholar]
- Dye BA, Li X, Lewis BG, Iafolla T, Beltran-Aguilar ED, Eke PI. Overview and quality assurance for the oral health component of the National Health and Nutrition Examination Survey (NHANES), 2009-2010. J Public Health Dent. 2014;74:248–256. doi: 10.1111/jphd.12056. [DOI] [PubMed] [Google Scholar]
- Eke PI, Wei L, Thornton-Evans GO, Borrell LN, Borgnakke WS, Dye B, Genco RJ. Risk Indicators for Periodontitis in US Adults: NHANES 2009 to 2012. J Periodontol. 2016;87:1174–1185. doi: 10.1902/jop.2016.160013. [DOI] [PMC free article] [PubMed] [Google Scholar]
- Frencken JE, Sharma P, Stenhouse L, Green D, Laverty D, Dietrich T. Global epidemiology of dental caries and severe periodontitis - a comprehensive review. J Clin Periodontol. 2017;44(Suppl 18):S94–S105. doi: 10.1111/jcpe.12677. [DOI] [PubMed] [Google Scholar]
- Holtfreter B, Schwahn C, Biffar R, Kocher T. Epidemiology of periodontal diseases in the study of health in Pomerania. J Clin Periodontol. 2009;36:114–123. doi: 10.1111/j.1600-051X.2008.01361.x. [DOI] [PubMed] [Google Scholar]
- Holtfreter B, Demmer RT, Bernhardt O, Papapanou PN, Schwahn C, Kocher T, Desvarieux M. A comparison of periodontal status in the two regional, population-based studies of SHIP and INVEST. J Clin Periodontol. 2012;39:1115–1124. doi: 10.1111/jcpe.12018. [DOI] [PMC free article] [PubMed] [Google Scholar]
- Kassebaum NJ, Bernabe E, Dahiya M, Bhandari B, Murray CJ, Marcenes W. Global burden of severe periodontitis in 1990-2010: a systematic review and meta-regression. J Dent Res. 2014;93:1045–1053. doi: 10.1177/0022034514552491. [DOI] [PMC free article] [PubMed] [Google Scholar]
- Lang NP, Suvan JE, Tonetti MS. Risk factor assessment tools for the prevention of periodontitis progression a systematic review. J Clin Periodontol. 2015;42(Suppl 16):S59–70. doi: 10.1111/jcpe.12350. [DOI] [PubMed] [Google Scholar]
- Papapanou PN, Lindhe J, Sterrett JD, Eneroth L. Considerations on the contribution of ageing to loss of periodontal tissue support. J Clin Periodontol. 1991;18:611–615. doi: 10.1111/j.1600-051x.1991.tb00098.x. [DOI] [PubMed] [Google Scholar]
- Papapanou PN. The prevalence of periodontitis in the US: forget what you were told. J Dent Res. 2012;91:907–908. doi: 10.1177/0022034512458692. [DOI] [PubMed] [Google Scholar]
- Papapanou PN, Susin C. Periodontitis epidemiology: is periodontitis under-recognized, over-diagnosed, or both? Periodontol 2000. 2017;75:45–51. doi: 10.1111/prd.12200. [DOI] [PubMed] [Google Scholar]
- Port S, Demer L, Jennrich R, Walter D, Garfinkel A. Systolic blood pressure and mortality. Lancet. 2000;355:175–180. doi: 10.1016/S0140-6736(99)07051-8. [DOI] [PubMed] [Google Scholar]
- Rose G. Sick individuals and sick populations. Int J Epidemiol. 1985;14:32–38. doi: 10.1093/ije/14.1.32. [DOI] [PubMed] [Google Scholar]
- Schutzhold S, Kocher T, Biffar R, Hoffmann T, Schmidt CO, Micheelis W, Jordan R, Holtfreter B. Changes in prevalence of periodontitis in two German population-based studies. J Clin Periodontol. 2015;42:121–130. doi: 10.1111/jcpe.12352. [DOI] [PubMed] [Google Scholar]
- Van Dyke TE, Sheilesh D. Risk factors for periodontitis. J Int Acad Periodontol. 2005;7:3–7. [PMC free article] [PubMed] [Google Scholar]
- Volzke H, Alte D, Schmidt CO, Radke D, Lorbeer R, Friedrich N, Aumann N, Lau K, Piontek M, Born G, Havemann C, Ittermann T, Schipf S, Haring R, Baumeister SE, Wallaschofski H, Nauck M, Frick S, Arnold A, Junger M, Mayerle J, Kraft M, Lerch MM, Dorr M, Reffelmann T, Empen K, Felix SB, Obst A, Koch B, Glaser S, Ewert R, Fietze I, Penzel T, Doren M, Rathmann W, Haerting J, Hannemann M, Ropcke J, Schminke U, Jurgens C, Tost F, Rettig R, Kors JA, Ungerer S, Hegenscheid K, Kuhn JP, Kuhn J, Hosten N, Puls R, Henke J, Gloger O, Teumer A, Homuth G, Volker U, Schwahn C, Holtfreter B, Polzer I, Kohlmann T, Grabe HJ, Rosskopf D, Kroemer HK, Kocher T, Biffar R, John U, Hoffmann W. Cohort profile: the study of health in Pomerania. Int J Epidemiol. 2011;40:294–307. doi: 10.1093/ije/dyp394. [DOI] [PubMed] [Google Scholar]
Associated Data
This section collects any data citations, data availability statements, or supplementary materials included in this article.


