

Abstract
Pre-mRNA splicing is accomplished by the spliceosome, a megadalton complex that assembles de novo on each intron. Because spliceosome assembly and catalysis occur cotranscriptionally, we hypothesized that introns are removed in the order of their transcription in genomes dominated by constitutive splicing. Remarkably little is known about splicing order and the regulatory potential of nascent transcript remodeling by splicing, due to the limitations of existing methods that focus on analysis of mature splicing products (mRNAs) rather than substrates and intermediates. Here, we overcome this obstacle through long-read RNA sequencing of nascent, multi-intron transcripts in the fission yeast Schizosaccharomyces pombe. Most multi-intron transcripts were fully spliced, consistent with rapid cotranscriptional splicing. However, an unexpectedly high proportion of transcripts were either fully spliced or fully unspliced, suggesting that splicing of any given intron is dependent on the splicing status of other introns in the transcript. Supporting this, mild inhibition of splicing by a temperature-sensitive mutation in prp2, the homolog of vertebrate U2AF65, increased the frequency of fully unspliced transcripts. Importantly, fully unspliced transcripts displayed transcriptional read-through at the polyA site and were degraded cotranscriptionally by the nuclear exosome. Finally, we show that cellular mRNA levels were reduced in genes with a high number of unspliced nascent transcripts during caffeine treatment, showing regulatory significance of cotranscriptional splicing. Therefore, overall splicing of individual nascent transcripts, 3′ end formation, and mRNA half-life depend on the splicing status of neighboring introns, suggesting crosstalk among spliceosomes and the polyA cleavage machinery during transcription elongation.
Pre-mRNA splicing results in excision of introns and ligation of exons to produce mature mRNA. The two-step transesterification reaction involving the 5′ and 3′ splice sites (5′ and 3′ SSs) and the branch point sequence (BPS) is catalyzed by the spliceosome, which assembles de novo on each intron (Wahl et al. 2009). Global short-read sequencing (RNA-seq) of nascent RNA from yeast to human has revealed that most introns are removed from pre-mRNA during transcription by RNA polymerase II (Pol II) (Brugiolo et al. 2013). Therefore, spliceosome assembly and splicing occur on nascent RNA and are closely connected to other processes shaping mRNA expression, from the transcription process itself to 5′ end capping, 3′ end cleavage, and mRNA decay (Bentley 2014; Herzel et al. 2017). Moreover, splicing and transcription can influence one another to yield splicing-dependent transcriptional pausing and determine alternative splicing patterns (Schor et al. 2013; Dujardin et al. 2014; Fong et al. 2014; Saldi et al. 2016). The mechanisms underlying coordination between RNA processing and transcription are being intensely investigated.
Recent efforts have focused on determining the in vivo dynamics of gene expression in multiple species and biological contexts, providing insight into the coordination between splicing and transcription. For example, transcripts with unspliced introns can be retained in the nucleus, suggesting that regulation of splicing rates can promote particular gene expression programs (Bhatt et al. 2012; Boutz et al. 2015; Wong et al. 2016). Over the past 10 years, numerous studies have employed live cell imaging, metabolic labeling, and analysis of nascent RNA to determine in vivo splicing rates, which vary according to method and species (Alpert et al. 2017). The core spliceosome itself is highly conserved (Fabrizio et al. 2009), yet, the length of introns, their SS and BPS diversity, and intron number per gene increase with the complexity of the organism. Typical human genes contain eight introns (Sakharkar et al. 2005), which are 10 times longer than the ∼150-nt-long exons (Zhang 1998), increasing cellular demands for splicing machinery and generating vast potential for alternative splicing (Lee and Rio 2015). These features are likely key determinants of splicing kinetics in vivo.
The observed high frequency of cotranscriptional splicing in Saccharomyces cerevisiae suggests efficient spliceosome assembly (Alexander et al. 2010; Carrillo Oesterreich et al. 2010; Barrass et al. 2015; Wallace and Beggs 2017). Recently, our lab used two single molecule RNA sequencing methods to analyze the position of Pol II when exon ligation occurs (Carrillo Oesterreich et al. 2016). We found that 50% of splicing events are complete when Pol II is only 45 nucleotides (nt) downstream from 3′ SSs, indicating that the spliceosome is physically close to Pol II during catalysis. This raises the important question of how splicing is achieved in an organism that, unlike budding yeast, has multi-intron genes. If splicing occurs as rapidly in multi-intron genes as in single intron budding yeast genes, introns would be spliced in the order of their transcription. The extent to which transcription determines the temporal order of intron removal is currently unknown due to a lack of methods that detect the order of intron removal in nascent RNA.
Here, we address cotranscriptional splicing efficiency and the possibility that rapid splicing imposes order on intron removal—from first to last intron as transcription proceeds—in Schizosaccharomyces pombe, where >1200 protein-coding genes have multiple introns. The S. pombe splicing machinery is more similar to higher eukaryotes than to S. cerevisiae (Kaufer and Potashkin 2000), while splicing rates are similar to those reported in S. cerevisiae (Alexander et al. 2010; Barrass et al. 2015; Carrillo Oesterreich et al. 2016; Eser et al. 2016). S. pombe introns are very short, with a median length of 56 nt, whereas exon lengths are similar to higher eukaryotes, with an internal exon length median of 137 nt (Kupfer et al. 2004; Herzel 2015). This gene architecture is consistent with an intron definition mechanism in S. pombe (Romfo et al. 2000; Shao et al. 2012; Fair and Pleiss 2017), in which the 5′ and 3′ SSs are brought together across the intron by the U1 and U2 small nuclear ribonucleoproteins (snRNPs). Taken together, these features suggest that splicing of individual introns in multi-intron transcripts may occur independently of one another in S. pombe. To globally investigate the progression of splicing during transcription, nascent RNA (nRNA) prepared from proliferating S. pombe cells was analyzed by both short- and long-read sequencing (LRS). We report an unexpected coordination between splicing of neighboring introns and polyA site cleavage.
Results
Proteomic and transcriptomic characterization of S. pombe chromatin
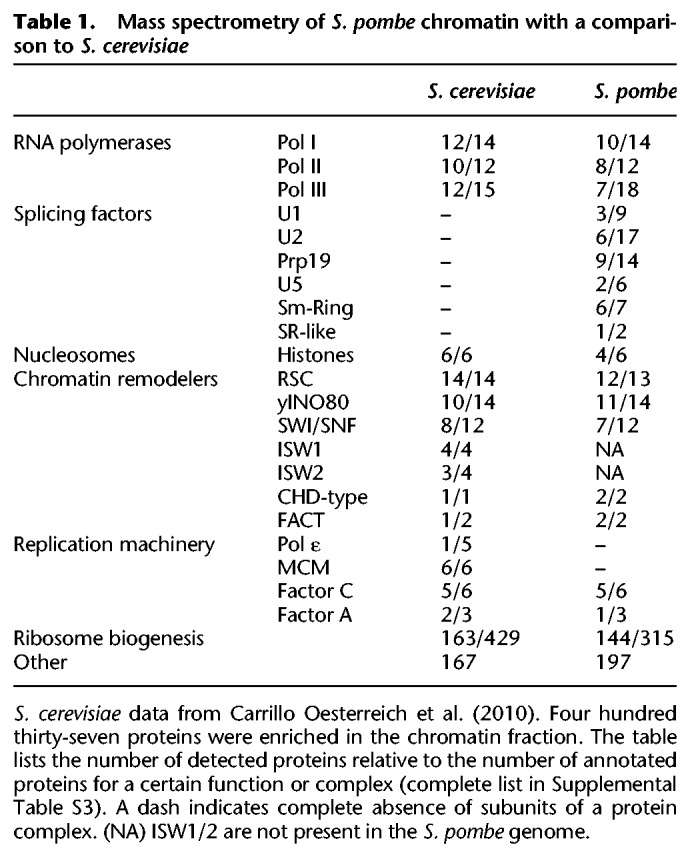
To isolate nRNA, S. pombe chromatin was purified and analyzed for RNA and protein composition (Fig. 1A). After fractionation into cytoplasm and nuclei, nuclei were further separated into chromatin and nucleoplasmic fractions. Electrophoresis of nucleic acids, Western blot analysis, and mass spectrometry were used to evaluate the fractionation, showing enrichment of chromatin-associated proteins and genomic DNA and depletion of rRNA in the chromatin fraction (Fig. 1B; Table 1; Supplemental Tables S1B,C, S3). To enrich for nascent protein-coding transcripts, RNA purified from the chromatin fraction was further depleted of poly(A)+ RNA and rRNA, using bead-based negative selection (Fig. 1A; Supplemental Fig. S1). Three biological replicates of this nRNA and cytoplasmic mRNA were prepared for RNA-seq on the Illumina platform (Supplemental Table S4). As expected, introns and regions downstream from genes showed higher signal coverage in nRNA than in mRNA (Fig. 1C).
Figure 1.
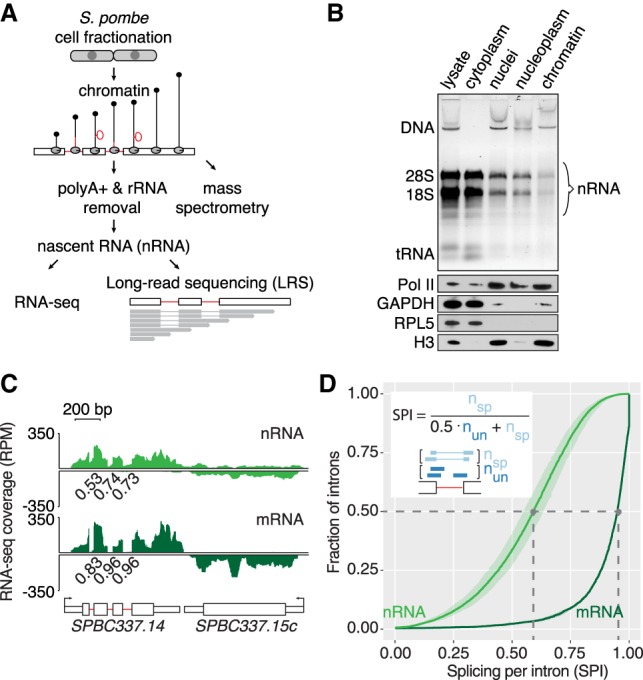
Transcriptome analysis of S. pombe chromatin reveals cotranscriptional splicing activity. (A) Schematic of nascent RNA (nRNA) purification from chromatin for short- (RNA-seq) and long-read RNA sequencing (LRS). (B) Enrichment of genomic DNA (DNA) and nRNA in the chromatin fraction and depletion of rRNA (18S and 28S) and tRNA revealed by gel electrophoresis and staining with GelStar (Lonza). Western blot analysis with antibodies specific for chromatin-associated proteins Pol II and Histone 3 (H3) and cytoplasmic marker proteins GAPDH and RPL5. (C) Nascent and mRNA-seq read coverage (RPM) over a three-intron gene and a convergent intronless gene. The pooled coverage from three biological replicates for each cellular fraction is shown. To assess splicing levels in nRNA and mRNA, splicing per intron (SPI) was calculated from intron junction reads (Herzel and Neugebauer 2015). SPI values are shown for these representative introns underneath the RNA-seq coverage track. (D) Cumulative SPI distribution for S. pombe introns (nRNA, n = 4481 introns; mRNA, n = 2181). Mean values (line) with standard deviation (shading) are shown for three biological replicates. Gray dashed lines indicate the median splicing levels in the two populations (nRNA 0.59, mRNA 0.95). The inset shows how the SPI is calculated from the number of “spliced” and “unspliced” junction reads spanning a particular intron.
Table 1.
Mass spectrometry of S. pombe chromatin with a comparison to S. cerevisiae
To determine the fraction of spliced introns in nRNA and mRNA, we quantified splicing per intron (SPI) values using the fraction of spliced junction reads compared to all junction reads of a particular intron for the majority of introns (4481) in the S. pombe genome (Fig. 1C,D; Supplemental Fig. S2A; Supplemental Table S6; Herzel and Neugebauer 2015). An SPI of 1 reflects 100% splicing and an SPI of 0, no splicing of the respective intron. The SPI distribution median for nRNA was 0.59 and for mRNA 0.95. Hence, 50% of introns were ≥59% spliced in our nRNA data set. We validated our splicing quantification for 33 introns by semiquantitative RT-PCR (R = 0.7) (Supplemental Fig. S2B; Supplemental Methods; Supplemental Tables S2, S7). We conclude that S. pombe nRNA-seq accurately quantifies cotranscriptional splicing levels for individual introns in the S. pombe genome.
A multitude of intron-specific features correlate with nascent RNA splicing levels
We sought to correlate individual nRNA splicing efficiencies with gene- and intron-specific features. Global nRNA splicing levels differed according to the relative distance to the transcript start and end, generally showing higher splicing for internal introns (Fig. 2A). The group of single, first, and last introns were less efficiently spliced than internal introns, which showed similar SPIs independent of their position (median SPI 0.62). This trend was also detected in cytoplasmic mRNA (Fig. 2B), indicating that at least some incompletely spliced transcripts can be exported from the nucleus. To test if first introns show generally lower splicing in individual genes, the difference between SPIs of adjacent introns was calculated (SPI of 5′ intron − SPI of 3′ intron). Twenty-five percent of intron pairs showed significant differences in splicing levels (Fig. 2C). Consistent with the earlier observation of lower first intron splicing, 176 first introns were spliced less (52% of 5′ less group) and only 73 were spliced more (27% of 5′ more group) than the second intron. Next, we compared 42 intron features, e.g., RNA-seq coverage, splice sites, and exon and intron length, between the more and less frequently spliced introns in the pairs with significant splicing differences (see Supplemental Methods; Supplemental Tables S6, S9 for a complete overview of intron features). Fifteen features, e.g., cytoplasmic mRNA-seq intron coverage, 5′ SS and BPS strength, and mRNA expression, were significantly associated with low or high splicing (Fig. 2D; Supplemental Figs. S2C, S3). We conclude that first, last, and single introns tend to be less cotranscriptionally spliced than internal introns.
Figure 2.

Pre-mRNA features that correlate with the extent of cotranscriptional splicing. (A) Cotranscriptional splicing levels differ based on gene position. The box plot shows the distribution of nRNA SPIs for the group of single intron genes and first, internal (second, third, and other), or last introns in multi-intron genes. The box width corresponds to the respective group size. (B) mRNA splicing levels differ between introns in different gene positions. Analogous data representation as in A. (C) One quarter of introns are significantly less or more spliced than the next downstream (3′) intron in nRNA, as depicted in a volcano plot (three biological replicates). (D) 15/42 analyzed gene architecture features correlate significantly with differentially spliced intron pairs (sequence-based in black font and RNA-seq-derived in gray font). The smaller intron position for “low” spliced introns in a pair (first intron – 1, second intron – 2, etc.) is consistent with enrichment of first introns in the “5′ less spliced” group. The median modified Z-score is shown for each feature with significant difference between the “low” and “high” groups, and the respective negative log10 of the Bonferroni-corrected P-value is given. For two features, no change in the median modified Z-score is visible. The respective feature distribution is presented as a box plot below. Asterisks indicate significance of direct neighbors according to the Wilcoxon rank-sum test: (*) P < 0.05, (**) P < 0.01, (***) P < 0.001, (****) P < 0.0001 after Bonferroni-correction, in A, B, and D.
Full-length nascent RNA sequencing of multi-intron transcripts
To assess the order of intron removal directly, nRNA was converted into double-stranded cDNA for long-read sequencing on the Pacific Biosciences platform. A DNA adaptor with five random nucleotides at the 5′ end was ligated to the 3′ end of all nascent RNAs. This diminishes possible ligation biases from specific 3′ nucleotides and preserves single molecule information (Zhuang et al. 2012; Herzel 2015; Mayer et al. 2015). Template-switching reverse transcription enabled the generation of full-length double-stranded cDNA by PCR, by attaching a universal sequence to the 5′ end (Supplemental Fig. S4). A total of eight SMRT cells yielded 169,000 high-quality, nonpolyadenylated, full-length nRNA transcripts from two biological replicates (Supplemental Methods; Supplemental Fig. S4C–G; Supplemental Table S4). Of these, 21% mapped to intron-containing genes with a median of seven transcripts per gene. Transcript counts per gene correlated well with expression data from nRNA-seq (Supplemental Fig. S4F).
Full-length transcript sequence informs on the history of transcription and splicing of every RNA molecule. Nine examples of full-length nascent transcripts from multi-intron genes are shown in Figure 3A. Most transcript 5′ ends mapped close to the annotated TSS or to well-defined positions downstream from the existing annotation (e.g., SPAC16E8.15). 3′ ends correspond to the nucleotide position of elongating Pol II at the time of cell lysis. As seen previously for single intron nRNAs, introns were often absent when Pol II was positioned just downstream from the intron (Fig. 3A; Supplemental Fig. S4H; Carrillo Oesterreich et al. 2016). To evaluate the order of intron removal, it was necessary to identify partially spliced transcripts. Transcripts overlapping multiple introns were classified as “all spliced” if all introns were removed, as “all unspliced” if all introns were present, or as “partially spliced” if some but not all of the introns were spliced (see Fig. 3A).
Figure 3.

Single molecule long-read sequencing reveals predominantly “all or none” splicing of multi-intron transcripts. (A) Full-length transcripts mapping to nine genes with more than one intron are aligned underneath each gene diagram and color-coded according to their splicing profile. Thin lines in transcripts indicate that the intron sequence is absent (due to splicing). Transcripts overlapping with <2 introns (“others,” gray) cannot be used to analyze the order of intron splicing. The inset shows five transcripts of gene SPBC428.01c, highlighting two subclasses of partially spliced transcripts and that transcript 3′ ends refer to Pol II position. (B) All unspliced, all spliced, and partially spliced fraction in the transcriptome. The large pie chart shows the proportion of the three splicing categories from nRNA LRS. The small pie chart depicts the fraction of partially spliced transcripts, which show intron removal “in order” (all introns are spliced upstream of an unspliced intron in a particular transcript; compare zoom-in of SPBC428.01c in A), “not in order” (at least one intron is unspliced upstream of a spliced intron in a particular transcript), or a mixed pattern (compare inset of SPBC428.01c in A).
A comparison of the partially spliced transcripts identified by LRS to our nRNA-seq data showed a highly significant overlap between data sets (P-value = 4 × 10⁻⁸, Fisher's exact test) (Supplemental Fig. S5A). To analyze partial splicing patterns with respect to the direction of transcription, each partially spliced transcript was classified as “in order” if unspliced introns occurred only downstream from spliced introns, “not in order” if at least one unspliced intron was followed by at least one spliced intron, or “mixed” if the transcript contained one or more unspliced intron(s) both upstream of and downstream from a spliced intron (Fig. 3B). Thus, “mixed” transcripts combine both “in order” and “not in order” splicing. The fraction of “in order” and “not in order” transcripts was similar, suggesting that ordered intron removal is not strictly enforced. Unspliced introns displayed low SPIs calculated from the nRNA-seq data, reduced 5′ SS and BPS strength, and were also associated with higher RNA-seq coverage in our cytoplasmic mRNA-seq data set (Supplemental Fig. S5B). Comparison of our nRNA LRS and published mRNA LRS data showed a decrease of partially spliced transcripts to 43% from nRNA to mRNA (Supplemental Fig. S5C), indicating that a substantial fraction of partially spliced transcripts will be stable, polyadenylated, cytoplasmic mRNAs that likely represent alternative mRNA isoforms in S. pombe (Kuang et al. 2017). In conclusion, LRS of nascent transcripts provides a snapshot of splicing states for multi-intron transcripts. The subcategory of partially spliced transcripts recapitulates the splicing differences seen by nRNA-seq and carries signatures of gene-specific intron retention.
‘All or none’ splicing of single transcripts predominates
The number of partially spliced transcripts (697) for the above analysis of splicing order was surprisingly small. This caused us to consider how many partially spliced transcripts would be expected from our data set. Given that each spliceosome assembles anew on every intron in each transcript and that S. pombe introns are mainly defined by intron definition, we had expected that pre-mRNA splicing events of neighboring introns would be independent of one another. This is illustrated in a prediction for all expressed S. pombe intron-containing genes with more than one intron (Fig. 4A), utilizing the intron splicing frequencies from our nascent RNA-seq data. In this scenario, 81% of transcripts would be either partially or completely spliced. This prediction was not recapitulated by our LRS data, in which 84% of transcripts were either completely spliced or unspliced. Only 16% of transcripts were partially spliced, 2.8 times less than expected if splicing of adjacent introns were independent of each other (Fig. 4A).
Figure 4.
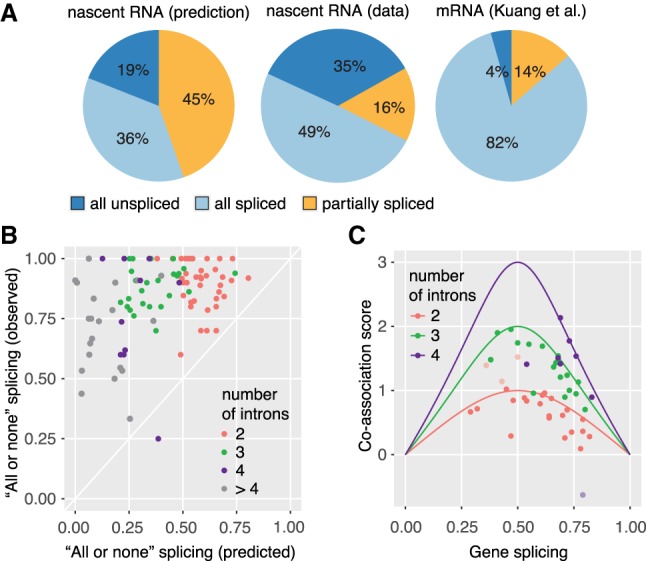
High degree of splicing co-association in multi-intron transcripts. (A) Predicted and observed “all unspliced,” “all spliced,” and “partially spliced” fractions in the transcriptome. Left panel: Prediction of splicing categories from nRNA-seq, assuming each intron is spliced independently of neighbors. Predicted values were calculated for the first two introns of genes with two and more introns for nRNA. Middle panel: Proportion of the three splicing categories from nRNA LRS as in Figure 3B. Right panel: Proportion of the three splicing categories from total mRNA LRS (data from Kuang et al. 2017). (B) Predominant “all or none” splicing in multi-intron genes. The predicted fraction of “all or none” splicing (fraction of all spliced or unspliced transcripts calculated from nRNA-seq, assuming splicing independence) is plotted against the observed fraction of “all or none” splicing for 100 genes with 10 or more LRS transcripts. (C) Co-association of splicing is close to the maximal possible co-association value. A co-association score was calculated as the log2-fold change of the observed (LRS) to predicted (RNA-seq) fraction of “all or none” splicing. The maximal possible co-association score for 2-, 3-, and 4-intron genes was calculated [log2(1/gene splicing)] and plotted versus the mean gene splicing value (solid line). Co-association scores for individual genes fall below or on top of this line, suggesting maximal co-association for most genes (median 86%, calculated as the ratio of the observed co-association score over the maximal co-association score at a particular gene splicing). Outliers are indicated as lighter points and can be explained by inconsistencies in gene annotation.
To challenge the robustness of this unexpected finding, a similar analysis was carried out on a gene-by-gene basis for 100 genes with 10 or more transcripts spanning multiple introns. For 99 of those genes, the observed fraction of “all or none” splicing was greater than the predicted fraction (Fig. 4B). To estimate the degree of co-association between individual splicing events, we calculated a co-association score defined as the log2-fold change of the observed and predicted fraction of “all or none” transcripts (Fig. 4C; Supplemental Fig. S5E). Note that the maximal co-association score increases with increasing intron number (Supplemental Fig. S5F). Most genes had co-association scores close to the maximal possible score (Fig. 4C; Supplemental Fig. S5G). This quantification shows that partial transcript splicing is the exception in S. pombe. Furthermore, each gene's tendency for co-association is not influenced by the number of introns (Supplemental Fig. S5G). Here, the combined analysis of short- and long-read nRNA sequencing data enabled us to distinguish between completely spliced RNAs, RNAs with retained introns, or completely unspliced RNAs. The analysis reveals that if splicing occurs, it will occur quickly and may stimulate splicing of downstream introns. If splicing does not occur quickly, subsequent introns tend to be retained. This apparent “all or none” splicing of individual transcripts was completely unexpected.
Mild global splicing inhibition increases ‘all unspliced’ transcripts
The above findings suggest that an unspliced intron might negatively impact the splicing of neighboring introns within the same transcript. To test this hypothesis, we profiled cotranscriptional splicing in the mutant prp2-1 strain in which splicing levels are reduced after 2 h at the nonpermissive temperature (Fig. 5A; Supplemental Fig. S6A,B; Sridharan et al. 2011; Lipp et al. 2015). Consistent with the role of prp2 (the homolog of mammalian U2AF65) in 3′ SS recognition, splicing levels were reduced by half in prp2-1 (Fig. 5B,C), while global differences in transcription were not detected (Supplemental Fig. S6E). LRS was performed on nRNA in three biological replicates from prp2-1 and WT cells, showing that the proportion of “all unspliced” transcripts increased from 40% to 59% in prp2-1 with only minor changes in the fraction of “partially spliced” transcripts (Fig. 5B,D). This proportionate increase in “all unspliced” transcripts is consistent with proposed negative cooperativity among unspliced introns (Supplemental Fig. S6C). Finally, we reasoned that if unspliced transcripts were predominantly degraded, the relatively mild inhibition of cotranscriptional splicing by prp2-1 should specifically reduce mRNA levels for intron-containing genes. Indeed, reanalysis of prp2-1 and WT mRNA expression data (Lipp et al. 2015) showed stronger down-regulation of mRNA levels for intron-containing genes than intronless genes in prp2-1 (Fig. 5E). Thus, increased levels of “all unspliced” nascent transcripts in prp2-1 is consistent with a pervasive inhibitory effect on the splicing of the other introns in the same transcript and with accompanying destabilization of mRNAs that failed to undergo splicing.
Figure 5.

Inhibition of pre-mRNA splicing increases “all unspliced” nascent transcripts and reduces mRNA levels. (A) Left panel: Schematic of the workflow in the temperature-sensitive prp2-1 mutant and WT strains at nonpermissive temperatures. Right panel: RT-PCR shows increased levels of unspliced nascent RNA in the prp2-1 mutant after 2 h of growth at 37°C for two introns compared to the WT 972h- strain. −RT control was loaded in lanes (empty) adjacent to the +RT samples. (B) Nascent RNA WT and prp2-1 LRS read coverage over two genes. (C) Bar plot indicating splicing frequency for single intron genes in prp2-1 relative to WT at 37°C calculated from LRS data. The standard deviation from three biological replicates is given, and asterisks indicate significance according to the Student's t-test ([***] P < 0.001). (D) Comparison of the “all unspliced,” “all spliced,” and “partially spliced” fractions in the transcriptome in WT and prp2-1. (E) Reduced mRNA levels for intron-containing genes compared to intronless genes in prp2-1 at 37°C. Cumulative distribution of expression changes between prp2-1 mutant and WT for intron-containing and intronless genes (data from three replicates from Lipp et al. 2015; P-value from Kolmogorov–Smirnov test between intronless and intron-containing group).
Failure to splice cotranscriptionally reduces cytoplasmic mRNA levels
Down-regulation of mRNA levels caused by degradation of unspliced pre-mRNAs suggests a possible mechanism for fine-tuning gene expression through changes in cotranscriptional splicing efficiency. To determine whether this could be globally physiological, genes were grouped into two classes following nRNA- and mRNA-seq expression quantification using Cufflinks (Trapnell et al. 2010): (1) genes with mRNA levels lower than nRNA levels; and (2) genes with mRNA levels higher than or similar to nRNA levels. Higher mRNA levels than nRNA levels can arise in cases where the mRNA half-life is long (Supplemental Fig. S6F). Identical mRNA and nRNA levels would suggest that transcription levels define mRNA expression. In contrast, if mRNA levels were lower than nRNA levels, RNA decay must have reduced the fraction of mRNA. For group 1 genes, the average pre-mRNA splicing levels were significantly lower than for group 2 genes, consistent with a contribution from unspliced RNAs to establishing mRNA expression levels (Fig. 6A).
Figure 6.

Cotranscriptional splicing correlates with higher mRNA levels. (A) Box plot of nRNA and mRNA gene splicing levels after grouping according to cytoplasmic mRNA levels relative to nRNA levels ([***] P < 0.001, Wilcoxon rank-sum test). (B) Experimental outline to induce changes in gene expression upon caffeine treatment in S. pombe cells. (C) Correlation of mRNA expression values between the two conditions identifies 1477 differentially expressed genes (FDR-adjusted P-value < 0.05, FDR ≤0.05; 566 of those are intron-containing). (D) Cumulative distribution of nRNA gene splicing differences between caffeine treatment and control. Only genes without significant changes in nRNA levels but significant differences in mRNA expression were considered ([****] P < 0.0001, Kolmogorov–Smirnov test between “mRNA expression up” [n = 52] and “mRNA expression down” [n = 65] group).
Next, we used caffeine treatment to shift gene expression programs through physiologically relevant cell signaling. Exponentially growing S. pombe cells were treated with 10 mM caffeine for 15 min (Fig. 6B), which elicits a cellular response similar to nitrogen starvation (Rallis and Bahler 2013). Gene expression and splicing profiles were quantified by nRNA-seq and cytoplasmic mRNA-seq in three biological replicates. In agreement with the previous study, ∼1500 mRNAs changed levels significantly after treatment (Fig. 6C; Supplemental Fig. S7A). No significant global splicing changes were detected by meta-analysis (Supplemental Fig. S7B). However, potential changes in transcription could cancel out effects on splicing. To determine if cotranscriptional splicing levels alone correlate with mRNA levels, we identified genes among the up- and down-regulated mRNAs whose nascent RNA levels did not change with treatment; in that group, significantly lower cotranscriptional splicing frequencies were observed for the down-regulated mRNAs only (Fig. 6D), showing that failure to splice cotranscriptionally lowers gene expression.
Coordination of splicing status, polyA site cleavage, and nuclear degradation
Known links between splicing and downstream RNA processing events (Herzel et al. 2017) led us to determine whether the persistence of unspliced introns impacts polyA site cleavage. Indeed, 574 genes in our WT data sets were associated with transcripts that contained unspliced introns and had 3′ ends located downstream from annotated polyA cleavage sites (Fig. 7A–C; Supplemental Table S8), indicative of transcriptional read-through. The majority of read-through transcripts were completely unspliced (Fig. 7B) and were validated by RT-PCR (Supplemental Fig. S8A). Conversely, 95% of polyadenylated transcripts were completely spliced (Supplemental Fig. S8D). The strong correlations between splicing and polyA cleavage and, conversely, between unspliced introns and transcriptional read-through suggest that polyA cleavage is faster for spliced transcripts than unspliced transcripts. Given our previous evidence that unspliced transcripts are preferentially degraded (see above), we postulated that unspliced, read-through transcripts might be degraded rather than further processed. Indeed, total RNA-seq data from a nuclear exosome subunit deletion strain (Δrrp6) showed a general increase in the prevalence of unspliced RNA and higher sequencing read coverage downstream from polyA sites (Fig. 7D; Supplemental Fig. S8B; Zhou et al. 2015). We validated the dramatic loss of unspliced, read-through transcripts through exosome-mediated degradation by RT-qPCR (Fig. 7E). These findings demonstrate that splicing cooperativity among introns extends to coordination with polyA site cleavage and mRNA stability or decay.
Figure 7.

Coupling between cotranscriptional splicing, polyA site cleavage, and mRNA stability. (A) Examples of intron-containing genes with unspliced transcripts extending over the polyA site. Black triangles mark the polyA cleavage sites. Full representation of all sequenced transcripts in Supplemental Figure S8B. (B) Pie charts reflecting the fraction of spliced and unspliced transcripts in single or multi-intron genes with 3′ ends either within the gene body or downstream from the polyA site cleavage site. (C) 3′ end profiles downstream from annotated polyA cleavage sites for different transcript classes. Data are binned in 20-nt intervals and normalized to the first bin (−20 nt – 0 nt from polyA cleavage site). (D) WT and Δrrp6 total RNA-seq read coverage over the same example gene as in A is shown (log-scale). Counts per nucleotide were normalized to library size. Data reanalyzed from Zhou et al. (2015). The inset zooms into the region downstream from the annotated polyA site. (E) Nascent transcript levels with 3′ ends extending over the polyA site are increased in the exosome mutant Δrrp6. RT-qPCR from Δrrp6 and WT strains confirmed higher levels of nascent RNA uncleaved at the polyA cleavage site, using qPCR primers to generate amplicons (black line above gene diagram) bridging (polyA) or downstream (post-polyA) from the polyA cleavage site (RT with random hexamers). SDs from four biological replicates are given. Asterisks indicate significance according to Student's t-test: (**) P < 0.01, (***) P < 0.001.
Discussion
Here, we have tested the prediction that rapid cotranscriptional splicing in S. pombe enforces the removal of introns in the order of their transcription. In depth analysis of nascent RNA by short- and long-read sequencing revealed that distinct populations of fully spliced, fully unspliced, and partially spliced nascent RNA are uniquely detectable by LRS. The preponderance of fully spliced nascent transcripts indicates that splicing proceeds rapidly and efficiently in the order of intron synthesis with few exceptions. Moreover, we show that fully unspliced nascent transcripts—the majority of unspliced introns—undergo read-through transcription and are degraded in the nucleus. This evidence provides new insights into cotranscriptional splicing. Specifically, bulk determinations by short-read RNA-seq yield cotranscriptional splicing efficiencies on a per intron basis, ranging from 45%–84% depending on the species and platform (Brugiolo et al. 2013; Herzel and Neugebauer 2015). It is generally assumed that remaining introns are post-transcriptionally spliced. Instead, our findings indicate that, at least in S. pombe, the majority of introns that are not spliced cotranscriptionally will be degraded. We demonstrate that degradation of unspliced RNA contributes significantly to shaping the transcriptome in response to cellular stimuli. This suggests that a specific mechanism(s) for crosstalk among spliceosomes and the polyA site cleavage machinery underlies cooperativity among neighboring introns, leading to “all or none” splicing of individual transcripts. These points are discussed below.
Our analysis highlights intensive chromatin-associated splicing activity in S. pombe. Mass spectrometry of the isolated chromatin fraction identified numerous splicing factors that were not detected in S. cerevisiae chromatin (Carrillo Oesterreich et al. 2010). This likely reflects the 10× higher number of intron-containing genes in the S. pombe genome and is consistent with cotranscriptional splicing and/or the retention of post-splicing intron lariat spliceosomes on chromatin (Chen et al. 2014). Analysis of splicing frequency on a per intron basis from nascent RNA-seq showed that most S. pombe introns are spliced cotranscriptionally (median 0.59), which is lower than in S. cerevisiae (median 0.74), Drosophila, or human cells (Brugiolo et al. 2013). Notably, 5% of mRNAs contain introns; recent studies suggest that translation of retained introns contributes to protein diversity in S. pombe (Duncan and Mata 2014; Kuang et al. 2017). Intron length is often associated with reduced cotranscriptional splicing (Brugiolo et al. 2013). However, we (see Fig. 2A; Supplemental Fig. S2C) and others (Eser et al. 2016; Burke et al. 2018) find that intron length is one of the few parameters that does not correlate with nascent RNA splicing frequency in S. pombe, while 5′ SS and BPS strength do. Low cotranscriptional splicing of first introns in S. pombe and other species suggests that the first intron can persist while downstream introns are spliced (Kessler et al. 1993; Khodor et al. 2011, 2012; Tilgner et al. 2012).
Full-length nascent transcript sequences reveal the life history of individual (pre-)mRNAs that cannot be inferred from conventional short-read sequencing. Long-read sequencing has been previously used to characterize full-length mRNA splicing products (Sharon et al. 2013; Kuang et al. 2017). Here, we used it to analyze full-length nascent transcripts—splicing substrates and intermediates—relative to the progression of transcription which is marked by nascent RNA 3′ ends. Full-length sequencing of individual nascent RNAs also enabled us to determine the fate of unspliced transcripts. Most often, unspliced nascent transcripts fail to undergo polyA site cleavage, leading to read-through transcription and RNA degradation by the nuclear exosome. Therefore, our data complement prior reports showing that unspliced transcripts are degraded in an rrp6-dependent manner (Bousquet-Antonelli et al. 2000; Bitton et al. 2015; Zhou et al. 2015; Kilchert et al. 2016). Our work does not exclude the action of additional degradation pathways for unspliced transcripts, like the nuclear 5′–3′ exonuclease Dhp1/Rat1/Xrn2 and cytoplasmic nonsense-mediated decay (Vargas et al. 2011; Davidson et al. 2012; Girard et al. 2012; Kervestin and Jacobson 2012; Brogna et al. 2016; Kilchert et al. 2016). Although higher coverage will be required to investigate Pol II dynamics, LRS of nascent RNA represents an additional powerful approach for investigating RNA processing from synthesis to decay.
Physical interactions have been detected between spliceosomal components and the nuclear decay machinery to provide a layer of surveillance based on splicing fidelity (Nag and Steitz 2012; Zhou et al. 2015; Herzel et al. 2017). Our findings suggest that these interactions take place cotranscriptionally, explaining why poor cotranscriptional splicing upon caffeine treatment (this study) correlates with lowered mRNA levels independent of transcriptional changes and possibly why splicing levels within mRNA correlate with expression levels (Wilhelm et al. 2008). An increased mRNA half-life was observed in vitro when splicing occurred in a transcription-coupled system (Hicks et al. 2006). Thus, cooperativity could drive splicing to completion, allowing fully spliced transcripts to evade decay. Conversely, fully unspliced transcripts might be degraded more efficiently. Perhaps these transcripts arise during the process of shutting down gene expression. For example, read-through transcription and inhibition of splicing can occur during mitosis, cellular senescence, and/or under conditions of cellular stress (Leong et al. 2014; Shalgi et al. 2014; Muniz et al. 2017; Vilborg et al. 2017), and these transcripts are remarkably short lived. Taken together, the link between cotranscriptional splicing and mRNA half-life is likely an important determinant of mRNA levels.
Is cooperativity among splicing events widespread? We found that a single spliced or unspliced intron can mediate positive and negative effects on the splicing of other introns within the transcript. Our results in vivo are completely consistent with previous in vitro experiments showing that splicing of multi-intron transcripts is more efficient following an initial intron removal event (Crabb et al. 2010). In S. cerevisiae, constitutive splicing of the two-intron SUS1 gene has been found to occur cooperatively (Bonde et al. 2014). Co-association, the likelihood that distinct splicing events are correlated, has been detected for multiple alternative splicing events in human cells, C. elegans, and S. pombe (Fededa et al. 2005; Glauser et al. 2011; Tilgner et al. 2015, 2018; Kuang et al. 2017). A recent study concluded that splicing is regulated by adjacent processing events, based on the deduced order of intron removal from human paired-end RNA-seq (Kim et al. 2017). In the context of alternative cassette exons, upstream intron removal can be delayed relative to a downstream intron, although it may already be committed to splicing (de la Mata et al. 2010; Kim et al. 2017). Thus, this underappreciated phenomenon of splicing co-association has been observed in multiple species in total RNA. Here, it is extended to full-length nascent RNA, detecting intermediate states in RNA processing before and after splicing and enabling further mechanistic insights into how crosstalk is mediated.
Cooperativity among splicing events and with polyA cleavage likely occurs at the level of assembling spliceosomes. High local concentrations of splicing factors at sites of active transcription might promote splicing when the splicing machinery is at nonsaturating levels or in competition with RNA decay (Crabb et al. 2010; Marguerat et al. 2012; Munding et al. 2013). Similarly, cellular concentration of polyadenylation factors has been linked to coupled alternative polyadenylation and splicing (Movassat et al. 2016). Additional features contributing to cooperativity may include the local chromatin environment and/or changes in Pol II (Gunderson and Johnson 2009; Gunderson et al. 2011; Patrick et al. 2015; Milligan et al. 2017; Neves et al. 2017; Nissen et al. 2017). An EM tomography study of the Balbiani ring 3 gene containing 38 introns suggested that only one spliceosome may associate with each nascent RNA at any given time (Wetterberg et al. 2001). While this remains to be tested in other systems, spliceosomal components can remain associated with multi-intron pre-mRNAs during splicing (Crabb et al. 2010; de la Mata et al. 2010). This would be consistent with the possibility that the presence of prespliceosomal components, assembling spliceosomes, or remaining spliceosomal components after splicing may enhance or antagonize cooperativity among introns (Huang et al. 2002; Crabb et al. 2010; Chen et al. 2014). In mammalian cells, U2AF interacts directly with the polyA cleavage machinery (Vagner et al. 2000; Millevoi et al. 2006), while U1 snRNP interactions with nascent RNA—particularly in first introns—suppress premature polyA cleavage, prevent polyadenylation, and enhance transcription elongation through the gene's entirety (Gunderson et al. 1998; Berg et al. 2012; Park and Hannenhalli 2015; Oh et al. 2017; Chiu et al. 2018). Perhaps U1 snRNP lingering on unspliced introns promotes elongation and inhibits cleavage at correct polyA sites, producing read-through transcription. The overrepresentation of unspliced first introns in all organisms tested leads us to speculate that splicing of the first intron represents a tipping point in a transcript-specific decision of whether to proceed with transcription, splicing, and 3′ end formation.
Methods
S. pombe strains, genome version, and annotation
For strain information, refer to Supplemental Table S1. S. pombe genome version EF2 (http://goo.gl/PuaBni) and gene annotation ASM294v2.31 were used (Supplemental Table S5; Eser et al. 2016).
RNA preparation
Nascent RNA was prepared as described (Carrillo Oesterreich et al. 2016) and used for nascent RNA sequencing and long-read sequencing (Supplemental Methods). Poly(A)− RNA was obtained using oligo(dT)-coated magnetic beads binding to poly(A)+ RNA (Dynabeads mRNA DIRECT Micro Purification kit, Life Technologies). rRNA was removed from ∼5 µg chromatin-associated poly(A)− RNA using the Ribo-Zero Gold rRNA Removal kit (Yeast) from Epicentre/Illumina.
Short-read RNA sequencing
For RNA-seq of different cellular fractions, RNA samples were submitted to the Yale Center for Genome Analysis (YCGA). Poly(A)+ RNA-depleted, rRNA-depleted nascent RNA, and cytoplasmic poly(A)+ RNA were analyzed by single-end RNA-seq with 76-bp read length. Random hexamer primed Illumina libraries were prepared with standard protocols.
Mapping short-read RNA-seq data to the S. pombe genome
Data were mapped to the genome with TopHat2 (version 2.0.12) (Kim et al. 2013). RNA-seq coverage was adjusted for library size, excluding reads mapped to rDNA regions, weighted using the R-package edgeR (Robinson et al. 2010). To determine gene expression values between replicates and different samples, Cufflinks version 2.2.1 (Trapnell et al. 2010) and Cuffdiff were used.
Intron splicing quantification
For intron splicing calculation, junction reads originating from spliced and unspliced transcripts were extracted from all mapped reads and matched with annotated introns using BEDTools intersect (version 2.20.1) (Quinlan and Hall 2010). The sum of all split reads per 5′ SS was divided by the sum of the 5′ SSs split read count and the average of unsplit reads over 5′ and 3′ SSs per intron. This resulted in a splicing score (splicing per intron) ranging from 0 to 1, with 1 being 100% spliced (Herzel and Neugebauer 2015). A cutoff of at least 10 reads per junction to report an SPI was applied.
3′ end ligation and long-read sequencing library preparation
3′ end ligation and long-read sequencing library preparation of poly(A)+ and rRNA-depleted, chromatin-associated RNA was done as described previously (Carrillo Oesterreich et al. 2016). Sample-specific barcodes were included in the PCR oligonucleotides (Supplemental Table S2) for the three prp2-1 cDNA libraries and the corresponding 972h- cDNA libraries. Double-stranded cDNA (>1 µg) was submitted to the Yale Center for Genomic Analysis for Pacific Biosciences library preparation and sequencing with standard protocols (SMRTbell Template Prep kit 1.0). Sequencing was done with either diffusion- or magbead-loading (further details in Supplemental Methods).
Long-read sequencing data processing and mapping
3′ end linker sequences, Clontech adaptor sequences (SMARTer cDNA synthesis kit, Clontech), and the 5-nt random 3′ barcode were removed with cutadapt (Martin 2011) and the FASTX-Toolkit (http://hannonlab.cshl.edu/fastx_toolkit/index.html). Processed reads were mapped to the respective genome using GMAP (Wu and Watanabe 2005). To remove potential mRNA contaminants, reads ending within ±100 nt of an annotated polyA site and short poly(A) tails (>4 nt) were removed from the data set.
Classification of multi-intron transcripts
Reads overlapping completely with multiple introns were considered multi-intron transcripts. If the number of exons in a read was identical to the number of overlapping introns + 1, a read was considered to be “all spliced.” If the block count was 1 irrespective of the number of overlapping introns, a read was considered to be “all unspliced.” Reads which had a block count > 1 but fewer block counts than the number of overlapping introns + 1 were classified as “partially spliced” (further details in Supplemental Methods).
Prediction of transcript splicing status from nRNA-seq
To determine the expectation of the abundance of partially spliced transcripts, in the case that individual intron splicing is independent of each other, we assume that the SPI, calculated from short-read RNA-seq, reflects the probability of splicing of a particular intron in the chromatin fraction at steady state. Further, we assume that the gene expression values from nRNA-seq reflect an estimate of relative transcript number per gene in the chromatin fraction at steady state. For each intron, “spliced” or “unspliced” sampling with replacement was performed according to its SPI and the average transcript number per gene. Simulated data were combined into a matrix with columns representing each intron and rows representing each transcript. If a row contained both “spliced” and “unspliced” column entries, it was classified as “partially spliced.” If a row contained only “spliced” or only “unspliced” column entries, it was classified as “all spliced” or “all unspliced,” respectively. In the gene-specific analysis, a numerical solution using SPIs as splicing probability was calculated (Supplemental Methods). From the gene-specific observed and predicted fraction of “all or none” splicing, we calculated a co-association score, which we define as the log2-ratio between the observed and predicted fraction of “all or none” splicing.
Data access
The sequencing data from this study have been submitted to the NCBI Gene Expression Omnibus (GEO; http://www.ncbi.nlm.nih.gov/geo/) under accession number GSE104681. Multiplexed WT and prp2-1 CCS reads can be downloaded from Harvard Dataverse doi:10.7910/DVN/PW1KEG (Herzel 2017).
Supplementary Material
Acknowledgments
We thank Gene-Wei Li and members of the Neugebauer and Li labs, Hanspeter Herzel, Michael Weber, Fernando Carrillo Oesterreich, and Charles Query for discussions and comments on the manuscript. We also thank Iva Tolic, Tamas Fischer, and Charles Query for gifts of strains, Jeremy Schofield for help with preliminary experiments, and Guilin Wang and the Yale Center for Genome Analysis for technical assistance and advice. The work was supported by funding by the National Institutes of Health grant R01GM112766 from the NIGMS. Its contents are solely the responsibility of the authors and do not necessarily represent the official views of the NIH. L.H. is a postdoctoral fellow of the Helen Hay Whitney foundation.
Author contributions: L.H. and K.M.N. conceived the study and designed the experiments. Semiquantitative RT-PCR experiments represented in Supplemental Figure S2B and Supplemental Table S7 were carried out by K.S. All other experiments and data analyses were performed by L.H. L.H. and K.M.N. wrote the manuscript. All authors read and approved the manuscript.
Footnotes
[Supplemental material is available for this article.]
Article published online before print. Article, supplemental material, and publication date are at http://www.genome.org/cgi/doi/10.1101/gr.232025.117.
References
- Alexander RD, Barrass JD, Dichtl B, Kos M, Obtulowicz T, Robert MC, Koper M, Karkusiewicz I, Mariconti L, Tollervey D, et al. 2010. RiboSys, a high-resolution, quantitative approach to measure the in vivo kinetics of pre-mRNA splicing and 3′-end processing in Saccharomyces cerevisiae. RNA 16: 2570–2580. [DOI] [PMC free article] [PubMed] [Google Scholar]
- Alpert T, Herzel L, Neugebauer KM. 2017. Perfect timing: splicing and transcription rates in living cells. Wiley Interdiscip Rev RNA 8 10.1002/wrna.1401. [DOI] [PMC free article] [PubMed] [Google Scholar]
- Barrass JD, Reid JE, Huang Y, Hector RD, Sanguinetti G, Beggs JD, Granneman S. 2015. Transcriptome-wide RNA processing kinetics revealed using extremely short 4tU labeling. Genome Biol 16: 282. [DOI] [PMC free article] [PubMed] [Google Scholar]
- Bentley DL. 2014. Coupling mRNA processing with transcription in time and space. Nat Rev Genet 15: 163–175. [DOI] [PMC free article] [PubMed] [Google Scholar]
- Berg MG, Singh LN, Younis I, Liu Q, Pinto AM, Kaida D, Zhang Z, Cho S, Sherrill-Mix S, Wan L, et al. 2012. U1 snRNP determines mRNA length and regulates isoform expression. Cell 150: 53–64. [DOI] [PMC free article] [PubMed] [Google Scholar]
- Bhatt DM, Pandya-Jones A, Tong AJ, Barozzi I, Lissner MM, Natoli G, Black DL, Smale ST. 2012. Transcript dynamics of proinflammatory genes revealed by sequence analysis of subcellular RNA fractions. Cell 150: 279–290. [DOI] [PMC free article] [PubMed] [Google Scholar]
- Bitton DA, Atkinson SR, Rallis C, Smith GC, Ellis DA, Chen YY, Malecki M, Codlin S, Lemay JF, Cotobal C, et al. 2015. Widespread exon skipping triggers degradation by nuclear RNA surveillance in fission yeast. Genome Res 25: 884–896. [DOI] [PMC free article] [PubMed] [Google Scholar]
- Bonde MM, Voegeli S, Baudrimont A, Seraphin B, Becskei A. 2014. Quantification of pre-mRNA escape rate and synergy in splicing. Nucleic Acids Res 42: 12847–12860. [DOI] [PMC free article] [PubMed] [Google Scholar]
- Bousquet-Antonelli C, Presutti C, Tollervey D. 2000. Identification of a regulated pathway for nuclear pre-mRNA turnover. Cell 102: 765–775. [DOI] [PubMed] [Google Scholar]
- Boutz PL, Bhutkar A, Sharp PA. 2015. Detained introns are a novel, widespread class of post-transcriptionally spliced introns. Genes Dev 29: 63–80. [DOI] [PMC free article] [PubMed] [Google Scholar]
- Brogna S, McLeod T, Petric M. 2016. The meaning of NMD: translate or perish. Trends Genet 32: 395–407. [DOI] [PubMed] [Google Scholar]
- Brugiolo M, Herzel L, Neugebauer KM. 2013. Counting on co-transcriptional splicing. F1000Prime Rep 5: 9. [DOI] [PMC free article] [PubMed] [Google Scholar]
- Burke JE, Longhurst AD, Merkurjev D, Sales-Lee J, Rao B, Moresco JJ, Yates JR III, Li JJ, Madhani HD. 2018. Spliceosome profiling visualizes operations of a dynamic RNP at nucleotide resolution. Cell 173: 1014–1030.e17. [DOI] [PMC free article] [PubMed] [Google Scholar]
- Carrillo Oesterreich F, Preibisch S, Neugebauer KM. 2010. Global analysis of nascent RNA reveals transcriptional pausing in terminal exons. Mol Cell 40: 571–581. [DOI] [PubMed] [Google Scholar]
- Carrillo Oesterreich F, Herzel L, Straube K, Hujer K, Howard J, Neugebauer KM. 2016. Splicing of nascent RNA coincides with intron exit from RNA polymerase II. Cell 165: 372–381. [DOI] [PMC free article] [PubMed] [Google Scholar]
- Chen W, Shulha HP, Ashar-Patel A, Yan J, Green KM, Query CC, Rhind N, Weng Z, Moore MJ. 2014. Endogenous U2·U5·U6 snRNA complexes in S. pombe are intron lariat spliceosomes. RNA 20: 308–320. [DOI] [PMC free article] [PubMed] [Google Scholar]
- Chiu AC, Suzuki HI, Wu X, Mahat DB, Kriz AJ, Sharp PA. 2018. Transcriptional pause sites delineate stable nucleosome-associated premature polyadenylation suppressed by U1 snRNP. Mol Cell 69: 648–663.e7. [DOI] [PMC free article] [PubMed] [Google Scholar]
- Crabb TL, Lam BJ, Hertel KJ. 2010. Retention of spliceosomal components along ligated exons ensures efficient removal of multiple introns. RNA 16: 1786–1796. [DOI] [PMC free article] [PubMed] [Google Scholar]
- Davidson L, Kerr A, West S. 2012. Co-transcriptional degradation of aberrant pre-mRNA by Xrn2. EMBO J 31: 2566–2578. [DOI] [PMC free article] [PubMed] [Google Scholar]
- de la Mata M, Lafaille C, Kornblihtt AR. 2010. First come, first served revisited: Factors affecting the same alternative splicing event have different effects on the relative rates of intron removal. RNA 16: 904–912. [DOI] [PMC free article] [PubMed] [Google Scholar]
- Dujardin G, Lafaille C, de la Mata M, Marasco LE, Munoz MJ, Le Jossic-Corcos C, Corcos L, Kornblihtt AR. 2014. How slow RNA polymerase II elongation favors alternative exon skipping. Mol Cell 54: 683–690. [DOI] [PubMed] [Google Scholar]
- Duncan CD, Mata J. 2014. The translational landscape of fission-yeast meiosis and sporulation. Nat Struct Mol Biol 21: 641–647. [DOI] [PMC free article] [PubMed] [Google Scholar]
- Eser P, Wachutka L, Maier KC, Demel C, Boroni M, Iyer S, Cramer P, Gagneur J. 2016. Determinants of RNA metabolism in the Schizosaccharomyces pombe genome. Mol Syst Biol 12: 857. [DOI] [PMC free article] [PubMed] [Google Scholar]
- Fabrizio P, Dannenberg J, Dube P, Kastner B, Stark H, Urlaub H, Luhrmann R. 2009. The evolutionarily conserved core design of the catalytic activation step of the yeast spliceosome. Mol Cell 36: 593–608. [DOI] [PubMed] [Google Scholar]
- Fair BJ, Pleiss JA. 2017. The power of fission: yeast as a tool for understanding complex splicing. Curr Genet 63: 375–380. [DOI] [PMC free article] [PubMed] [Google Scholar]
- Fededa JP, Petrillo E, Gelfand MS, Neverov AD, Kadener S, Nogues G, Pelisch F, Baralle FE, Muro AF, Kornblihtt AR. 2005. A polar mechanism coordinates different regions of alternative splicing within a single gene. Mol Cell 19: 393–404. [DOI] [PubMed] [Google Scholar]
- Fong N, Kim H, Zhou Y, Ji X, Qiu J, Saldi T, Diener K, Jones K, Fu XD, Bentley DL. 2014. Pre-mRNA splicing is facilitated by an optimal RNA polymerase II elongation rate. Genes Dev 28: 2663–2676. [DOI] [PMC free article] [PubMed] [Google Scholar]
- Girard C, Will CL, Peng J, Makarov EM, Kastner B, Lemm I, Urlaub H, Hartmuth K, Luhrmann R. 2012. Post-transcriptional spliceosomes are retained in nuclear speckles until splicing completion. Nat Commun 3: 994. [DOI] [PubMed] [Google Scholar]
- Glauser DA, Johnson BE, Aldrich RW, Goodman MB. 2011. Intragenic alternative splicing coordination is essential for Caenorhabditis elegans slo-1 gene function. Proc Natl Acad Sci 108: 20790–20795. [DOI] [PMC free article] [PubMed] [Google Scholar]
- Gunderson FQ, Johnson TL. 2009. Acetylation by the transcriptional coactivator Gcn5 plays a novel role in co-transcriptional spliceosome assembly. PLoS Genet 5: e1000682. [DOI] [PMC free article] [PubMed] [Google Scholar]
- Gunderson SI, Polycarpou-Schwarz M, Mattaj IW. 1998. U1 snRNP inhibits pre-mRNA polyadenylation through a direct interaction between U1 70K and poly(A) polymerase. Mol Cell 1: 255–264. [DOI] [PubMed] [Google Scholar]
- Gunderson FQ, Merkhofer EC, Johnson TL. 2011. Dynamic histone acetylation is critical for cotranscriptional spliceosome assembly and spliceosomal rearrangements. Proc Natl Acad Sci 108: 2004–2009. [DOI] [PMC free article] [PubMed] [Google Scholar]
- Herzel L. 2015. “Co-transcriptional splicing in two yeasts.” PhD thesis, Technical University Dresden, Dresden, Germany: http://nbn-resolving.de/urn:nbn:de:bsz:14-qucosa-179274. [Google Scholar]
- Herzel L. 2017. Long-read nascent RNA sequencing from S. pombe wild-type and prp2-1 strains. Harvard Dataverse V1 10.7910/DVN/PW1KEG. [DOI] [Google Scholar]
- Herzel L, Neugebauer KM. 2015. Quantification of co-transcriptional splicing from RNA-Seq data. Methods 85: 36–43. [DOI] [PubMed] [Google Scholar]
- Herzel L, Ottoz DSM, Alpert T, Neugebauer KM. 2017. Splicing and transcription touch base: co-transcriptional spliceosome assembly and function. Nat Rev Mol Cell Biol 18: 637–650. [DOI] [PMC free article] [PubMed] [Google Scholar]
- Hicks MJ, Yang CR, Kotlajich MV, Hertel KJ. 2006. Linking splicing to Pol II transcription stabilizes pre-mRNAs and influences splicing patterns. PLoS Biol 4: e147. [DOI] [PMC free article] [PubMed] [Google Scholar]
- Huang T, Vilardell J, Query CC. 2002. Pre-spliceosome formation in S. pombe requires a stable complex of SF1-U2AF59-U2AF23. EMBO J 21: 5516–5526. [DOI] [PMC free article] [PubMed] [Google Scholar]
- Kaufer NF, Potashkin J. 2000. Analysis of the splicing machinery in fission yeast: a comparison with budding yeast and mammals. Nucleic Acids Res 28: 3003–3010. [DOI] [PMC free article] [PubMed] [Google Scholar]
- Kervestin S, Jacobson A. 2012. NMD: a multifaceted response to premature translational termination. Nat Rev Mol Cell Biol 13: 700–712. [DOI] [PMC free article] [PubMed] [Google Scholar]
- Kessler O, Jiang Y, Chasin LA. 1993. Order of intron removal during splicing of endogenous adenine phosphoribosyltransferase and dihydrofolate reductase pre-mRNA. Mol Cell Biol 13: 6211–6222. [DOI] [PMC free article] [PubMed] [Google Scholar]
- Khodor YL, Rodriguez J, Abruzzi KC, Tang CH, Marr MT II, Rosbash M. 2011. Nascent-seq indicates widespread cotranscriptional pre-mRNA splicing in Drosophila. Genes Dev 25: 2502–2512. [DOI] [PMC free article] [PubMed] [Google Scholar]
- Khodor YL, Menet JS, Tolan M, Rosbash M. 2012. Cotranscriptional splicing efficiency differs dramatically between Drosophila and mouse. RNA 18: 2174–2186. [DOI] [PMC free article] [PubMed] [Google Scholar]
- Kilchert C, Wittmann S, Vasiljeva L. 2016. The regulation and functions of the nuclear RNA exosome complex. Nat Rev Mol Cell Biol 17: 227–239. [DOI] [PubMed] [Google Scholar]
- Kim D, Pertea G, Trapnell C, Pimentel H, Kelley R, Salzberg SL. 2013. TopHat2: accurate alignment of transcriptomes in the presence of insertions, deletions and gene fusions. Genome Biol 14: R36. [DOI] [PMC free article] [PubMed] [Google Scholar]
- Kim SW, Taggart AJ, Heintzelman C, Cygan KJ, Hull CG, Wang J, Shrestha B, Fairbrother WG. 2017. Widespread intra-dependencies in the removal of introns from human transcripts. Nucleic Acids Res 45: 9503–9513. [DOI] [PMC free article] [PubMed] [Google Scholar]
- Kuang Z, Boeke JD, Canzar S. 2017. The dynamic landscape of fission yeast meiosis alternative-splice isoforms. Genome Res 27: 145–156. [DOI] [PMC free article] [PubMed] [Google Scholar]
- Kupfer DM, Drabenstot SD, Buchanan KL, Lai H, Zhu H, Dyer DW, Roe BA, Murphy JW. 2004. Introns and splicing elements of five diverse fungi. Eukaryot Cell 3: 1088–1100. [DOI] [PMC free article] [PubMed] [Google Scholar]
- Lee Y, Rio DC. 2015. Mechanisms and regulation of alternative pre-mRNA splicing. Annu Rev Biochem 84: 291–323. [DOI] [PMC free article] [PubMed] [Google Scholar]
- Leong HS, Dawson K, Wirth C, Li Y, Connolly Y, Smith DL, Wilkinson CR, Miller CJ. 2014. A global non-coding RNA system modulates fission yeast protein levels in response to stress. Nat Commun 5: 3947. [DOI] [PMC free article] [PubMed] [Google Scholar]
- Lipp JJ, Marvin MC, Shokat KM, Guthrie C. 2015. SR protein kinases promote splicing of nonconsensus introns. Nat Struct Mol Biol 22: 611–617. [DOI] [PubMed] [Google Scholar]
- Marguerat S, Schmidt A, Codlin S, Chen W, Aebersold R, Bahler J. 2012. Quantitative analysis of fission yeast transcriptomes and proteomes in proliferating and quiescent cells. Cell 151: 671–683. [DOI] [PMC free article] [PubMed] [Google Scholar]
- Martin M. 2011. Cutadapt removes adapter sequences from high-throughput sequencing reads. EMBnet J 17 10.14806/ej.17.1.200. [DOI] [Google Scholar]
- Mayer A, di Iulio J, Maleri S, Eser U, Vierstra J, Reynolds A, Sandstrom R, Stamatoyannopoulos JA, Churchman LS. 2015. Native elongating transcript sequencing reveals human transcriptional activity at nucleotide resolution. Cell 161: 541–554. [DOI] [PMC free article] [PubMed] [Google Scholar]
- Millevoi S, Loulergue C, Dettwiler S, Karaa SZ, Keller W, Antoniou M, Vagner S. 2006. An interaction between U2AF 65 and CF Im links the splicing and 3′ end processing machineries. EMBO J 25: 4854–4864. [DOI] [PMC free article] [PubMed] [Google Scholar]
- Milligan L, Sayou C, Tuck A, Auchynnikava T, Reid JEA, Alexander R, Alves FL, Allshire R, Spanos C, Rappsilber J, et al. 2017. RNA polymerase II stalling at pre-mRNA splice sites is enforced by ubiquitination of the catalytic subunit. eLife 6: e27082. [DOI] [PMC free article] [PubMed] [Google Scholar]
- Movassat M, Crabb TL, Busch A, Yao C, Reynolds DJ, Shi Y, Hertel KJ. 2016. Coupling between alternative polyadenylation and alternative splicing is limited to terminal introns. RNA Biol 13: 646–655. [DOI] [PMC free article] [PubMed] [Google Scholar]
- Munding EM, Shiue L, Katzman S, Donohue JP, Ares M Jr. 2013. Competition between pre-mRNAs for the splicing machinery drives global regulation of splicing. Mol Cell 51: 338–348. [DOI] [PMC free article] [PubMed] [Google Scholar]
- Muniz L, Deb MK, Aguirrebengoa M, Lazorthes S, Trouche D, Nicolas E. 2017. Control of gene expression in senescence through transcriptional read-through of convergent protein-coding genes. Cell Rep 21: 2433–2446. [DOI] [PubMed] [Google Scholar]
- Nag A, Steitz JA. 2012. Tri-snRNP-associated proteins interact with subunits of the TRAMP and nuclear exosome complexes, linking RNA decay and pre-mRNA splicing. RNA Biol 9: 334–342. [DOI] [PMC free article] [PubMed] [Google Scholar]
- Neves LT, Douglass S, Spreafico R, Venkataramanan S, Kress TL, Johnson TL. 2017. The histone variant H2A.Z promotes efficient cotranscriptional splicing in S. cerevisiae. Genes Dev 31: 702–717. [DOI] [PMC free article] [PubMed] [Google Scholar]
- Nissen KE, Homer CM, Ryan CJ, Shales M, Krogan NJ, Patrick KL, Guthrie C. 2017. The histone variant H2A.Z promotes splicing of weak introns. Genes Dev 31: 688–701. [DOI] [PMC free article] [PubMed] [Google Scholar]
- Oh JM, Di C, Venters CC, Guo J, Arai C, So BR, Pinto AM, Zhang Z, Wan L, Younis I, et al. 2017. U1 snRNP telescripting regulates a size–function-stratified human genome. Nat Struct Mol Biol 24: 993–999. [DOI] [PMC free article] [PubMed] [Google Scholar]
- Park SG, Hannenhalli S. 2015. First intron length in mammals is associated with 5′ exon skipping rate. bioRxiv 10.1101/024463. [DOI]
- Patrick KL, Ryan CJ, Xu J, Lipp JJ, Nissen KE, Roguev A, Shales M, Krogan NJ, Guthrie C. 2015. Genetic interaction mapping reveals a role for the SWI/SNF nucleosome remodeler in spliceosome activation in fission yeast. PLoS Genet 11: e1005074. [DOI] [PMC free article] [PubMed] [Google Scholar]
- Quinlan AR, Hall IM. 2010. BEDTools: a flexible suite of utilities for comparing genomic features. Bioinformatics 26: 841–842. [DOI] [PMC free article] [PubMed] [Google Scholar]
- Rallis C, Bahler J. 2013. Inhibition of TORC1 signaling and increased lifespan: gained in translation? Aging (Albany NY) 5: 335–336. [DOI] [PMC free article] [PubMed] [Google Scholar]
- Robinson MD, McCarthy DJ, Smyth GK. 2010. edgeR: a Bioconductor package for differential expression analysis of digital gene expression data. Bioinformatics 26: 139–140. [DOI] [PMC free article] [PubMed] [Google Scholar]
- Romfo CM, Alvarez CJ, van Heeckeren WJ, Webb CJ, Wise JA. 2000. Evidence for splice site pairing via intron definition in Schizosaccharomyces pombe. Mol Cell Biol 20: 7955–7970. [DOI] [PMC free article] [PubMed] [Google Scholar]
- Sakharkar MK, Perumal BS, Sakharkar KR, Kangueane P. 2005. An analysis on gene architecture in human and mouse genomes. In Silico Biol 5: 347–365. [PubMed] [Google Scholar]
- Saldi T, Cortazar MA, Sheridan RM, Bentley DL. 2016. Coupling of RNA polymerase II transcription elongation with pre-mRNA splicing. J Mol Biol 428: 2623–2635. [DOI] [PMC free article] [PubMed] [Google Scholar]
- Schor IE, Gomez Acuna LI, Kornblihtt AR. 2013. Coupling between transcription and alternative splicing. Cancer Treat Res 158: 1–24. [DOI] [PubMed] [Google Scholar]
- Shalgi R, Hurt JA, Lindquist S, Burge CB. 2014. Widespread inhibition of posttranscriptional splicing shapes the cellular transcriptome following heat shock. Cell Rep 7: 1362–1370. [DOI] [PubMed] [Google Scholar]
- Shao W, Kim HS, Cao Y, Xu YZ, Query CC. 2012. A U1-U2 snRNP interaction network during intron definition. Mol Cell Biol 32: 470–478. [DOI] [PMC free article] [PubMed] [Google Scholar]
- Sharon D, Tilgner H, Grubert F, Snyder M. 2013. A single-molecule long-read survey of the human transcriptome. Nat Biotechnol 31: 1009–1014. [DOI] [PMC free article] [PubMed] [Google Scholar]
- Sridharan V, Heimiller J, Singh R. 2011. Genomic mRNA profiling reveals compensatory mechanisms for the requirement of the essential splicing factor U2AF. Mol Cell Biol 31: 652–661. [DOI] [PMC free article] [PubMed] [Google Scholar]
- Tilgner H, Knowles DG, Johnson R, Davis CA, Chakrabortty S, Djebali S, Curado J, Snyder M, Gingeras TR, Guigo R. 2012. Deep sequencing of subcellular RNA fractions shows splicing to be predominantly co-transcriptional in the human genome but inefficient for lncRNAs. Genome Res 22: 1616–1625. [DOI] [PMC free article] [PubMed] [Google Scholar]
- Tilgner H, Jahanbani F, Blauwkamp T, Moshrefi A, Jaeger E, Chen F, Harel I, Bustamante CD, Rasmussen M, Snyder MP. 2015. Comprehensive transcriptome analysis using synthetic long-read sequencing reveals molecular co-association of distant splicing events. Nat Biotechnol 33: 736–742. [DOI] [PMC free article] [PubMed] [Google Scholar]
- Tilgner H, Jahanbani F, Gupta I, Collier P, Wei E, Rasmussen M, Snyder M. 2018. Microfluidic isoform sequencing shows widespread splicing coordination in the human transcriptome. Genome Res 28: 231–242. [DOI] [PMC free article] [PubMed] [Google Scholar]
- Trapnell C, Williams BA, Pertea G, Mortazavi A, Kwan G, van Baren MJ, Salzberg SL, Wold BJ, Pachter L. 2010. Transcript assembly and quantification by RNA-seq reveals unannotated transcripts and isoform switching during cell differentiation. Nat Biotechnol 28: 511–515. [DOI] [PMC free article] [PubMed] [Google Scholar]
- Vagner S, Vagner C, Mattaj IW. 2000. The carboxyl terminus of vertebrate poly(A) polymerase interacts with U2AF 65 to couple 3′-end processing and splicing. Genes Dev 14: 403–413. [PMC free article] [PubMed] [Google Scholar]
- Vargas DY, Shah K, Batish M, Levandoski M, Sinha S, Marras SA, Schedl P, Tyagi S. 2011. Single-molecule imaging of transcriptionally coupled and uncoupled splicing. Cell 147: 1054–1065. [DOI] [PMC free article] [PubMed] [Google Scholar]
- Vilborg A, Sabath N, Wiesel Y, Nathans J, Levy-Adam F, Yario TA, Steitz JA, Shalgi R. 2017. Comparative analysis reveals genomic features of stress-induced transcriptional readthrough. Proc Natl Acad Sci 114: E8362–E8371. [DOI] [PMC free article] [PubMed] [Google Scholar]
- Wahl MC, Will CL, Luhrmann R. 2009. The spliceosome: design principles of a dynamic RNP machine. Cell 136: 701–718. [DOI] [PubMed] [Google Scholar]
- Wallace EWJ, Beggs JD. 2017. Extremely fast and incredibly close: cotranscriptional splicing in budding yeast. RNA 23: 601–610. [DOI] [PMC free article] [PubMed] [Google Scholar]
- Wetterberg I, Zhao J, Masich S, Wieslander L, Skoglund U. 2001. In situ transcription and splicing in the Balbiani ring 3 gene. EMBO J 20: 2564–2574. [DOI] [PMC free article] [PubMed] [Google Scholar]
- Wilhelm BT, Marguerat S, Watt S, Schubert F, Wood V, Goodhead I, Penkett CJ, Rogers J, Bahler J. 2008. Dynamic repertoire of a eukaryotic transcriptome surveyed at single-nucleotide resolution. Nature 453: 1239–1243. [DOI] [PubMed] [Google Scholar]
- Wong JJ, Au AY, Ritchie W, Rasko JE. 2016. Intron retention in mRNA: no longer nonsense: known and putative roles of intron retention in normal and disease biology. Bioessays 38: 41–49. [DOI] [PubMed] [Google Scholar]
- Wu TD, Watanabe CK. 2005. GMAP: a genomic mapping and alignment program for mRNA and EST sequences. Bioinformatics 21: 1859–1875. [DOI] [PubMed] [Google Scholar]
- Zhang MQ. 1998. Statistical features of human exons and their flanking regions. Hum Mol Genet 7: 919–932. [DOI] [PubMed] [Google Scholar]
- Zhou Y, Zhu J, Schermann G, Ohle C, Bendrin K, Sugioka-Sugiyama R, Sugiyama T, Fischer T. 2015. The fission yeast MTREC complex targets CUTs and unspliced pre-mRNAs to the nuclear exosome. Nat Commun 6: 7050. [DOI] [PMC free article] [PubMed] [Google Scholar]
- Zhuang F, Fuchs RT, Sun Z, Zheng Y, Robb GB. 2012. Structural bias in T4 RNA ligase-mediated 3′-adapter ligation. Nucleic Acids Res 40: e54. [DOI] [PMC free article] [PubMed] [Google Scholar]
Associated Data
This section collects any data citations, data availability statements, or supplementary materials included in this article.