Abstract
Objective
The purpose of the study is to demonstrate laser evoked pressure waves in small confined volumes such as the cochlea.
Methods
Custom fabricated pressure probes were used to determine the pressure in front of the optical fiber in a small dish and patch pipettes to measure temperature changes. Pressure probes were inserted into scala tympani or vestibuli during laser stimulation. With a sensitive microphone the pressure was measured in the outer ear canal.
Results
Heating was spatially confined. The heat relaxation time was 35 ms. During laser stimulation in the cochlea at 17 μJ/pulse the pressure in the outer ear canal was 43.5 dB (re 20 μPa). The corresponding intracochlear pressure was calculated to be about 78.5 dB (re 20 μPa) using the middle ear reverse transfer function of −35 dB. At 164 μJ/pulse, the pressure in the ear canal was on average 63 dB (re 20 μPa) and the intracochlear pressure was estimated to be 98 dB (re 20 μPa), which is similar to the value obtained with the pressure probe, 100 dB (re 20 μPa). Side-emitting optical fibers were used to steer the beampath. The pressure values were independent of the orientation of the beam path. Evoked compound action potentials of the auditory nerve were maximum when spiral ganglion neurons were in the beampath.
Conclusion
Pressure waves are generated during infrared laser stimulation. The intracochlear pressure was independent from the orientation of the beampath.
Significance
Neural responses required the spiral ganglion neurons to be directly irradiated.
Index Terms: Photoacoustic effect, Auditory system, Cochlea, Optical radiation effects, Infrared radiation
I. Introduction
Laser tissue interactions are defined by both, the laser parameters and the properties of the irradiated tissue [1–5]. Laser parameters include the radiation wavelength (λ), the radiant power or energy, the laser operation mode, continuous wave (CW) or pulsed mode and the spot size. Tissue properties are defined by the amount of photons, which are reflected, scattered or absorbed. In the infrared, the absorption of the photons by water typically dominates the laser-tissue interaction. For example, at λ =1860 nm the absorption length in water for the radiation is 700 μm [6]. Following the absorption of the photon, its energy is converted into heat. In case that the heat is delivered to the irradiated volume faster than it can be dissipated by diffusion or convection, thermal confinement exists and the temperature in the irradiated volume increases [1]. Heating also results in a thermal expansion and the generation of a quasi steady state stress [1]. Laser parameters such as pulse length, and radiant energy or spot size that result in a stress relaxation wave have been summarized and are shown in Fig. 13 of a publication by Jacques [1]. Experimentally the pressure during laser irradiation has been measured for near infrared radiation (λ = 1850 nm) at small radiant energies (less than 160 μJ/pulse) by Teudt et al. [7], who showed that the infrared laser generates a peak pressure pulse of 62 dB (re 20 μPa) in air and 63.8 dB (re 20 μPa) in water. The pulse length was 100 μs, the core diameter of the optical fiber 200 μm, its numerical aperture 0.22, and the radiant exposure 0.35 J/cm2. This finding is significant for infrared neural stimulation because the pressure might be an important factor in the mechanism for cochlear stimulation. This question becomes in particular significant since the outcomes in deaf animals differed among groups. While some were able to stimulate cochleae with missing hair cells [8, 9], others could not evoke a response from the cochlea in deaf animals [10–12].
Although the controversy cannot be settled, this study provides data on the pressure waves in the cochlea during stimulation with the laser. The question was whether those pressure pulses were large enough to induce an acoustic response in animals with normal or residual hearing left. We measured the laser-induced pressure in scala tympani (PST) directly with a small pressure probe. The results were confirmed with a second approach during which the pressure in the cochlea was estimated from pressure measurements in the outer ear canal (EC) during pulsed infrared stimulation in the cochlea.
II. Method
Measurements were conducted in air, in a confined fluid volume in a petri dish, in cadaveric guinea pig cochleae and in vivo in guinea pig cochleae. At the beginning of the experiment, the sensor was calibrated and tested in vitro, either in air or a small dish, to verify whether it could be used in vivo to measure the pressure during laser irradiation. Then it was placed in the cochleae of cadaveric and normal hearing guinea pigs to measure the resulting pressure to acoustic and laser stimulation. The resulting peak pressure values were compared. A sensitive ER-10C microphone (Etymotic Research, Inc, Elk Grove Village, IL) was placed in the cartilaginous outer ear canal to measure the sound pressure level during infrared laser irradiation. The laser-induced pressure in the cochlea was calculated by using the reverse transfer function of the guinea pig middle ear [13–15].
A. Pressure Sensor
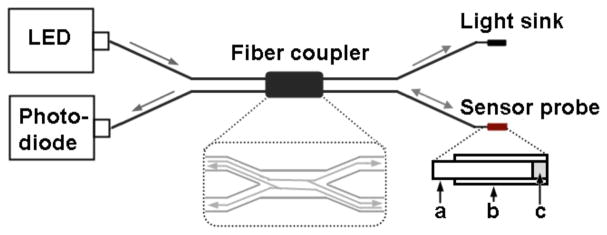
The objective was to measure the pressure in a small confined fluid volume during laser irradiation. To accomplish those measurements the pressure sensor must be (1) able to measure pressure levels below 1 N/m2 = 1 Pa and (2) it must be small enough to be inserted into the cochlea through a cochleostomy in the basal cochlear turn. This kind of sensor has been developed, tested, and used before by others to measure sound induced pressure in the cochlea of gerbils [16]. Fig. 1 shows a sketch of the sensor, which consisted of a light reflecting sensor tip a fiber coupler with a 50:50 splitting ratio (Gould Corp., Millersville, MD), a light emitting diode (LED) light source (HFE4854-014, Honeywell), and a photodiode (HFD3854-002, Honeywell). The sensor tip was a glass micro tube with an inner diameter of 150 ± 4 μm and an outer diameter of 363 ± 10 μm (Polymicro Technologies, Phoenix, AZ). One opening of the tube was covered with a thin film diaphragm formed by floating a drop of photosensitive polymer adhesive (Norland, New Brunswick, NJ) on water. The thin plastic film was coated with a reflective layer of gold. Through the other opening of the tube, one of the outputs of the fiber coupler was inserted and was advanced until the optical fiber tip was 50 – 100 μm away from the reflective diaphragm.
Fig. 1.
Sketch of the pressure sensor. ‘a’ is an arm of the fiber coupler’s output; ‘b’ is hollow core glass fiber with a reflective film; ‘c’ is air gap between optical fiber tip and the film. The light path was shown in the dashed frame.
Once the final position of the tip was reached it was glued into place. A LED with a wavelength of λ =850-nm provided constant light to one of the inputs of the fiber coupler. Through the fiber coupler the light reached the sensor tip. The light was reflected back to the fiber coupler and its intensity was measured by the photodiode. Only one output fiber was used, the other arm was optically sunk. Following the assembly of the sensors, they were calibrated in air using acoustic stimuli (for information on acoustic stimuli see also below) and in fluids as described previously [16–18]. The responses to 100 stimuli were averaged and stored on the computer for offline analysis. Only the sensors, which sensitivity was between −20 to −40 dBV/80 dB (re 20 μPa) were selected for the measurements.
B. Temperature Probe
As described before, a glass micro-pipette was used to measure the local temperature at different selected locations in front of the optical fiber while laser pulses were delivered with a 200 μm optical fiber [19, 20]. A glass pipette was pulled, filled with 0.1 M saline solution, and mounted to the head-stage of an Axopatch 200B (Axon Instruments Inc., Foster City, CA) patch-clamp amplifier. The pipette current was measured in voltage-clamp mode. Upon heating of the bath solution the pipette resistance and the corresponding pipette current changed. A pipette current versus temperature calibration curve was obtained by applying hot solution (~40 °C) into the bath and subsequently allowing it to cool while simultaneously recording pipette current and solution temperature. For each drop of 1 °C a reading was taken. Temperature changes over time were then collected during the application of infrared pulses.
C. In vitro Temperature and Pressure Measurements
1) Measurements in the dish
The temperature and pressure in front of an optical fiber was determined during laser irradiation. An optical fiber, 200 μm in diameter, was immersed in a petri dish, with the diameter of 37 or 90 mm and height of 8 or 12 mm. The dish was filled with distilled water. The tip of the optical fiber, coupled to an infrared diode laser (Aculight), was placed in the dish 1 mm below the surface of the fluid. The beampath was oriented parallel to the surface. For the measurements either the glass pipette for the temperature measurements or the pressure sensor were placed in the center of the optical fiber. A temperature or pressure measurement was made for this location while laser pulses were delivered (λ =1860 nm, 100 μs, and 4 Hz repetition rate). After the first measurement the probe was moved in steps of 50 or 250 μm along a preset grid in a plane in front of the optical fiber, which contains the optical axis. After completion of the set of measurements the results were graphed using either IgroPro (WaveMetrics, Lake Oswego, OR) or MATLAB (MathWorks, Natick, MA).
2) Measurements in the cadaveric cochlea
Guinea pig temporal bones were harvested to access the cochleae and to measure the pressure generated by the laser pulses. Either scala tympani (PST) or scala vestibuli pressure (PSV) was measured in different cochleae. To measure the PST, a 400 μm diameter cochleostomy was created in scala tympani (ST) with a motorized drill (World Precision Instruments, Sarasota, FL) approximately 0.5 mm from the bony rim of the round window (RW). Using 3D micromanipulators (MHW103, Narishige, Tokyo, Japan), the pressure sensor was inserted approximately 200 μm through the cochleostomy into ST. A 200 μm optical fiber (P200-5-VIS-NIR, Ocean Optics, Dunedin, FL) was placed in front of the RW with its orientation towards the spiral ganglion neurons. The tip of the optical fiber was 200 μm away from the modiolus. To measure PSV, a 400 μm diameter cochleostomy was made in SV close to the oval window in addition to the cochleostomy in ST. The pressure sensor was inserted approximately 200 μm into SV through SV cochleostomy, and the optical fiber was inserted into ST cochleostomy such that its tip was 200 μm away from the modiolus.
D. In vivo Experiment
Adult guinea pigs of either sex were used in the experiments. Care and use of the animals were carried out within the guidelines of the NIH Guide for the Care and Use of Laboratory Animals and were approved by the Animal Care and Use Committee of Northwestern University.
1) Anesthesia
Animal procedures were the same as previously reported [21–23]. Guinea pigs (300–600g) were anesthetized with 0.9 mg/kg urethane. The level of anesthesia was maintained throughout the procedure with 40–80 mg/kg ketamine combined with 5–10 mg/kg xylazine for the initial injection diluted 1:10 in 0.1 M saline solution. After the animals were anesthetized, a tracheotomy was made and a plastic tube was secured into the trachea to facilitate breathing. Throughout the experiment the animals were ventilated with oxygen using an anesthesia workstation (Hallowell EMC). Depth of anesthesia was assessed every 15 minutes with a paw withdrawal reflex. Core body temperature was maintained at 38°C with a thermostatically controlled heating pad. Heart rate, respiration rate, body temperature and O2-saturation were monitored continuously using a Bionet BM3 vet (Tustin, CA) monitoring system.
2) Surgery
The surgical approach has been described before [23–25]. Briefly, the animal’s head was fixed with dental acrylic (Methyl Methacrylate, CO-ORAL-ITE DENTAL MFG CO, Diamond Springs, CA) to a custom-made head holder, using three 1.5 mm stainless steel self-tapping cortex screws (Veterinary Orthopedic Implants, St. Augustine, FL) as anchors. The left cochlea was surgically accessed through a “C”-shaped skin incision behind the pinna. Cervicoauricular muscles were removed by blunt dissection and the outer ear canal was exposed and sectioned for easier acoustic stimulus placement and better surgical access. The bulla was exposed and opened, directly caudal of the ear canal, using a motorized drill (World Precision Instruments, Sarasota, FL).
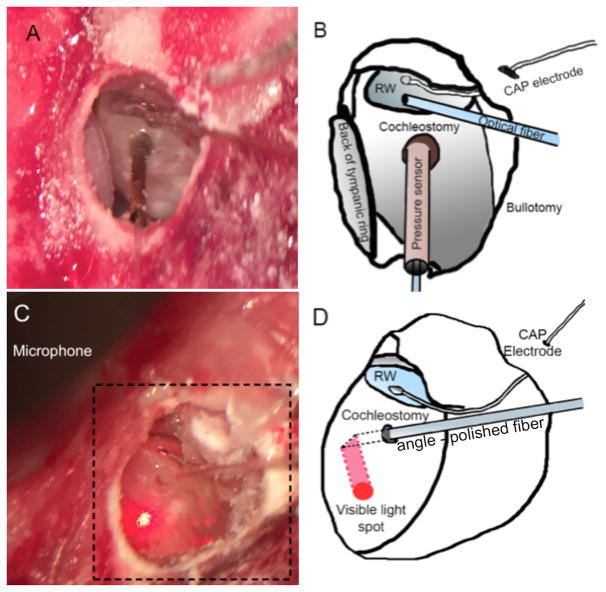
A silver ball electrode was fabricated at the end of a 125 μm Teflon insulated silver wire (A-M systems, 131 Business Park Loop Sequim, WA) and was placed on the RW membrane to record the compound action potential (CAP). Inner ear pressure measurements were conducted as described for the cadaveric cochleae. The custom-made pressure sensor was inserted into ST through the cochleostomy with a Narishige 3D micromanipulator (MHW103, Narishige, Tokyo, Japan). The 200 μm optical fiber was placed into ST through the RW using a second 3D micromanipulator. The optical fiber was oriented towards the spiral ganglion neurons located in Rosenthal’s canal (Fig. 2A and B).
Fig. 2.
The in vivo experimental setup showed in A and C, with their sketches showed in B and D respectively. To measure the pressure during laser stimulation in the cochlea the bulla was surgically accessed and opened (B, D; bullotomy). The round window becomes visible and a silver ball electrode was placed (B, D; CAP electrode) to record compound action potentials (CAPs). (A, B) for pressure measurements in the cochlea, the pressure sensor was inserted in to scala tympani through cochleostomy, and a flat polished optical fiber was irradiating spiral gangling neurons through the round window. (C, D) for ear canal pressure measurements, an angle polished optical fiber was inserted through a cochleostomy in the basal turn to deliver the laser pulses, and the microphone was placed in ear canal (only a part of microphone was shown in C). Using a red pilot light the orientation of the fiber could be identified that resulted in the irradiation of the cochlear wall by the identification of the red spot from the light (C).
For the ear canal pressure measurement, the optical fiber was inserted into ST through the cochleostomy. A sensitive calibrated microphone (ER-10C) was placed and secured with self-expanding material in the ear canal.
3) Acoustic Stimuli
Acoustical stimuli were clicks (50 μs in duration) and pure tone bursts (10 ms in duration, including rise and fall times of 1 ms). The first frequency for the pure tone stimuli was 32 kHz and was decreased in 2 steps per octave over 6 octaves. Sound levels at each frequency began at the loudest speaker output and were attenuated in steps of 5 dB. The voltage commands for the acoustic stimuli were generated using custom software and were delivered at a rate of 5 Hz to a Beyer DT770-Pro headphone. The sound level was calibrated with a Brüel and Kjær 1/8-inch microphone.
4) Optical Stimuli
Optical stimulation was achieved with a diode laser (Capella, Lockheed Martin Aculight Corp., Bothell, WA). The laser was operated in pulsed mode at 100 μs pulse duration (PW), and 5 Hz repetition rate (RR) with a wavelength of 1860 nm. For in vitro tests, the radiant energy per pulse (Q) was at the highest-level, which could be obtained for the given laser settings, about 164 μJ/pulse, and was changed from 0 to 164 μJ/pulse for the in vivo experiments. The radiant energy was measured in air at the tip of the optical fiber using the J50LP-1A energy sensor (Coherent, Santa Clara, CA). Flat- and angle-polished optical fibers (P200-5-VIS-NIR, Ocean Optics, Dunedin, FL) were used to deliver the infrared light to the target tissue.
5) Data Collection and Analysis
CAPs, pressure values were recorded simultaneously. CAP recording electrodes were connected to a differential amplifier (ISO-80, WPI, Sarasota, FL) with high-input impedance (> 1012 Ω). The signal was filtered using a band pass filter, 0.3 to 3 kHz. Responses to 100 stimulus presentations were averaged and saved. The sampling rate was 250 kHz. For acoustically evoked CAPs, recordings were taken both before and after creating the cochleostomy to monitor the effect of opening the cochlea. For pressure measurements with the pressure probe in the cochlea, the output from the photodiode was connected to a digital filter (Frequency Devices Inc., Ottawa, IL), with a filter range of 0.3 to 40 kHz. The results were further processed off line. Before a Fast Fourier transform (FFT) algorithm was applied the traces were high pass filtered (4 kHz). The pressure in the outer ear canal was measured with an ER-10C microphone. Responses were captured and stored directly to the computer without filtering. The amplifier gain of the ER-10C system was set at 20 dB.
III. Results
A. In vitro Experiments
1) Temperature Measurements
Temperature changes were measured in front of a 200 μm optical fiber while the laser delivered pulses at 5 Hz repetition rate, radiation wavelength λ =1860 nm, pulse length 1 ms, and radiant energy 1.5 mJ/pulse. To measure the temperature changes resulting from the laser pulse, a glass-micropipette was placed in front of the optical fiber. The pipette resistance scaled linearly with the temperature changes (calibration curve not shown). Fig. 3 shows a typical trace recorded at room temperature while a laser pulse was delivered. The temperature increased sharply and linearly up to 1.8 °C over the pulse duration, and decayed thereafter in an exponential fashion. The temperature did not fully returned to its starting value after 100 ms. At 1 ms pulse length, the delivery mode is thermally confined. In other words, it takes longer for the heat delivered by the laser pulse to be removed either through diffusion or convection than the pulse length [1–3, 26]. The time constant for the heat conduction was determined from the trace in Fig. 3 and was 34.6 ms. Similar results were obtained if the time constant was calculated using equations 6 and 8 from van Gemert and Welch, 1989 [5]. The equations consider both, the axial and the radial heat conduction time to calculate the time overall constant for the heat conduction. The calculated value is 35 ms, using the laser parameters as described before and taking the laser spot size of 350 μm as determined and published previously [24].
Fig. 3.
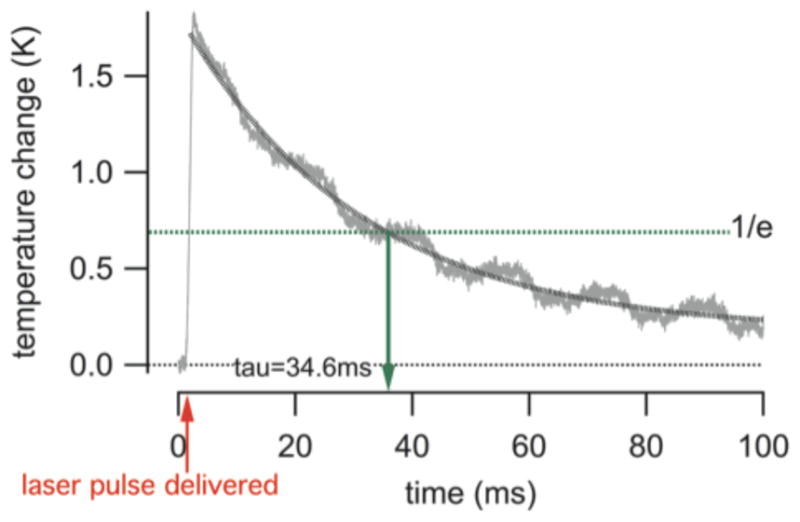
The trace shows the change in temperature during a laser pulse. The gray line shows the measured time course of the temperature and the black dotted line is an exponential fit to the data. The red arrow provides the time at which the laser pulse was delivered. The green broken line shows the 1/e decay in temperature. For the given laser parameter (λ =1860 nm, pulse length = 1 ms, pulse repetition rate = 5 Hz, and the radiant energy 1.5 mJ/pulse) and saline solution, tau (τ) was 34.6 ms. This is in good agreement with tau calculated according to [5].
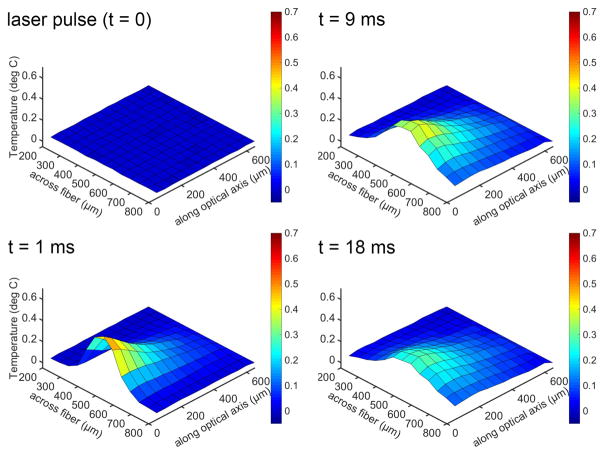
Measuring the temperature changes after the delivery of a laser pulse also allows reconstructing 2D and 3D representations, as shown in Fig. 4.
Fig. 4.
Temperature changes after the delivery of a laser pulse at different locations in front of the optical fiber. Sub-panels are taken at different time points following the laser pulse. The x-axis is the distance across the diameter of the optical fiber, with the center at 500 μm. The y-axis is the temperature change. The z-axis is the distance along the beampath, with the tip of the optical fiber at 0 μm. The heating provides a cone-like profile along the optical axis and is confined to the irradiated volume. The profile remains robust over the time course of the heating. Heat conduction in the radial and axial directions can be seen. Laser parameter for the experiments were: λ =1860 nm, pulse length = 1 ms, pulse repetition rate = 5 Hz, and the radiant energy 1.5 mJ/pulse.
2) Pressure Measurements in the Dish
The pressure generated by laser pulses in front of an optical fiber was measured in a dish. Fig. 5A shows a typical trace obtained from the pressure probe. The response from the sensor tip is extremely large while the tip of the sensor is within the beampath (see Fig. 5A, the red trace). The amplitude decreases significantly when the tip of the pressure probe is moved out of the beampath (see Fig. 5A, the black trace).
Fig. 5.
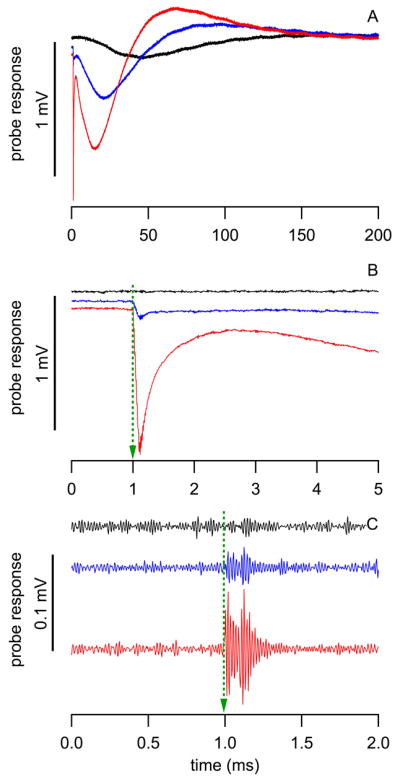
Responses from the pressure probe during measurements in the dish. Red: measured in the center (0 μm) of the optical fiber; blue: at the edge of the optical fiber (100 μm from center); and black: outside the optical fiber (200 μm from center). (A) shows the entire response, (B) and (C) are just after the delivery of the pulse. In (C) the slower component has been removed and the third component is visible from 1.0 to 1.1 ms (small ringing overlapped on each trace).
Three components could be identified. The first component occurs immediately after the onset of the laser pulse at 1.0 ms (see Fig. 5B). It is characterized by a rapid growing negative amplitude, which reached its minimum at the end of the laser pulse at 1.1 ms (see Fig. 5B, red and blue trace). The first component only occurred while pressure probe was directly irradiated. Consequently, its amplitude decreased significantly at the edge of the optical fiber (see Fig 5B, blue trace) and completely disappeared when the probe was outside the beampath (see Fig. 5B, black trace). From the time course and from its dependence on the position of the pressure probe in the beampath we suggest that direct heating of the pressure probe’s gold-coated membrane and the surrounding fluid generates this response.
The second component is a much slower response from the probe. The reading first dropped and eventually recovered after 150 ms. An exponential fit to the red trace between 15 and 64 ms has a τ of 28 ms and a similar fit to the blue trace between 21 and 100 ms has a τ of 35 ms, which is close to the heat relaxation time for the same laser configuration (see Fig. 3). Based on the time course of the response we suggest that the changes are caused by the dynamics of the heat dissipation.
The design of the sensor has to be considered too. The tip of all the pressure probes were sealed air tight at the end. Consequently, a certain volume of air gap exists at the tip of the pressure probe. During laser irradiation, surrounding water temperature changes will cause the air gap volume change, and then the sensor membrane deformation can occur. This assumption is supported by the finding that the amplitude of this component became much smaller or disappeared in non-sealed probes (data not shown).
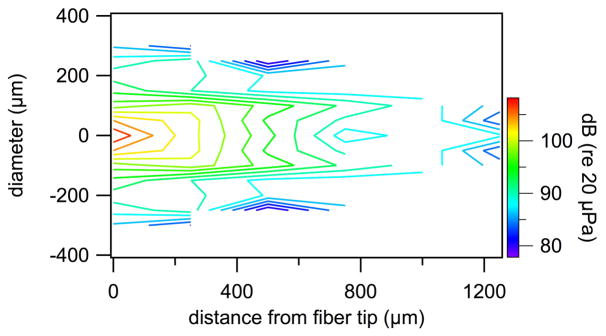
Close examination of the onset response of the pressure probe revealed a third component, which is a small high frequency vibration overlapped on the other two components (small ringing overlapped on each trace (see Fig. 5C). It was mapped in a dish for different locations in front of the optical fiber (see Fig. 6). This third component is considered as the pressure evoked by the laser pulse with a peak-to-peak value of about 0.1 mV, which is about 107 dB (re 20 μPa). The area where a pressure component could be measured was the largest in those three components. The spectral information of the probes’ responses is shown in Supplemental Information (SI), Fig. S1 and S2.
Fig. 6.
Contour plot of the pressure values measured in front of a 200 μm diameter optical fiber during laser operation (λ =1860 nm, PW=100 μs, RR=4 Hz, Q=164μJ/pulse). Significant pressure could only be measured in a confined volume in front of the fiber. Note, the pressure probe has limited sensitivity. The noise floor for the measurements is at about 80 dB (re 20μPa).
3) Pressure Measurements in the Cochlea
The measurements in the dish showed that the pressure sensor is sensitive to rapid changes in temperature, and hence, should not be directly irradiated. Seven cadaveric cochleae from guinea pigs were used to determine the intracochlear pressure. The pressure probe was inserted through a cochleostomy into either ST or SV. At the same time, the optical fiber was placed in front of the RW into SV or ST. The optical fiber and the pressure probe were placed using 3D micromanipulators. Hence, the distance between the fiber and the pressure probe could be controlled. Irradiation of the pressure probe was avoided by the orientation of the optical fiber relative to the pressure probe. Moreover, slow components in the response from the pressure probe were indications that the probe was in the beam path of the laser.
Since our pressure sensors were relative insensitive they could only reliably measure pressure values above 80 dB (re 20 μPa). To assure responses well above the noise floor, the laser was operated during the measurements at its highest possible output energy 164 μJ/pulse for a pulse length of 100 μs and a pulse repetition rate of 4 Hz. The resulting averaged pressure was 100 ± 4.2 dB (re 20 μPa, N=8) at different locations (Table 1). Spectral analysis of the responses showed that each cochlea had a “spectral finger print”. Detailed results are shown in Fig. S3 in SI. For three probes, #0118, #1030, and #0315 measurements were completed in both the cochlea and the dish using the same probe. The spectra obtained with those probes could be directly compared (see SI, Fig. S4). The cochlea modifies the spectral response of the laser induced pressure wave.
TABLE I.
Pressure measurements in cadaveric guinea pig cochleae
| Sensor Number | Pressure [dB] (re 20μPa) | ST basal cochleostomy | SV basal cochleostomy | RW |
|---|---|---|---|---|
| #0118 | 96 | sensor | - | optical fiber |
| #0119 | 96 | sensor | - | optical fiber |
| #1030 | 96 | optical fiber | sensor | - |
| #0315 | 101 | sensor | - | optical fiber |
| #WTp1 | 101 | optical fiber | sensor | - |
| #WTp2 | 106 | optical fiber | sensor | - |
| #WTp3 | 100 | optical fiber | sensor | - |
| #WTp3-2 | 106 | optical fiber | sensor | - |
B. In vivo Experiments
1) In vivo Measurements with the Pressure Sensor
Pressure measurements were conducted in vivo to confirm the data obtained in the cadaveric cochleae. Three out of eight sensor probes measurements obtained from two guinea pigs. The other measurements were rejected because the probe was mechanically damaged during the insertion into the cochlea or during the measurements and a post measurement calibration was not possible. Intracochlear pressure values and compound action potentials (CAPs) evoked by optical pulses or acoustic clicks were recorded and compared.
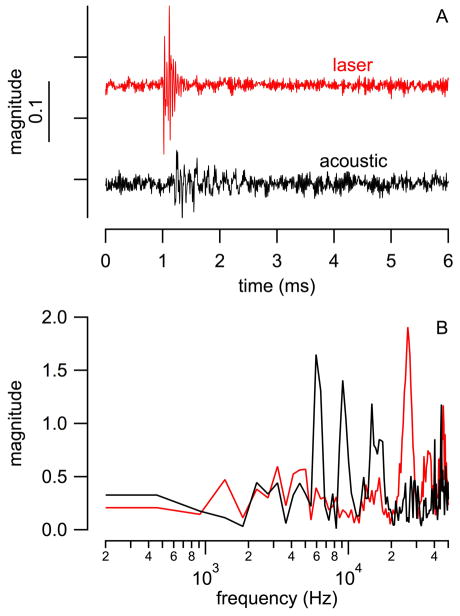
Fig. 7A shows the typical pressure, which was recorded with the pressure probe in scala tympani during stimulation with acoustic clicks (100 μs, delivered at 4 Hz, 86 dB (re 20 μPa) peak level) and with optical pulses (1860 nm wavelength, 100 μs pulse length, 4 Hz pulse repetition rate, 164 μJ/pulse radiant energy, delivered with a 200 μm optical fiber). The traces were high pass filtered and the pressure waveform evoked by acoustic clicks showed a complex pattern and clearly differed from that of optical stimulation. Again the Fourier analysis of the measured pressure values (see Fig. 7B) showed that the magnitude obtained from the acoustical clicks had maxima below 20 kHz, whereas the magnitude trace resulting from the laser pulses has maxima above 20 kHz. The contribution of frequencies below 4 kHz cannot be judged from the measurements with the pressure probe because of the filtering but it will be addressed below with the pressure measurements in the ear canal.
Fig. 7.
Direct comparison of pressure values of waves evoked by acoustic clicks and laser pulses in normal hearing guinea pig cochleae. (A) acoustic clicks were 50 μs with a peak level of 85 dB (re 20 μPa) and were delivered with a Beyer DT770Pro speaker to the outer ear canal. Laser pulses were delivered via a 200 μm diameter optical fiber (NA=0.22) into scala tympani. Laser parameter for the experiments were: λ =1860 nm, PW = 100 μs, RR = 4 Hz, and Q = 164μJ/pulse. (B) Traces in (A) were converted into the frequency domain using an FFT algorithm. The resulting magnitude plot shows a maximum at 48 kHz, which comes from a resonance of the pressure probe. The magnitude plot obtained from the laser trace shows a dominant maximum above 20 kHz, whereas the magnitude plot obtained from the speaker trace reveals several maxima below 20 kHz.
Levels for laser pulses and acoustical clicks were selected to evoke CAPs in a normal hearing animal with the same amplitude of 355 μV. The radiant energy was 164 μJ/pulse and the sound level for the acoustic clicks was 86 dB (re 20 μPa) peak-pressure in the ear canal. The sound level in the ear canal can be converted into a corresponding intracochlear pressure by applying the forward transfer function of the guinea pig middle ear [15]. The forward transfer function has a gain of 30 dB at 1 kHz [15].
2) Pressure in the Ear Canal during Laser Stimulation
Pressure changes in the cochlea can be measured in the outer ear canal with a sensitive microphone (see Fig. 8A). The middle ear reverse and forward transfer functions can be applied to determine the value of the corresponding pressure in the cochlea and to estimate the level of an acoustic stimulus in the outer ear canal that would results in a similar pressure in the cochlea.
Fig. 8.
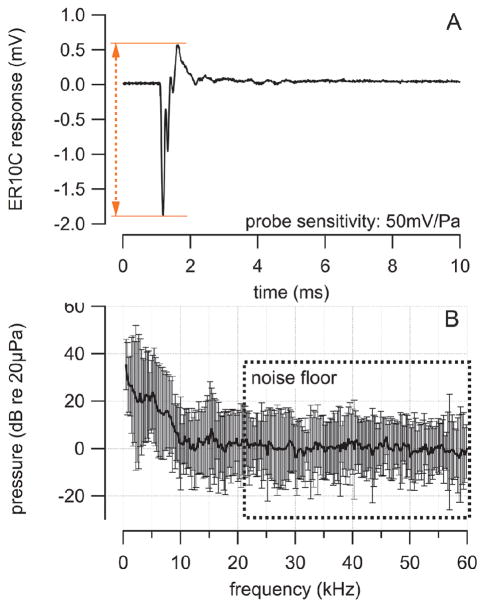
Results from pressure measurements in the outer ear canal during laser stimulation in the cochlea. The sampling rate was 250 kHz. (A) the trace shows the averaged pressure measured in the outer ear canal to 100 laser pulses. Laser pulses were delivered via a 200 μm diameter optical fiber (NA=0.22) into scala tympani. Laser parameter were: λ =1860 nm, PW = 100 μs, RR = 4 Hz, and Q = 164μJ/pulse. (B) A Fast Fourier Transform (FFT) algorithm was applied to convert the traces in (A) from their representation in the time domain into the corresponding representation in the frequency domain. The microphone only had a limited response rage below 20 kHz. Therefore the results above 20 kHz were used as the noise floor. Below 20 kHz a maximum can be seen at 15 kHz. Also the acoustic energy increases for frequencies below 10 kHz. The values are averages and their corresponding standard deviations.
In guinea pigs, the reverse transfer function from scala vestibuli is −35 dB at 1.5–8 kHz [14,15]. With the assumption that the pressure is between 96 and 106 dB (re 20 μPa) as measured directly in the cochlea, the expected value for the pressure to be measured in the ear canal should not be more than 106 dB (pressure in the cochlea) −35 dB (gain of the reverse middle ear transfer function) = 71 dB (re 20 μPa). Four guinea pigs were used to measure the pressure in the outer ear canal during laser stimulation in the cochlea. The CAPs resulting from the optical stimulation (oCAPs) were recorded simultaneously.
The pressure values recorded in the outer ear canal during laser stimulation were converted to a representation in the frequency domain using a Fast Fourier Transform (FFT) algorithm. The resulting averages and corresponding standard deviations are shown in Fig. 8B. The microphone only had a limited response rage below 20 kHz. Therefore, the results above 20 kHz were used as the noise floor. Below 20 kHz a maximum can be seen at 15 kHz. Also the acoustic energy increases for frequencies below 10 kHz.
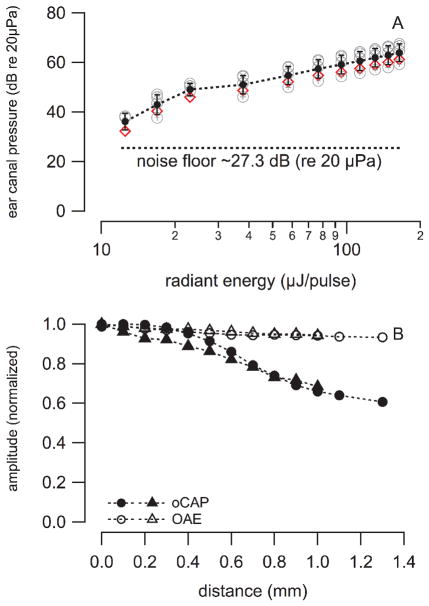
In the first set of measurements a flush polished optical fiber, 200 μm in diameter, was inserted into scala tympani of the cochlear basal turn, 200 μm away from the modiolus. The pressure in the ear canal was measured for increasing radiant energies. The pressure increased on average from 36 to 64 dB (re 20 μPa) when the radiant energy was changed from 12.5 to 164 μJ/pulse, respectively (see Fig. 9A). For guinea pigs, the stimulation threshold for INS was about 17 μJ/pulse. The corresponding PEC was on average 43.5 dB (re 20 μPa). With a guinea pig middle ear reverse transfer function of −35 dB, the pressure in cochlea should be on average 78.5 dB (re 20 μPa). A 5–10 dB difference exists between the forward and reverse middle ear transfer function [14, 15]. Therefor, the PEC required to generate a similar pressure in the cochlea as laser pulses at 17 μJ/pulse the sound level must be 43.5 + 10 = 53.5 dB (re 20 μPa).
Fig. 9.
(A) shows the decrease of the pressure in the ear canal (PEC) with decreasing stimulus level in 4 guinea pigs (circles) and 1 cat (diamonds). The dashed line between markers represents the average and standard deviation at each stimulation level. (B) shows the CAP peak-to-peak amplitude and the corresponding PEC. The values were normalized to the maximum pressure measured. The oCAP amplitudes dropped significantly when the distance between the target (spiral ganglion neurons in Rosenthal’s canal) and the optical fiber tip is bigger than the penetration depth of the laser light, which is about 700 μm, while PEC remains almost the same. The averaged sound pressure level measured in the cat outer ear canal was 60.6±1.3 dB (re 20μPa).
For the second set of experiments, the fiber was advanced until the tip made contact with the modiolus. This location is marked as distance 0. At this location laser pulses were delivered to the cochlea and the resulting pressure and the amplitude of the oCAP were recorded (see Fig. 9B).
Next, the fiber was retracted by 100 μm and another set of responses was recorded. The procedure was repeated until the tip of the optical fiber was close to the cochleostomy. The results show that the pressure in the ear canal (PEC) changed little, about 4 dB. It was 60.6 dB (re 20 μPa) during stimulation with the laser (λ = 1860 nm, PW = 100 μs, RR = 4 Hz; Q = 164 μJ/pulse). However, the amplitude of the oCAPs decreased with increasing distance of the optical fiber from the modiolus (see Fig. 9B).
In a third set of experiments, an angle polished fiber (45°) was used. The beampath beyond the optical fiber was no longer along the optical axis of the fiber but was perpendicular to it. For the measurements, the fiber was inserted along scala tympani of the guinea pigs basal cochlear turn, and was then rotated in steps of 90°. This allowed selectively irradiating, the cochlear wall, Rosenthal’s canal, or the basilar membrane at a selected site along the basilar membrane (see Fig. 10).
Fig. 10.
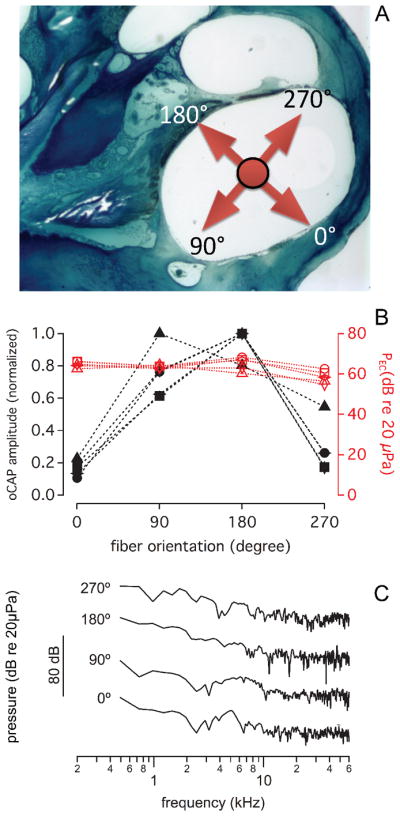
(A) shows the cross-section of a guinea pig basal turn. The arrows point into the major directions of the beampath. At 0° the beam points towards the cochlear wall. This orientation is initially adjusted while the pilot laser light is on (see also Fig. 1C). For the measurements the pilot light is off and infrared radiation is delivered. 90° points towards the cochlear wall, 180°, towards Rosenthal’s canal, and 270° towards the basilar membrane (B) shows that the normalized oCAP amplitude and the laser induced pressure in the ear canal varies with different laser beam orientations (λ =1860 nm, PW=100 μs, RR=4 Hz; Q=164 μJ/pulse). CAP amplitudes were normalized to the maximum value of one group. The pressure remains almost the same for all orientations. Unlike the ear canal pressure, the corresponding compound action potential amplitude evoked by the laser irradiation changed with the orientation of the optical fiber with a maximum when the beam was oriented towards Rosenthal’s canal. (C) shows the corresponding FFT traces obtained for the different orientations. The differences among the traces unlikely explain the differences in CAP responses.
The angle polished fiber allows easily changing the beampath towards different cochlear structures. For the measurements, the fiber was inserted into cochlea until contact was made with the cochlear wall. Next, the fiber was retracted by about 250 μm. To orient the fiber, a red laser pilot light was used. The fiber was rotated around its optical axis until a red spot could be seen at the basal turn of cochlear wall, through the microscope (see Fig. 2C). This position was marked as 0°, CAP responses and the resulting pressure in the ear canal were measured simultaneously for every 90° counterclockwise rotation of the fiber until a full turn was completed (see Fig. 10). The four orientations included the cochlear bony wall, the modiolus, the spiral gangling neurons, and the basilar membrane. After a full turn (360°), the orientation of the laser beam was back to the original location, and the CAP amplitude and the pressure in the ear canal were measured again. CAP amplitude differed for all the orientations. A maximum response was recorded when the radiation beam was oriented towards the spiral ganglion neurons, while minimum when the radiation beam was oriented towards the cochlear wall. Different from the CAP, the PEC, remained constant for all orientations (see Fig. 10), the PEC was on average 63.0 ± 3.5dB (N= 20; re 20 μPa). A frequency analysis of the response showed that the spectrum did not change drastically for the different orientations (see Fig. 10C).
IV. Discussion
In this study the intracochlear pressure during irradiation with an infrared laser was measured in vitro and in vivo. Results obtained from direct measurements with a pressure sensor were verified by pressure measurements in the ear canal. The results provide new insights for understanding the process of the laser stimulation in cochlea and its mechanism.
1) Laser Evoked Pressure: Comparison to Existing Data
The pressure during irradiation with infrared light was measured previously in air and in a swimming pool using a hydrophone [7]. The peak equivalent value for a radiant exposure of 350 mJ/cm2 in air was 62 dB (re 20 μPa) and was 31 mPa or 63.8 dB (re 20 μPa) in a swimming pool. The results of the present study in the cochlea are similar.
In guinea pigs, the directly measured intracochlear pressure during laser stimulation (λ = 1860 nm, PW = 100 μs, RR = 4 Hz, Q = 164 μJ/pulse) was between 96 and 106 dB (re 20 μPa). Radiant energy at threshold for neural stimulation is typically ten times less, 17 μJ/pulse [25]. The corresponding estimated pressure in the cochlea was 76 – 86 dB (re 20 μPa). With the assumption that the guinea pig middle ear transfer function has a gain of about 30 dB [14, 15], the corresponding pressure in the ear canal can be estimated to 46 – 56 dB (re 20 μPa).
For normal hearing animal, 56 dB (re 20 μPa) is not negligible. However, in animals with elevated thresholds this pressure is not sufficient to induce a response. Laser evoked CAP, therefore, is likely a combination of a direct radiation on the spiral ganglion neurons and a photomechanical effect on hair cells and/or basilar membrane.
2) Directional Sensitivity of the Stimulation
Our experiments with angle polished fibers show neural stimulation changes drastically with the orientation of the fiber and the direction of the resulting beam path. In normal hearing animals, we kept the radiation energy at the same level and rotated the laser beam to different orientations, the CAP amplitude changed significantly, while the PEC at the outer ear canal was not changing very much. The largest amplitude was recorded only if laser beam was directed towards the spiral ganglion neurons. The oCAP response was the smallest while the beam points to cochlear wall.
3) Mechanisms of INS
Advances have been made regarding the understanding of the mechanism of INS. Upon the absorption of the photon its energy is converted into heat [27]. Several mechanisms by which the heat is then converted into an action potential have been described. Temporally and spatially confined heating depolarizes the cell by changing the membrane capacitance [28–31]. It has also been demonstrated that heat sensitive transient receptor potential (TRP) cation channels are involved [32–35]. The most likely candidates from the TRP family are the vanilloid (TRPV) group. They are temperature sensitive and are highly calcium selective [36–45]. Others have demonstrated that intracellular calcium homeostasis is changed during INS [46–50]. In addition to the changes demonstrated, a more general effect on ion channels has been discussed [22, 27, 51, 52]. Spatially and temporally confined heating which occurs during INS also results in stress relaxation waves [7]. The dispute is whether the resulting pressure is the dominating effect in cochlear INS. Results have been presented where cochlear INS did not evoke responses in deaf animals [10, 12, 53], which differs from reports that showed responses in deaf animals missing hair cells [54, 55]. More detailed studies suggest direct stimulation of the neurons with the laser in deaf animals. Evidence for direct interaction between the radiation and the neurons also comes from single unit recordings done in the inferior colliculus [25] and masking experiments in the guinea pig [23]. Furthermore, INS is possible in mice lacking the vesicular glutamate transporter-3 (VGLUT3−/−) [56–58], which are congenitally deaf due to loss of glutamate release at the inner hair cell afferent synapse and in Atoh1f/kiNeurog1 mice [59, 60], which show no ABR response to acoustical stimuli (Tan et al. 2016, unpublished).
V. Conclusion
Our measurements have demonstrated and confirmed previous work showing that temperature changes in front of the optical fiber are less than two degrees Kelvin for laser parameter used for INS. The heating results in a measurable pressure wave. In cadaveric cochleae the outer ear canal equivalent pressure during laser stimulation was 36–56 dB (re 20 μPa) at threshold level radiant energies.
During laser stimulation with a side firing optical fiber, the compound action potential depended on the orientation of the optical fiber while the pressure generated by the laser pulse remained the same. For a deaf or partially deaf animal the pressure generated by the delivery of the infrared radiation should not interfere with INS.
Supplementary Material
Acknowledgments
Manuscript received XXXXXXX. C.-P. Richter is funded with Federal funds from the National Institute of Deafness and Other Communication Disorders, National Institutes of Health, Department of Health and Human Services, under Grant R01 DC011855. Dr. Hou and N. Xia are funded by the National Natural Science Foundation of China (No. 31271060, 31470953). Experiments were performed at Northwestern University Feinberg School of Medicine, Department of Otolaryngology.
We thank Drs. Olson and Carapezza from Columbia University for their assistance in building the pressure probe.
Contributor Information
N. Xia, Key Laboratory of Biorheological Science and Technology, Bioengineering College, Chongqing University, Chongqing 400044, China
X. Tan, Northwestern University Feinberg School of Medicine, Department of Otolaryngology, 303 E. Chicago Ave, Searle 12-561, Chicago, IL 60611, USA
Y. Xu, Northwestern University Feinberg School of Medicine, Department of Otolaryngology, 303 E. Chicago Ave, Searle 12-561, Chicago, IL 60611, USA
W. Hou, Key Laboratory of Biorheological Science and Technology, Bioengineering College, Chongqing University, Chongqing 400044, China
T. Mao, Northwestern University Feinberg School of Medicine, Department of Otolaryngology, 303 E. Chicago Ave, Searle 12-561, Chicago, IL 60611, USA
C.-P. Richter, Northwestern University Feinberg School of Medicine, Department of Otolaryngology, 303 E. Chicago Ave, Searle 12-561, Chicago, IL 60611, USA
References
- 1.Jacques SL. Laser-tissue interactions. Photochemical, photothermal, and photomechanical. Surg Clin North Am. 1992;72(3):531–58. doi: 10.1016/s0039-6109(16)45731-2. [DOI] [PubMed] [Google Scholar]
- 2.Welch AJ, van Gemert MJC. Optical-Thermal Response of Laser-Irradiated Tissue. 2. New York: Plenum Press; 2012. [Google Scholar]
- 3.Niemz MH SpringerLink (Online service) Biological and medical physics, biomedical engineering. Springer; Berlin: 2007. Laser-tissue interactions fundamentals and applications. [Google Scholar]
- 4.Jacques SL. Optical properties of biological tissues: a review. Phys Med Biol. 2013;58(11):R37–61. doi: 10.1088/0031-9155/58/11/R37. [DOI] [PubMed] [Google Scholar]
- 5.van Gemert MJC, Welch AJ. Time constant in thermal laser medicine. Lasers Surg Med. 1989;9:405–421. doi: 10.1002/lsm.1900090414. [DOI] [PubMed] [Google Scholar]
- 6.Hale GM, Querry MR. Optical Constants of Water in the 200-nm to 200-microm Wavelength Region. Appl Opt. 1973;12(3):555–63. doi: 10.1364/AO.12.000555. [DOI] [PubMed] [Google Scholar]
- 7.Teudt IU, et al. Acoustic events and “optophonic” cochlear responses induced by pulsed near-infrared laser. IEEE Trans Biomed Eng. 2011;58(6):1648–55. doi: 10.1109/TBME.2011.2108297. [DOI] [PMC free article] [PubMed] [Google Scholar]
- 8.Izzo AD, et al. Laser stimulation of the auditory nerve. Lasers Surg Med. 2006;38(8):745–53. doi: 10.1002/lsm.20358. [DOI] [PubMed] [Google Scholar]
- 9.Richter CP, et al. Optical stimulation of auditory neurons: effects of acute and chronic deafening. Hear Res. 2008;242(1–2):42–51. doi: 10.1016/j.heares.2008.01.011. [DOI] [PMC free article] [PubMed] [Google Scholar]
- 10.Schultz M, et al. Nanosecond laser pulse stimulation of the inner ear-a wavelength study. Biomed Opt Express. 2012;3(12):3332–45. doi: 10.1364/BOE.3.003332. [DOI] [PMC free article] [PubMed] [Google Scholar]
- 11.Schultz M, et al. Pulsed wavelength-dependent laser stimulation of the inner ear. Biomed Tech (Berl) 2012;57(Suppl 1) doi: 10.1515/bmt-2012-4339. [DOI] [PubMed] [Google Scholar]
- 12.Thompson AC, et al. Infrared neural stimulation fails to evoke neural activity in the deaf guinea pig cochlea. Hear Res. 2015;324:46–53. doi: 10.1016/j.heares.2015.03.005. [DOI] [PubMed] [Google Scholar]
- 13.Dalhoff E, Turcanu D, Gummer AW. Forward and reverse transfer functions of the middle ear based on pressure and velocity DPOAEs with implications for differential hearing diagnosis. Hear Res. 2011;280(1–2):86–99. doi: 10.1016/j.heares.2011.04.015. [DOI] [PubMed] [Google Scholar]
- 14.Magnan P, et al. Reverse middle-ear transfer function in the guinea pig measured with cubic difference tones. Hear Res. 1997;107(1–2):41–5. doi: 10.1016/s0378-5955(97)00015-4. [DOI] [PubMed] [Google Scholar]
- 15.Magnan P, et al. Intracochlear acoustic pressure measurements: transfer functions of the middle ear and cochlear mechanics. Audiol Neurootol. 1999;4(3–4):123–8. doi: 10.1159/000013830. [DOI] [PubMed] [Google Scholar]
- 16.Olson ES. Observing middle and inner ear mechanics with novel intracochlear pressure sensors. J Acoust Soc Am. 1998;103(6):3445–63. doi: 10.1121/1.423083. [DOI] [PubMed] [Google Scholar]
- 17.Ravicz ME, Olson ES, Rosowski JJ. Sound pressure distribution and power flow within the gerbil ear canal from 100 Hz to 80 kHz. J Acoust Soc Am. 2007;122(4):2154–73. doi: 10.1121/1.2769625. [DOI] [PMC free article] [PubMed] [Google Scholar]
- 18.Dong W, Olson ES. Two-tone distortion in intracochlear pressure. J Acoust Soc Am. 2005;117(5):2999–3015. doi: 10.1121/1.1880812. [DOI] [PMC free article] [PubMed] [Google Scholar]
- 19.Yao J, Liu B, Qin F. Rapid temperature jump by infrared diode laser irradiation for patch-clamp studies. Biophys J. 2009;96(9):3611–9. doi: 10.1016/j.bpj.2009.02.016. [DOI] [PMC free article] [PubMed] [Google Scholar]
- 20.Shapiro MG, et al. Infrared light excites cells by changing their electrical capacitance. Nat Commun. 2012;3:736. doi: 10.1038/ncomms1742. [DOI] [PMC free article] [PubMed] [Google Scholar]
- 21.Rajguru SM, et al. Optical cochlear implants: evaluation of surgical approach and laser parameters in cats. Hear Res. 2010;269(1–2):102–11. doi: 10.1016/j.heares.2010.06.021. [DOI] [PMC free article] [PubMed] [Google Scholar]
- 22.Richter CP, et al. Neural stimulation with optical radiation. Laser Photon Rev. 2011;5(1):68–80. doi: 10.1002/lpor.200900044. [DOI] [PMC free article] [PubMed] [Google Scholar]
- 23.Young HK, et al. Target structures for cochlear infrared neural stimulation. Neurophotonics. 2015;2(2):025002. doi: 10.1117/1.NPh.2.2.025002. [DOI] [PMC free article] [PubMed] [Google Scholar]
- 24.Richter CP, et al. Spread of cochlear excitation during stimulation with pulsed infrared radiation: inferior colliculus measurements. J Neural Eng. 2011;8(5):056006. doi: 10.1088/1741-2560/8/5/056006. [DOI] [PMC free article] [PubMed] [Google Scholar]
- 25.Tan X, et al. Radiant energy required for infrared neural stimulation. Sci Rep. 2015;5:13273. doi: 10.1038/srep13273. [DOI] [PMC free article] [PubMed] [Google Scholar]
- 26.Niemz MH. Laser Tissue interactions: fundamentals and application. 2. New York: Springer; 2004. [Google Scholar]
- 27.Wells J, et al. Biophysical mechanisms of transient optical stimulation of peripheral nerve. Biophys J. 2007;93(7):2567–80. doi: 10.1529/biophysj.107.104786. [DOI] [PMC free article] [PubMed] [Google Scholar]
- 28.Shapiro MG, et al. Infrared light excites cells by changing their electrical capacitance. Nature communications. 2012;3:736. doi: 10.1038/ncomms1742. [DOI] [PMC free article] [PubMed] [Google Scholar]
- 29.Liu Q, et al. Miniature post synaptic currents are entrained by infrared pulses. Abstr Assoc Res Otolaryngol. 2013;(36):464. [Google Scholar]
- 30.Okunade O, Santos-Sacchi J. IR laser-induced perturbations of the voltage-dependent solute carrier protein SLC26a5. Biophys J. 2013;105(8):1822–8. doi: 10.1016/j.bpj.2013.09.008. [DOI] [PMC free article] [PubMed] [Google Scholar]
- 31.Rabbitt RD, et al. Excitation and inhibition of semicircular canal type II hair cells by pulsed infrared light. Abstr Assoc Res Otolaryngol. 2016;39:PS64. [Google Scholar]
- 32.Albert ES, et al. TRPV4 channels mediate the infrared laser-evoked response in sensory neurons. Journal of neurophysiology. 2012;107(12):3227–34. doi: 10.1152/jn.00424.2011. [DOI] [PubMed] [Google Scholar]
- 33.Yao J, Liu B, Qin F. Rapid temperature jump by infrared diode laser irradiation for patch-clamp studies. Biophysical Journal. 2009;96(9):3611–9. doi: 10.1016/j.bpj.2009.02.016. [DOI] [PMC free article] [PubMed] [Google Scholar]
- 34.Rhee AY, et al. Photostimulation of sensory neurons of the rat vagus nerve. SPIE. 2008;6854:68540E1. [Google Scholar]
- 35.Suh E, et al. Optical stimulation in mice which lack the TRPV1 channel. Proc of SPIE. 2009;7180:71800S 1–5. [Google Scholar]
- 36.Güler AD, et al. Heat-evoked activation of the ion channel, TRPV4. J Neurosci. 2002;22(15):6408–6414. doi: 10.1523/JNEUROSCI.22-15-06408.2002. [DOI] [PMC free article] [PubMed] [Google Scholar]
- 37.Sladek CD, Johnson AK. Integration of thermal and osmotic regulation of water homeostasis: the role of TRPV channels. Am J Physiol Regul Integr Comp Physiol. 2013;305(7):R669–78. doi: 10.1152/ajpregu.00270.2013. [DOI] [PMC free article] [PubMed] [Google Scholar]
- 38.Santoni G, Farfariello V, Amantini C. TRPV channels in tumor growth and progression. Adv Exp Med Biol. 2011;704:947–67. doi: 10.1007/978-94-007-0265-3_49. [DOI] [PubMed] [Google Scholar]
- 39.Baylie RL, Brayden JE. TRPV channels and vascular function. Acta Physiol (Oxf) 2011;203(1):99–116. doi: 10.1111/j.1748-1716.2010.02217.x. [DOI] [PMC free article] [PubMed] [Google Scholar]
- 40.Kauer JA, Gibson HE. Hot flash: TRPV channels in the brain. Trends Neurosci. 2009;32(4):215–24. doi: 10.1016/j.tins.2008.12.006. [DOI] [PubMed] [Google Scholar]
- 41.Sharif-Naeini R, et al. Contribution of TRPV channels to osmosensory transduction, thirst, and vasopressin release. Kidney Int. 2008;73(7):811–5. doi: 10.1038/sj.ki.5002788. [DOI] [PubMed] [Google Scholar]
- 42.Jia Y, Lee LY. Role of TRPV receptors in respiratory diseases. Biochim Biophys Acta. 2007;1772(8):915–27. doi: 10.1016/j.bbadis.2007.01.013. [DOI] [PubMed] [Google Scholar]
- 43.Lee H, Caterina MJ. TRPV channels as thermosensory receptors in epithelial cells. Pflugers Arch. 2005;451(1):160–7. doi: 10.1007/s00424-005-1438-y. [DOI] [PubMed] [Google Scholar]
- 44.O’Neil RG, Heller S. The mechanosensitive nature of TRPV channels. Pflugers Arch. 2005;451(1):193–203. doi: 10.1007/s00424-005-1424-4. [DOI] [PubMed] [Google Scholar]
- 45.Gunthorpe MJ, et al. The diversity in the vanilloid (TRPV) receptor family of ion channels. Trends Pharmacol Sci. 2002;23(4):183–91. doi: 10.1016/s0165-6147(02)01999-5. [DOI] [PubMed] [Google Scholar]
- 46.Rajguru SM, et al. Inhibitory and Excitatory Vestibular Afferent Responses Induced By Infrared Light Stimulation of Hair Cells. 33rd Midwinter Meeting; Anaheim, CA: Association for Research in Otolaryngology; 2010. [Google Scholar]
- 47.Dittami GM, et al. Intracellular calcium transients evoked by pulsed infrared radiation in neonatal cardiomyocytes. The Journal of physiology. 2011;589(Pt 6):1295–306. doi: 10.1113/jphysiol.2010.198804. [DOI] [PMC free article] [PubMed] [Google Scholar]
- 48.Rajguru SM, et al. Infrared photostimulation of the crista ampullaris. The Journal of physiology. 2011;589(Pt 6):1283–94. doi: 10.1113/jphysiol.2010.198333. [DOI] [PMC free article] [PubMed] [Google Scholar]
- 49.Lumbreras V, et al. Pulsed infrared-evoked intracellular calcium transients in cultured neonatal spiral ganglion neurons. Abstr Assoc Res Otolaryngol. 2013;36:341. [Google Scholar]
- 50.Lumbreras V, et al. Pulsed infrared radiation excites cultured neonatal spiral and vestibular ganglion neurons by modulating mitochondrial calcium cycling. J Neurophysiol. 2014;112(6):1246–55. doi: 10.1152/jn.00253.2014. [DOI] [PMC free article] [PubMed] [Google Scholar]
- 51.Norton BJ, et al. Analytical approaches for determining heat distributions and thermal criteria for infrared neural stimulation. J Biomed Opt. 2013;18(9):098001. doi: 10.1117/1.JBO.18.9.098001. [DOI] [PubMed] [Google Scholar]
- 52.Richter CP, Tan X. Photons and neurons. Hear Res. 2014;311:72–88. doi: 10.1016/j.heares.2014.03.008. [DOI] [PMC free article] [PubMed] [Google Scholar]
- 53.Schultz M, et al. Pulsed wavelength-dependent laser stimulation of the inner ear. Biomedizinische Technik. Biomedical engineering. 2012;57(Suppl 1) doi: 10.1515/bmt-2012-4339. [DOI] [PubMed] [Google Scholar]
- 54.Izzo AD, et al. Laser stimulation of the auditory nerve. Laser Surg Med. 2006;38(8):745–753. doi: 10.1002/lsm.20358. [DOI] [PubMed] [Google Scholar]
- 55.Richter CP, et al. Optical stimulation of auditory neurons: effects of acute and chronic deafening. Hear Res. 2008;242(1–2):42–51. doi: 10.1016/j.heares.2008.01.011. [DOI] [PMC free article] [PubMed] [Google Scholar]
- 56.Obholzer N, et al. Vesicular glutamate transporter 3 is required for synaptic transmission in zebrafish hair cells. J Neurosci. 2008;28(9):2110–8. doi: 10.1523/JNEUROSCI.5230-07.2008. [DOI] [PMC free article] [PubMed] [Google Scholar]
- 57.Seal RP, et al. Sensorineural deafness and seizures in mice lacking vesicular glutamate transporter 3. Neuron. 2008;57(2):263–75. doi: 10.1016/j.neuron.2007.11.032. [DOI] [PMC free article] [PubMed] [Google Scholar]
- 58.Ahnert-Hilger G, Jahn R. Into great silence without VGLUT3. Neuron. 2008;57(2):173–4. doi: 10.1016/j.neuron.2008.01.009. [DOI] [PubMed] [Google Scholar]
- 59.Jahan I, et al. Neurog1 can partially substitute for Atoh1 function in hair cell differentiation and maintenance during organ of Corti development. Development. 2015;142(16):2810–21. doi: 10.1242/dev.123091. [DOI] [PMC free article] [PubMed] [Google Scholar]
- 60.Jahan I, et al. Expression of Neurog1 instead of Atoh1 can partially rescue organ of Corti cell survival. PLoS One. 2012;7(1):e30853. doi: 10.1371/journal.pone.0030853. [DOI] [PMC free article] [PubMed] [Google Scholar]
Associated Data
This section collects any data citations, data availability statements, or supplementary materials included in this article.


