

Abstract
Meaningful words in English need vowels to break up the sounds that consonants make. The Nature has encoded her messages in RNA molecules using only four alphabets A, U, C and G in which the nine member double-ring bases (adenine (A) and Guanine (G)) are purines, while the six member single-ring bases (cytosine (C) and uracil (U)) are pyrimidines. Four bases A, U, C and G of RNA sequences are divided into three kinds of classifications according to their chemical properties. One of the three classifications, the purine-pyrimidine class is important. In understanding the distribution (organization) of purines and pyrimidines over some of the non-coding RNAs, all miRNAs of the three species (human, gorilla and chimpanzee) of Hominidae family and two species (mouse and rat) from of Muridae family are considered. The distribution of purines and pyrimidines over miRNA shows deviation from randomness. Based on the quantitative metrics (fractal dimension, Hurst exponent, Hamming distance, distance pattern of purine-pyrimidine, density distribution of purine-pyrimidine and Shannon entropy) five different clusters have been made for the five species. We have observed some couple of results including the closeness of different clusters among the five species.
Introduction
The deoxyribonucleic acid (DNA) and the ribonucleic acid (RNA) are made of nucleotides (A/T or U/C/G), the monomer-units of nucleic acids. Nucleotides are grouped into three different classes based on their chemical properties, i.e., purine group R = {A, G} and pyrimidine group Y = {C, T/U}; amino group M = {A, C} and keto group K = {G, T/U}; strong H-bond group S = {C, G} and weak H-bond group W = {A, T/U}1. There are two kinds of nitrogen-containing bases - Purines and Pyrimidines, first isolated from hydrolysates of nucleic acids, were identified using classical methods of organic chemistry. An important contribution was made by Emil Fischer who must be credited with the earliest synthesis of purines (1897)2. Purines consist of a nine member double-ring (containing carbon and nitrogen) fused together, where as pyrimidines have a six member single-ring comprising of carbon and nitrogen3,4. Among three biological properties namely purine/pyrimidine, strong/week hydrogen bond and amino/keto, our analysis demonstrates a strong evidence that the organization of purine-pyrimidine bases over miRNAs is crucial. Therefore, we intend to understand the organization of the two chemical bases purine and pyrimidine over some of the non-coding RNAs, microRNAs using different mathematical parameters.
MicroRNAs (abbreviated miRNAs) contain about 18–25 ribonucleotides that can play important gene regulatory roles by pairing to the messages of protein-coding genes, to specify messenger RNA (mRNA) cleavage or repression of productive translation5–7. miRNA genes are one of the more abundant classes of regulatory genes in animals, estimated to comprise between 0.5 and 1 percent of the predicted genes in worms, flies, and humans, raising the prospect that they could have many more regulatory functions than those uncovered to date8–10. The main function of miRNAs is to down-regulate gene expression11. One miRNA may target several mRNAs, and a particular mRNA might be regulated by multiple miRNAs12–17. It is important to identify the miRNA targets accurately. miRNAs control gene expression by targeting mRNAs and triggering either translation repression or RNA degradation18–20. Their aberrant expression may be involved in various human diseases, including cancer21–27. miRNA regulatory mechanisms are complex and there is still no high-throughput and low-cost miRNA target screening technique28–32. It is an well known fact that each miRNA is potentially able to regulate around 100 or more target mRNAs and 30% of all human genes are regulated by miRNAs33.
In this article an attempt has been made to decipher the patterns of purine and pyrimidine distributions over the miRNAs of the three species human, gorilla and chimpanzee from Homonidae family and two species mouse and rat from Muridae family. We desire to understand how the purine and pyrimidine bases are organized over the sequence and how much distantly the purine or pyrimidine bases can be placed over the sequence. Which one of these two types of chemical bases purine or pyrimidine dominates the other in terms of their frequency density over the sequence is one of our prime aims to comprehend. A simple binomial distribution (i.e. location independent occurrence of the bases) fails to describe the observed variation of purine and pyrimidine. This encourages us to look for further patterns. We investigate, the self-organization of the purine and pyrimidine bases for all the miRNAs of the five species human, gorilla, chimpanzee, mouse and rat through the fractal dimension of the indicator matrix. The auto correlation of purine-pyrimidine bases over the miRNAs through the parameter Hurst exponent is determined and found many of the miRNAs having identical auto correlations even if their purine-pyrimidine organization is different. All the miRNAs are compared about their nearness based on their purine-pyrimidine distribution, Hamming distance is employed among all the miRNAs in understanding the nearness of purine-pyrimidine organization. The purine-pyrimidine distance patterns including the frequency distribution have been found for all the miRNAs for all the five species. All possible distinct patterns of frequency distribution are determined for all the miRNAs of all the five species. Here we wish to bring attention to the reader that through our investigation, the one miRNA hsa-miR-6124 MIMAT0024597 of human, made of only purine bases is identified. There is no miRNA (human, gorilla, chimpanzee, mouse and rat) which is absolutely made of pyrimidines. In order to understand the association among miRNAs and their target mRNAs, we take a set of mRNAs from human species. Based on the quantitative measures, we have examined the set of miRNAs which relates the associations with the target mRNAs.
Materials and Methods
Dataset Specification
From the MiRBase (a miRNA database: http://www.mirbase.org/ (Release 21))34, from the family Hominidae, total of 2588 mature miRNAs of human, 357 mature miRNAs of gorilla and 587 mature miRNAs of chimpanzee and from the family Muriade, total of 1915 mature miRNAs of mouse and 765 miRNAs of rat are taken. Each miRNA of human, gorilla, chimpanzee, mouse and rat are encoded as numbers starting from h1 to the total number of sequences h2588 for miRNAs of human and same has been made for miRNAs of gorilla g1 to g357, for miRNAs of chimpanzee p1 to p587, for miRNAs of mouse m1 to m1915 and for miRNAs of rat r1 to r765 (Supplementary Table S1). We then transform the miRNAs sequences (A, U, C, G) into binary sequences (1’s and 0’s) according to the following rules:
That means purine and pyrimidine nucleotide bases are encoded as 1 and 0 respectively into the transformed binary sequences of miRNAs. Therefore, presently we have five datasets of binary sequences from the five species human, gorilla, chimpanzee, mouse and rat. All the computational codes are written in MATLAB R2016a software. One can easily obtain the results of the discussed methods of this article for any datasets, the detailed procedures are discussed and also we have provided the source codes (MATLAB 2016 onwards) in Supplementary Table S2.
Fractal Dimension of Indicator Matrices
Here we shall encode each binary sequences into its indicator matrices35,36. It is noted that there are several other techniques for finding fractal dimension and self-organization structure of DNA sequences37,38. Consider a set S = {0, 1} and an indicator function f : {0, 1} × {0, 1} ↔ {0, 1} is defined as for all (x, y) ∈ S × S,
| 1 |
This indicator function can be used to obtain the binary image of the binary sequence as a two dimensional dot-plot. The binary image obtained by this indicator matrix can be used to visualize the distribution of ones and zeros within the same binary sequence and some kind of auto-correlation between the ones and zeros of the same sequence. It can be easily drawn by assigning a black dot to 1 and a white dot to 0. An example of indicator matrix is shown in Fig. 1 for the binary sequence Hsa−miR−576−3pMIMAT0004796: 1111010111111100111100.
Figure 1.

Indicator matrix for the binary sequence Hsa−miR−576−3pMIMAT0004796: 1111010111111100111100.
From the indicator matrix, we can have an idea of the “fractal-like” distribution of ones and zeros (purines and pyrimidines). The fractal dimension for the graphical representation of the indicator matrix plots can be computed as the average of the number p(n) of 1 in the randomly taken n × n minors of the N × N indicator matrix. Using p(n), the fractal dimension (FD) is defined below.
| 2 |
The self-organization of the purine and pyrimidine bases for all the miRNAs can be obtained through the fractal dimension of the indicator matrix.
Hurst Exponent of Binary Sequences
The Hurst Exponent (HE) deciphers the autocorrelation of a time series appeared in several areas of applied mathematics39–41. Hurst exponent ranges from 0 to 1. A value of HE in the interval [0, 0.5] indicates a time series with negatively autocorrelated and a value of HE in the interval [0.5, 1] indicates a time series with positively autocorrelated. A value of HE = 0.5 indicates a random series, there is no correlation of the variable with its past value. The larger the HE value is the stronger the correlation.
The Hurst exponent of a binary sequence {xn} is defined as
| 3 |
where and R(n) = maxY (i, n) − minY (i, n); 1 ≤ i ≤ n where and
The auto correlation of purine-pyrimidine bases for all the miRNAs is obtained through the Hurst exponent.
Hamming Distance of Binary Sequences
The Hamming Distance (HD) between two binary strings is the number of bits in which they differ42–44. Since length of the miRNAs might differ and hence a special care has been taken into consideration. Suppose there are two miRNAs Sn and Sm of length n and m respectively (n > m), then
| 4 |
where Sm of length m window is sliding over Sn from the left alignment to the right alignment and each time hamming distance (hd) is calculated, and finally minimum hd value is taken as hamming distance HD of two binary sequences.
For example, take two binary sequences Sn = 010100 and Sm = 1101, now sliding of Sm over Sn of length 4, from left to right alignment of these two sequences, we find the hamming distances are hd(010100,1101) = 1, hd(010100,1101) = 3, hd(010100,1101) = 2, therefore we take HD = 1 (minimum) of these two binary sequences. Finding the minimum hamming distance of the two binary sequences says about the maximum similarity of two sequences over the distribution of purines and pyrimidines. The minimum value of HD = 0 when the pattern of length min(n, m) of two binary sequences of miRNAs are exactly identical i.e. similar distribution of purines and pyrimidines over the miRNAs of the two sequences and the maximum value of HD = min(n, m) when the pattern of length min(n, m) of two binary sequences of miRNAs are exactly opposite i.e. completely dissimilar distribution of purines and pyrimidines over miRNAs two sequences.
To get the nearness of the miRNAs based on their purine-pyrimidine distribution, minimum Hamming distance is deployed.
Distance pattern of purine and pyrimidine over miRNAs
Here we are exploring the distance pattern of purines bases across the miRNAs of five species. How sparsely (closely) purine bases are placed over the miRNAs. So we find the distance (gap) between purine bases to the immediate next purine base over the miRNA sequences.
For example, take a transformed binary sequence Sm = 110100111000001, where 1 indicates the purines bases and 0 indicates pyrimidine bases in the sequence. From left to right the positions of 1’s and 0’s in serial is shown in Table 1. Now, from the distribution of 1’s, we find the purine distances at 1 (two consecutive 1’s at a distance of 1: 11), 2 (two consecutive 1’s at a distance of 2: 101), 3 (two consecutive 1’s at a distance of 3: 1001) and 6 (two consecutive 1’s at a distance of 6: 1000001). So, the distance pattern of purines (Purine-Distance pattern(Pu-Dp)) over the sequence is [1-2-3-6] in order.
Table 1.
The position of each bit (1/0) of transformed binary sequence of Sm = 110100111000001 from left to right.
| Positions | 1 | 2 | 3 | 4 | 5 | 6 | 7 | 8 | 9 | 10 | 11 | 12 | 13 | 14 | 15 |
| Sequence | 1 | 1 | 0 | 1 | 0 | 0 | 1 | 1 | 1 | 0 | 0 | 0 | 0 | 0 | 1 |
Similar to the distance pattern of purine (Pyrimidine-Distance pattern(Py-Dp)), the distance pattern of pyrimidine bases (0’s) across the miRNAs also can be determined. The distance pattern of pyrimidines of the above sequence is [1-2-4] in order. Further the distance pattern of pyrimidines [1 2 4] of a miRNA opens up a fact that there is at least one 1(=2−1) and at least one 3(=4−1) length purine blocks present in the miRNA. In the similar way, a distance pattern of purine triggers the presence of pyrimidine blocks in miRNAs. If there is no distance pattern of purine (or pyrimidine) i.e. miRNA is made of only the pyrimidine (or purine) bases respectively, we denote the distance pattern of purine (or pyrimidine) as [−] and if the miRNA is having a single purine (or pyrimidine) base, we denote the distance pattern of purine (or pyrimidine) as [0].
Shannon entropy of miRNAs
The Shannon entropy (SE) mesures information-entropy of a Bernoulli process with probability p of the two outcomes (0/1)45–47. It is defined as
| 5 |
where and ; here l is length of the binary string and k is the number of 1’s in the binary string of length l.
The binary Shannon entropy is a measure of the uncertainty in a binary string. Whenever the probability p = 0, the event is certain never to occur, and so there is no uncertainty, leading to an entropy of 0. Similarly, if the probability p = 1, the result is certain, so the entropy must be 0. When p = 1/2, the uncertainty is at a maximum and consequently the SE is 145.
Results
Deviation from randomness
A simple random binomial (p, q) model48, where each entries can either be purine (or pyrimidine) with probability p (or q = 1 − p) fails to address the distribution of purine or pyrimidine over miRNAs. We can calculate the mean () of the distribution from the sample. If we divide the sample mean by the average sample size (n) we get a probability p. From this probability, we can calculate the expected variance npq. We can also calculate the variance for m number of samples x1, x2, …, xm using . The standard deviation (std) is the square root of the variance.
For purine, in human p = 0.509, gorilla p = 0.514, chimpanzee p = 0.505, mouse p = 0.495 and rat p = 0.473 from mean. So, expected std = 2.323 (human), 2.322 (gorilla), 2.327 (chimpanzee), 2.340 (mouse) and 2.325 (rat).
The sample std = 3.42 (human), 2.64 (gorilla), 2.79 (chimpanzee), 3.48 (mouse) and 2.79 (rat).
So here we see that in all five species the expected variances through binomial distribution are significantly smaller than what we would have expected from the sample.
Classification Based on FDs of Indicator Matrices
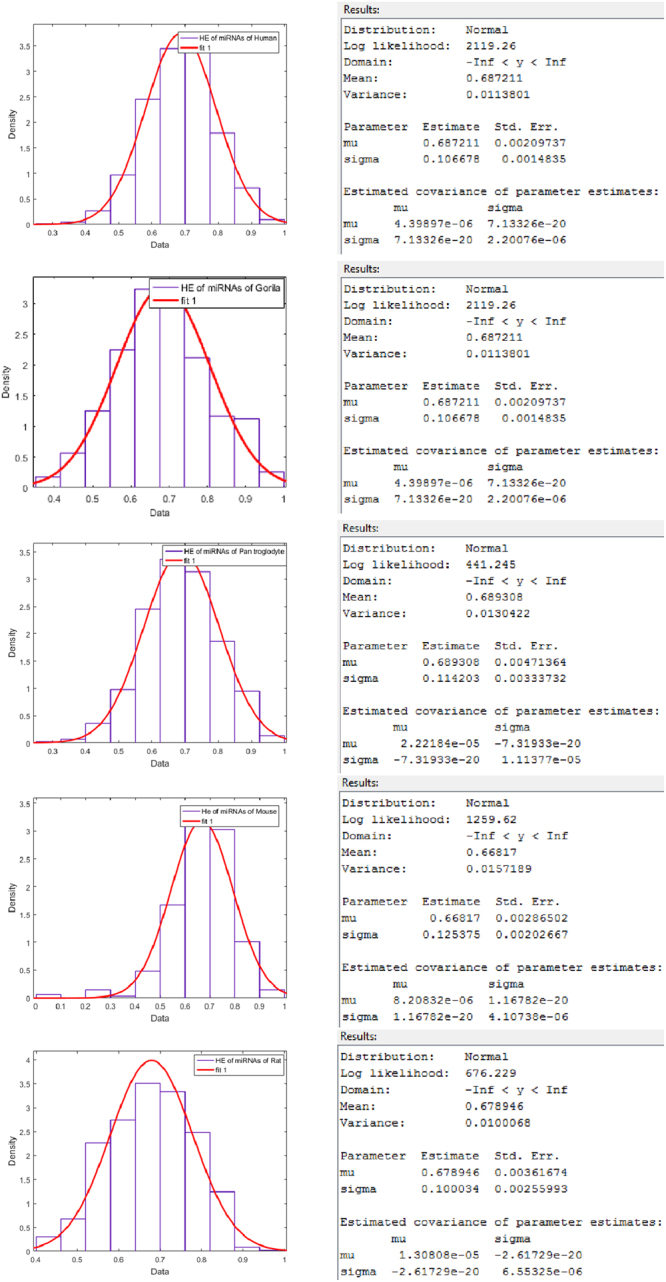
For each binary sequence of miRNA of human, gorilla, chimpanzee, mouse and rat, the fractal dimension (using Equation (2)) is calculated. Based on the fractal dimension, we have made classifications (clusters) for all the the datasets of the five species. There are 10 clusters of miRNAs of each species as shown in Table 2. The fractal dimensions including the histograms of all the miRNAs of human, gorilla, chimpanzee, mouse and rat are plotted in the Fig. 2. Also a normal distribution fitting is also made as shown in Fig. 3.
Table 2.
Clusters based on Fractal dimension of miRNAs of Human, Gorilla and Chimpanzee, Mouse and Rat.
| Cluster | Human | Gorilla | Chimpanzee | Mouse | Rat | |||||
|---|---|---|---|---|---|---|---|---|---|---|
| Frequency | Center | Frequency | Center | Frequency | Center | Frequency | Center | Frequency | Center | |
| 1 | 48 | 1.529 | 124 | 1.568 | 19 | 1.5451 | 28 | 1.544 | 23 | 1.546 |
| 2 | 731 | 1.568 | 151 | 1.600 | 255 | 1.5771 | 743 | 1.578 | 368 | 1.578 |
| 3 | 931 | 1.607 | 45 | 1.631 | 189 | 1.6092 | 503 | 1.612 | 190 | 1.610 |
| 4 | 394 | 1.646 | 13 | 1.662 | 54 | 1.6413 | 246 | 1.647 | 93 | 1.642 |
| 5 | 222 | 1.685 | 12 | 1.693 | 37 | 1.6734 | 160 | 1.681 | 42 | 1.675 |
| 6 | 137 | 1.724 | 7 | 1.724 | 12 | 1.7055 | 106 | 1.716 | 29 | 1.707 |
| 7 | 80 | 1.763 | 3 | 1.756 | 12 | 1.7375 | 73 | 1.750 | 13 | 1.739 |
| 8 | 26 | 1.802 | 0 | 1.787 | 4 | 1.7696 | 30 | 1.785 | 4 | 1.771 |
| 9 | 14 | 1.841 | 0 | 1.818 | 2 | 1.8017 | 20 | 1.819 | 1 | 1.803 |
| 10 | 5 | 1.880 | 2 | 1.849 | 3 | 1.8338 | 6 | 1.854 | 2 | 1.835 |
Figure 2.
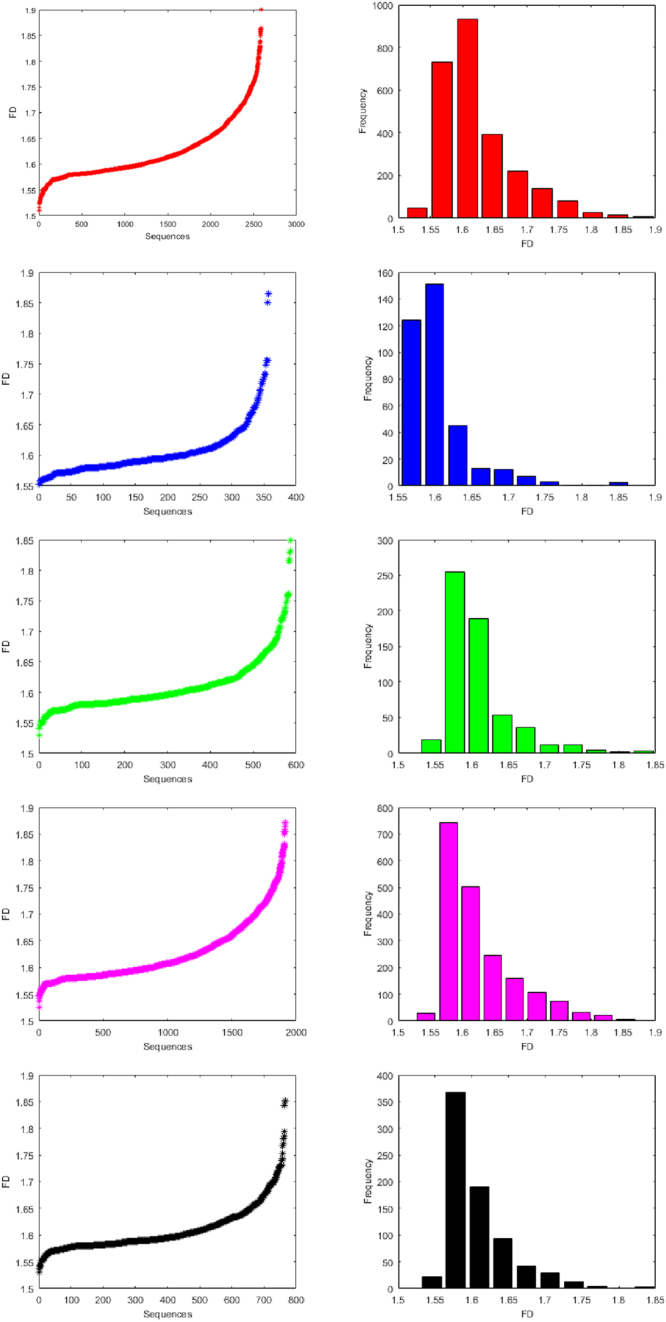
Histograms of fractal dimensions of miRNAs of Human, Gorilla, Chimpanzee, Mouse and Rat from top to bottom respectively.
Figure 3.

Normal distribution fitting over FDs of miRNAs of Human, Gorilla, Chimpanzee, Mouse and Rat from top to bottom respectively.
The detail members (miRNAs) of the clusters using FDs for human, gorilla, chimpanzee, mouse and rat are given in the Supplementary Table S3. It is observed that the FD of miRNAs of human lies in the interval [1.50, 1.9] and the largest cluster (center at 1.60) contains 931 miRNAs, whereas the FD of miRNAs of gorilla lies in the interval [1.55, 1.86] with the largest cluster (center at 1.60) of miRNAs of gorilla that contains 151 miRNAs and the FD of miRNAs of chimpanzee lies in the interval [1.52, 1.84] with the largest cluster (center at 1.58) that contains 255 miRNAs. For the species mouse and rat, it is found that the FD of miRNAs of mouse lies in the interval [1.52, 1.87] and the largest cluster (center at 1.57) contains 743 miRNAs. The FD of miRNAs of rat lies in the interval [1.53, 1.85] and the largest cluster (center at 1.57) contains 368 miRNAs. It is worth mentioning that all the four intervals of FDs of the four species (except human) are contained in the interval of FD [1.50, 1.9] of human.
The centers of largest FD clusters of miRNAs of human, gorilla are approximately same (1.60) that reflect they are evolutionarily close. Further, the centers of largest clusters of miRNAs of chimpanzee, mouse and rat are approximately same (1.57) which is a reflection of the fact that chimpanzee, mouse and rat species are evolutionarily close. It is noted that there is no miRNAs of gorilla whose FD lies in between 1.76 and 1.84 whereas there are approximately 72 miRNAs of human and 7 miRNAs of chimpanzee whose FD lies in the said interval. There are clusters (for human, gorilla and chimpanzee, mouse and rat) with largest centers among the other centers of the clusters contain 5, 2, 3, 6 and 2 members respectively.
Classification Based on HEs
For each binary sequence of miRNA of human, gorilla, chimpanzee, mouse and rat, the Hurst exponent (using Equation (3)) is determined and then a classification is made which is shown in Table 3 for all the species. The Hurst exponents and the histograms of all the miRNAs five species are plotted in the Fig. 4. Also a normal distribution fitting is also made as shown in Fig. 5.
Table 3.
Clusters based on Hurst exponent of miRNAs of Human, Gorilla, Chimpanzee, Mouse and Rat.
| Cluster | Human | Gorilla | Chimpanzee | Mouse | Rat | |||||
|---|---|---|---|---|---|---|---|---|---|---|
| Frequency | Center | Frequency | Center | Frequency | Center | Frequency | Center | Frequency | Center | |
| 1 | 3 | 0.301 | 7 | 0.404 | 1 | 0.309 | 11 | 0.048 | 16 | 0.445 |
| 2 | 11 | 0.371 | 13 | 0.463 | 4 | 0.377 | 0 | 0.144 | 36 | 0.500 |
| 3 | 50 | 0.441 | 28 | 0.522 | 17 | 0.446 | 20 | 0.240 | 102 | 0.554 |
| 4 | 173 | 0.510 | 50 | 0.581 | 40 | 0.514 | 11 | 0.336 | 107 | 0.609 |
| 5 | 430 | 0.580 | 69 | 0.640 | 103 | 0.583 | 74 | 0.432 | 158 | 0.664 |
| 6 | 600 | 0.650 | 62 | 0.699 | 123 | 0.651 | 224 | 0.528 | 147 | 0.718 |
| 7 | 671 | 0.720 | 61 | 0.758 | 134 | 0.719 | 584 | 0.624 | 101 | 0.773 |
| 8 | 405 | 0.790 | 30 | 0.817 | 87 | 0.788 | 618 | 0.720 | 76 | 0.827 |
| 9 | 168 | 0.859 | 12 | 0.876 | 57 | 0.856 | 305 | 0.816 | 20 | 0.882 |
| 10 | 76 | 0.929 | 25 | 0.935 | 21 | 0.925 | 68 | 0.912 | 2 | 0.936 |
Figure 4.

Histograms of Hurst exponents of miRNAs of Human, Gorilla, Chimpanzee, Mouse and Rat from top to bottom respectively.
Figure 5.
Normal distribution fitting over HEs of miRNAs of Human, Gorilla, Chimpanzee, Mouse and Rat from top to bottom respectively.
The detail members (miRNAs) of the clusters for human, gorilla, chimpanzee, mouse and rat are given in the Supplementary Table S4. The HE of miRNAs of human lies in the interval [0.26, 0.96] and the largest cluster (center at 0.72) contains 671 miRNAs whereas the HE of miRNAs of gorilla lies in the interval [0.37, 0.96] and HE of miRNAs of chimpanzee in the interval [0.27, 0.96]. The largest cluster (center at 0.64) of miRNAs of gorilla contains 69 members and the same (center at 0.72) contains 134 miRNAs of chimpanzee. The HE of miRNAs of mouse lies in the interval [0.0, 0.96] and the largest cluster (center at 0.72) contains 618 miRNAs. The HE of miRNAs of rat lies in the interval [0.41, 0.96] and the largest cluster (center at 0.66) contains 158 miRNAs.
The centers of the largest HE clusters in the case of human, chimpanzee and mouse are close enough where as the center of the largest cluster of miRNAs of gorilla and rat is significantly different from other three species unlike FD as stated in the above section. It interprets basically the long range autocorrelations of miRNAs of gorilla and rat are significantly different from the miRNAs of human, chimpanzee and mouse. Therefore with regards to the centers of the largest HE clusters, we observed two sets of evolutionarily close species: human, chimpanzee and mouse (HE ≈ 0.72) belong to one set and, gorilla and rat belong to another set (HE ≈ 0.65).
Classification Based on HDs
The detail pairs of miRNAs based on minimum Hamming distances (using Equation (4)) of human, gorilla, chimpanzee, mouse and rat are given in the Supplementary Tables S5, S6, S7, S8 and S9 respectively. We then form classes of pairs of the binary strings (miRNAs) of the five species based on Hamming distances 0 to 22 with the percentages of each class as shown in Table 4. The bar plots of these class-frequencies are also given the Fig. 6.
Table 4.
Clusters based on minimum Hamming distance of miRNAs of Human, Gorilla, Chimpanzee, Mouse and Rat.
| H. Distance | Human | Gorilla | Chimpanzee | Mouse | Rat | |||||
|---|---|---|---|---|---|---|---|---|---|---|
| N. of Pairs | % | N. of Pairs | % | N. Pairs | % | N. Pairs | % | N. of Pairs | % | |
| 0 | 3768 | <1 | 557 | <1 | 763 | <1 | 2719 | <1 | 805 | <1 |
| 1 | 2602 | <1 | 206 | <1 | 330 | <1 | 2034 | <1 | 158 | <1 |
| 2 | 10620 | <1 | 244 | <1 | 572 | <1 | 4934 | <1 | 462 | <1 |
| 3 | 39956 | 1 | 436 | <1 | 1264 | <1 | 13496 | <1 | 1872 | <1 |
| 4 | 119160 | 2 | 1154 | 1 | 4052 | 1 | 39704 | 1 | 6990 | 1 |
| 5 | 276592 | 4 | 3274 | 3 | 10996 | 3 | 100152 | 3 | 18498 | 3 |
| 6 | 505864 | 8 | 7370 | 6 | 23074 | 7 | 211352 | 6 | 38632 | 7 |
| 7 | 760868 | 11 | 14014 | 11 | 38752 | 11 | 367670 | 10 | 63188 | 11 |
| 8 | 960910 | 14 | 19714 | 15 | 51488 | 15 | 525746 | 14 | 84410 | 14 |
| 9 | 1042752 | 16 | 23076 | 18 | 56794 | 16 | 617676 | 17 | 95526 | 16 |
| 10 | 971648 | 15 | 20408 | 16 | 53210 | 15 | 594428 | 16 | 91106 | 16 |
| 11 | 781550 | 12 | 15476 | 12 | 41256 | 12 | 469378 | 13 | 73542 | 13 |
| 12 | 549660 | 8 | 9930 | 8 | 28722 | 8 | 324030 | 9 | 50378 | 9 |
| 13 | 339810 | 5 | 5844 | 5 | 17082 | 5 | 198398 | 5 | 30910 | 5 |
| 14 | 186330 | 3 | 3144 | 2 | 9332 | 3 | 108954 | 3 | 16364 | 3 |
| 15 | 89458 | 1 | 1444 | 1 | 4244 | 1 | 52832 | 1 | 7702 | 1 |
| 16 | 37768 | 1 | 720 | 1 | 1728 | 1 | 21986 | 1 | 3178 | 1 |
| 17 | 13404 | <1 | 284 | <1 | 646 | <1 | 7930 | <1 | 1068 | <1 |
| 18 | 3918 | <1 | 144 | <1 | 200 | <1 | 2388 | <1 | 328 | <1 |
| 19 | 900 | <1 | 6 | <1 | 54 | <1 | 784 | <1 | 90 | <1 |
| 20 | 174 | <1 | 2 | <1 | 8 | <1 | 402 | <1 | 18 | <1 |
| 21 | 32 | <1 | 2 | <1 | 2 | <1 | 184 | <1 | — | — |
| 22 | — | — | — | — | — | — | 48 | <1 | — | — |
Here number of pairs for each hamming distance and the corresponding percentage (approx.) are shown.
Figure 6.

Bar plots of miRNAs of Human, Gorilla, Chimpanzee, Mouse and Rat based on hamming distances from top to bottom respectively.
For all the species except rat, none of the clusters with Hamming distances from 0 to 21 is empty. In the case of mouse only, there are 48 pairs of miRNAs having HD = 22. It is also seen that the largest clusters with HD 9 for miRNAs of human, gorilla, chimpanzee, mouse and rat contain 1042752, 23076, 56794, 617676 and 95526 number of pairs respectively. It interprets that the arrangement of the purine and pyrimidine bases for most of miRNAs of human, gorilla, chimpanzee, mouse and rat are differed by 9 bases only.
Classification Based on Distance Pattern of Purine and Pyrimidine
For all the miRNAs of five species, the distance patterns between purine bases to the next immediate purine bases are obtained. There are 174, 47, 68, 168 and 99 clusters based on unique distinct patterns of purine bases distance (gap) of miRNAs of human, gorilla, chimpanzee, mouse and rat are shown in Supplementary Table S10. For an example, the pattern of purine distances in the miRNAs of h421 of human is [1-2-3-4-12] of which is interpreted as there are purine bases which are 1, 2, 3, 4 and 12 bases apart. The bar plot of different clusters frequencies (number of miRNAs) for the five species human, gorilla, chimpanzee, mouse and rat are plotted in Fig. 7.
Figure 7.
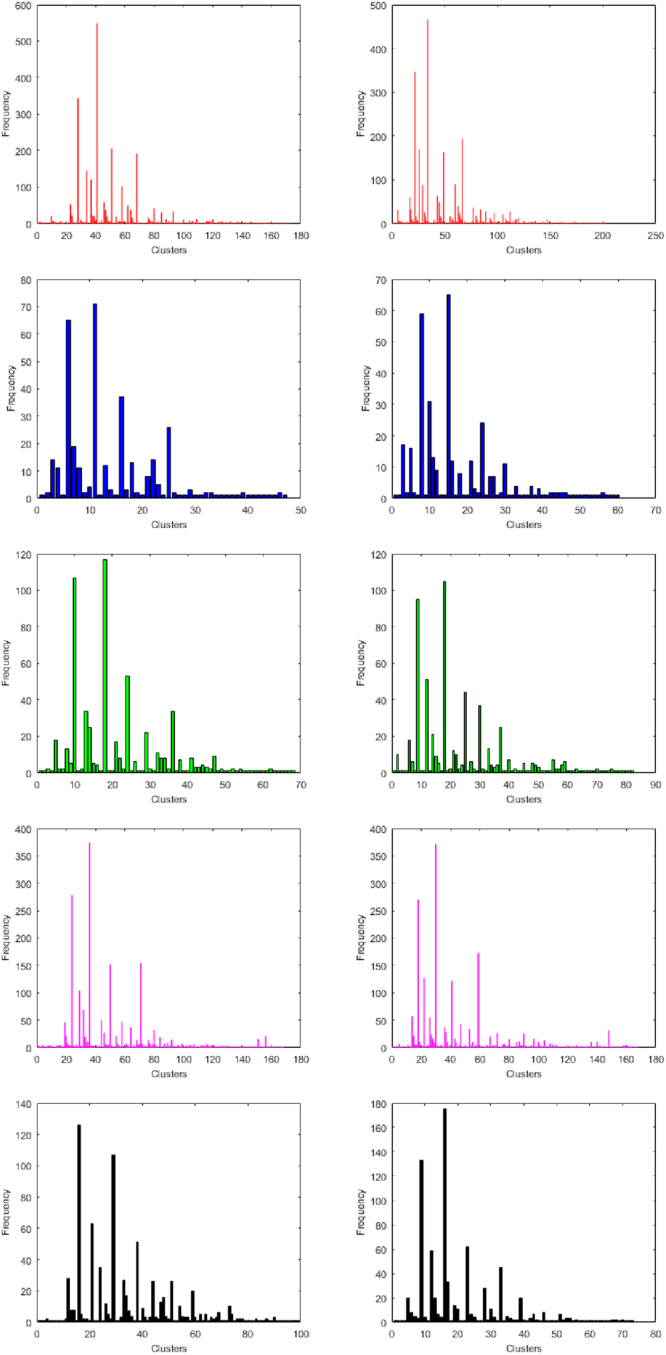
Bar plots of purine (on top) and pyrimidine (on bottom) distances of miRNAs of Human, Gorilla, Chimpanzee, Mouse and Rat from left to right respectively.
It is found that most of the miRNAs have purine distance patterns [1-2-3] and [1-2-3-4]. There are exactly 549 and 343 many miRNAs of human, 71 and 65 miRNAs of gorilla, 117 and 107 miRNAs of chimpanzee, 374 and 278 miRNAs of mouse, 107 and 126 of miRNAs of rat for the purine distance pattern [1-2-3] and [1-2-3-4] respectively. There is no miRNAs of gorilla, chimpanzee and rat having purine distance pattern [1]. In all the five cases, it is noted that there are several clusters having only one member which means that the miRNA of those clusters have unique purine distance pattern. In the similar fashion, for all the miRNAs of human, gorilla, chimpanzee, mouse and rat, the distance between pyrimidine bases to the next immediate pyrimidine bases are found, which is tabulated in the Supplementary Table S10. The maximum length of the purine and pyrimidine distance patterns is found to be 5 for all the five sets of miRNAs except only five miRNAs of human.
We also have determined the density of purine and pyrimidine bases of the miRNAs of human, gorilla, chimpanzee, mouse and rat as presented in detail in the Supplementary Table S11. If the length of the miRNA is 20 (20 nt) in which number of purine bases (1’s) is 8 and number of pyrimidine bases (0’s) is 12, then the density of purine is 0.4 and density of pyrimidine is 0.6. The clusters based on the density of purine is made and tabulated in Table 5 for all the species. The histogram of the frequencies density for purine bases of all species are given in Fig. 8.
Figure 8.
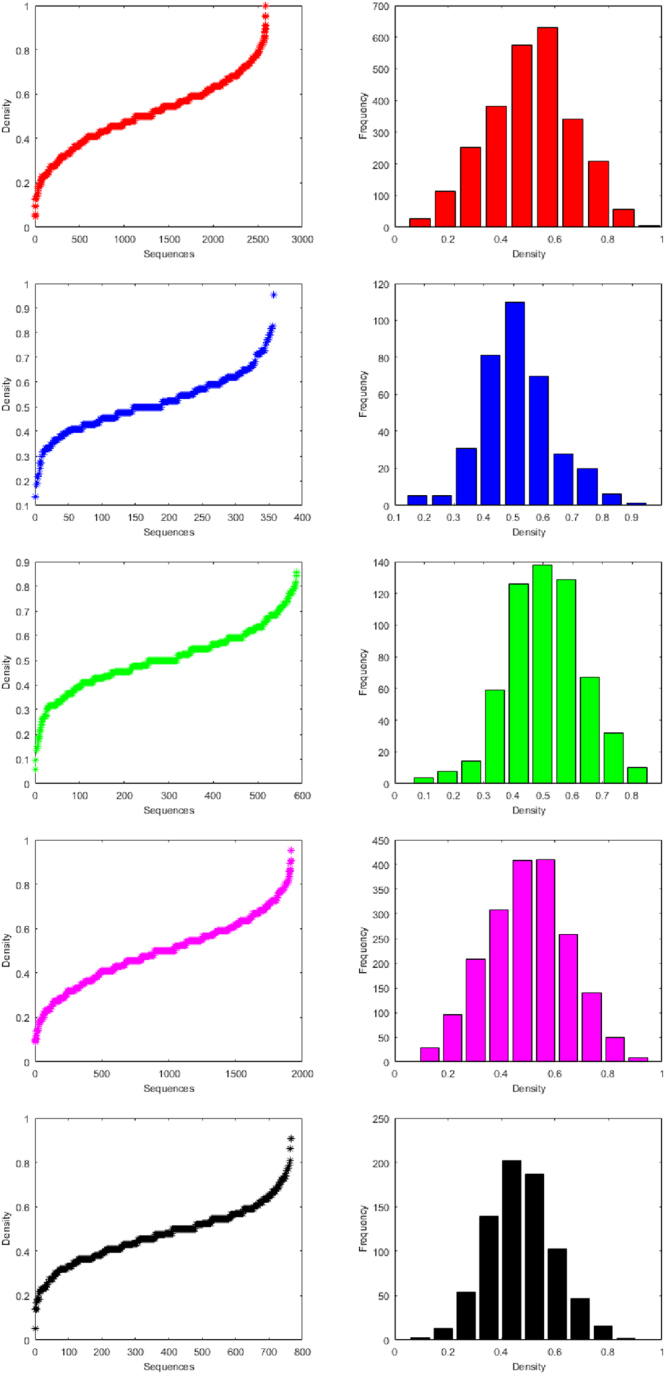
Histograms of frequency of Density for purine bases of the miRNAs of Human, Gorilla, Chimpanzee, Mouse and Rat from top to bottom respectively.
Classification Based on SEs
For all the miRNAs of the five species, the Shannon entropy (using Equation (5)) is calculated of which detail can be seen in the Supplementary Table S12. In the case of miRNAs of human, there are exactly 80 distinct SE values are obtained whereas in the case of miRNAs of gorilla, chimpanzee, mouse and rat there are 38, 57, 73 and 55 respectively distinct SEs are found. Based on the Shannon entropy, the miRNAs of the five species are classified into 10 clusters separately as shown in the Table 6. The histograms of SEs of all the miRNAs of human, gorilla, chimpanzee, mouse and rat are plotted in the Fig. 9.
Table 5.
Clusters based on Density (Purine) of miRNAs of Human, Gorilla, Chimpanzee, Mouse and Rat.
| Cluster | Human | Gorilla | Chimpanzee | Mouse | Rat | |||||
|---|---|---|---|---|---|---|---|---|---|---|
| Frequency | Center | Frequency | Center | Frequency | Center | Frequency | Center | Frequency | Center | |
| 1 | 27 | 0.095 | 5 | 0.177 | 4 | 0.099 | 29 | 0.130 | 3 | 0.095 |
| 2 | 114 | 0.190 | 5 | 0.259 | 8 | 0.179 | 96 | 0.217 | 13 | 0.181 |
| 3 | 253 | 0.286 | 31 | 0.341 | 14 | 0.258 | 209 | 0.304 | 54 | 0.267 |
| 4 | 381 | 0.381 | 81 | 0.423 | 59 | 0.338 | 308 | 0.391 | 139 | 0.352 |
| 5 | 575 | 0.476 | 110 | 0.505 | 126 | 0.418 | 408 | 0.477 | 202 | 0.438 |
| 6 | 628 | 0.571 | 70 | 0.586 | 138 | 0.498 | 410 | 0.564 | 187 | 0.524 |
| 7 | 340 | 0.667 | 28 | 0.668 | 129 | 0.578 | 258 | 0.651 | 102 | 0.609 |
| 8 | 208 | 0.762 | 20 | 0.750 | 67 | 0.658 | 139 | 0.738 | 47 | 0.695 |
| 9 | 57 | 0.857 | 6 | 0.832 | 32 | 0.737 | 50 | 0.824 | 16 | 0.781 |
| 10 | 5 | 0.952 | 1 | 0.914 | 10 | 0.817 | 8 | 0.911 | 2 | 0.866 |
Figure 9.

Histograms of Shannon entropy (purine and pyrimidine) Human, Gorilla, Chimpanzee, Mouse and Rat from top to bottom respectively.
It is observed that most of the miRNAs of all the species human, gorilla, chimpanzee, mouse and rat are having Shannon entropy centered at 0.96 which is the largest center of the clusters for all the three different clustering, which contain 1977, 300, 446, 1296 and 597 miRNAs respectively. It is seen that there is no member having SE 0.5 of all the miRNAs in all the five species human, gorilla, chimpanzee, mouse and rat. It interprets that none of the miRNAs is having equal (approximately) purine-pyrimidine density over the sequences. Overall these observations draw an impression that almost none of the miRNAs of all the five species are having random-like purine-pyrimidine distributions.
Discussion
The purine and pyrimidine analysis with the binomial distribution shows the purines and pyrimidines are not independently distributed over the miRNAs and there is a tendency of same properties (purine or pyrimidine) to repeat in a miRNA. We find the various classes using different methods where most of the cases the classes are normally distributed although the distribution of the purines and pyrimidines is not random like distribution.
There are 5 miRNAs of human in the cluster 10 based on fractal dimension as shown in the Table 2 having maximum FD. We have seen closely those sequences and find that three of them (h2248, h1954 and h2552) are pyrimidine rich sequences (94%, 90% and 90% respectively) and the other two (h1835 and h1291) are purine rich sequences (95% and 100%) as shown in Table 7. In the case of miRNAs of gorilla, chimpanzee, mouse and rat the cluster 10 contains 2, 3, 6 and 2 miRNAs respectively. All these miRNAs of gorila, chimpanzee, mouse and rat are either purine or pyrimidine rich as shown in Table 7. Based on the observations here we strongly suggest that whenever the amount of purine or pyrimidine is quite high in a miRNA sequence, then the corresponding FD will be maximum.
Table 6.
Clusters based on Shannon entropy of miRNAs of Human, Gorilla, Chimpanzee, Mouse and Rat.
| Cluster | Human | Gorilla | Chimpanzee | Mouse | Rat | |||||
|---|---|---|---|---|---|---|---|---|---|---|
| Frequency | Center | Frequency | Center | Frequency | Center | Frequency | Center | Frequency | Center | |
| 1 | 1 | 0.303 | 1 | 0.303 | 1 | 0.357 | 1 | 0.303 | 1 | 0.333 |
| 2 | 0 | 0.377 | 0 | 0.377 | 1 | 0.424 | 0 | 0.377 | 0 | 0.403 |
| 3 | 4 | 0.450 | 0 | 0.450 | 0 | 0.492 | 12 | 0.450 | 1 | 0.473 |
| 4 | 1 | 0.523 | 0 | 0.523 | 4 | 0.560 | 6 | 0.523 | 3 | 0.543 |
| 5 | 9 | 0.597 | 1 | 0.597 | 3 | 0.628 | 24 | 0.597 | 1 | 0.614 |
| 6 | 29 | 0.670 | 6 | 0.670 | 7 | 0.695 | 51 | 0.670 | 10 | 0.684 |
| 7 | 65 | 0.743 | 9 | 0.743 | 17 | 0.763 | 82 | 0.743 | 24 | 0.754 |
| 8 | 179 | 0.817 | 12 | 0.817 | 30 | 0.831 | 152 | 0.817 | 44 | 0.824 |
| 9 | 323 | 0.890 | 28 | 0.890 | 78 | 0.898 | 291 | 0.890 | 84 | 0.895 |
| 10 | 1977 | 0.963 | 300 | 0.963 | 446 | 0.966 | 1296 | 0.963 | 597 | 0.965 |
There are several clusters having miRNAs for human, gorilla, chimpanzee, mouse and rat with the same HEs. The density distribution of purine and pyrimidine are balanced for all such miRNAs having same HEs. For an example, we took 17 miRNAs from the cluster 7 of miRNAs of human based on Hurst exponent (h463, h526, …, h1824 and h2202) which are all having the same HE (0.714484) as shown in the Table 8. It is found that the density distributions of purine and pyrimidine are 60% and 40% (or 40% and 60%) respectively. It is also seen that these 17 miRNAs of human belong to same cluster 3 based on fractal dimension. It is observed that there are 0.8% miRNAs of human, 1.1% of gorilla, 0.68% of chimpanzee, 0.67% of mouse and 0.4% of rat miRNAs which are having the same HE (0.5) indicating a completely uncorrelated purine and pyrimidine spatial ordering over the miRNAs. This investigation reassures that the miRNAs for all the five species are deviating from randomness. It is also noted that there are exactly 11 miRNAs only of mouse having zero Hurst exponent that interprets those 11 miRNAs are having consecutive purines (pyrimidines) and pyrimidines (purines).
Table 7.
MiRNAs (from the cluster-10 based on fractal dimension) and its density distribution of miRNAs of the five species.
| Encripted Name | miRNAs sequence | Purine Density | Pyrimidine Density |
|---|---|---|---|
| h2248 | UGCCCUCCUUUCUUCCCUC | 0.053 | 0.947 |
| h1954 | CUUCUCUUCUCUCCUUCCCAG | 0.095 | 0.905 |
| h2552 | UCCUCUUCUCCCUCCUCCCAG | 0.955 | 0.045 |
| h1835 | AAGACGGGAGGAAAGAAGGGAG | 0.095 | 0.905 |
| h1291 | GGGAAAAGGAAGGGGGAGGA | 1 | 0 |
| g67 | ACGCCCUUCCCCCCCUUCUUCA | 0.14 | 0.86 |
| g12 | AAGACGGGAGGAAAGAAGGGAG | 0.95 | 0.045 |
| p527 | UCGCCUCCUCCUCUCCC | 0.05 | 0.95 |
| p460 | CCUCUUCCCCUUGUCUCUCCA | 0.095 | 0.905 |
| p205 | ACGCCCUUCCCCCCCUUCUUCA | 0.14 | 0.86 |
| m1110 | ACGCCCUUCCCCCCCUUCUUCA | 0.14 | 0.86 |
| m1606 | UCUCUCCUUUCUCCUCCUAG | 0.1 | 0.9 |
| m1871 | UUUCUUCUCUUCCCUUUCAG | 0.1 | 0.9 |
| m1105 | AAAAGGGAGAGAAAGAAAUGC | 0.905 | 0.095 |
| m1091 | AAGACGGGAGAAGAGAAGGGAG | 0.95 | 0.045 |
| m768 | UGUCCUCUUCUCCCUCCUCCCA | 0.091 | 0.909 |
| r711 | GGUCUUGUUUGGGUUUGUU | 0.052 | 0.947 |
| r455 | ACAACAACACCAAACCACCUGA | 0.909 | 0.091 |
Now we see the miRNAs of human having identical distance patterns of purine and pyrimidine. It is observed that there are very few numbers of miRNAs of human which are having identical distance pattern of purine and pyrimidine. For example, h61 miRNA is having identical distance pattern of purine and pyrimidine [1-2]. Also There are miRNAs h36, h51, h62, h83, h122 and h2584 having identical distance pattern of purine and pyrimidine [1-2-3]. There are miRNAs of gorilla g6, g13, g19, g20 and g21 having identical distance pattern of purine and pyrimidine [1-2-3-4]. In the set of miRNAs of chimpanzee, there are p55, p84, p106, p119 and p138 having identical purine and pyrimidine distance pattern [1-2-3-4]. Similar distance patterns are also seen in the miRNAs of mouse and rat. These identical distance patterns of purine and pyrimidine make a guarantee that there are purine and pyrimidine blocks of same length.
There are 142, 58, 92, 126 and 88 distinct densities of purine and pyrimidine bases across miRNAs of human, gorilla, chimpanzee, mouse and rat are found. Out of 2588 miRNAs of human, 194 miRNAs of human having equal density (0.5), 1121 miRNAs of human having lesser density (less than 0.5) of purines than that of pyrimidine, 1273 miRNAs of human having higher density (greater than 0.5) of purine than that of pyrimidine. This infers density of pyrimidine is richer than that of purine over the set of miRNAs of human. It is found that there are 43 miRNAs out of 357 miRNAs of gorilla, 67 out of 587 miRNAs of chimpanzee, 154 out of 1915 miRNAs of mouse and 69 out of 765 miRNAs of rat having equal density (0.5) of purine and pyrimidine. There are 146 miRNAs over 357 miRNAs of gorilla, 268 miRNAs over 587 miRNAs of chimpanzee, 893 miRNAs over 1915 miRNAs of mouse and 411 miRNAs over 765 of rat having lesser density of purines than that of pyrimidine. In this regard we infer that the densities of pyrimidine over the miRNAs of these five observed species is richer than that of the purine bases. Out of all the 2588 miRNAs, the miRNA hsa-miR-6124 MIMAT0024597 (h1291) is only miRNA containing all purine bases.
The evolutionary closeness among the species utilizing five parameters are shown in Table 9. For an example, the mean of FDs of 2588 miRNAs of human is 1.62 which is approximately same as for 1915 miRNAs of mouse. So, these two close species ({Human, Mouse}) are put in one set. Further, the mean of FDs of miRNAs of the species gorilla, chimpanzee and rat are close (≈1.60), so they are put in another set. Similarly, we have shown the close species based on the largest cluster center of each parameter in Table 9 as discussed in Result section.
Table 8.
MiRNAs (from the cluster-7 based on Hurst exponent) and its FD with the density distribution of miRNAs of Human.
| miRNAs of human | HE | FD | Purine Density | Pyrimidine Density |
|---|---|---|---|---|
| h463 | 0.714483912 | 1.611 | 0.409 | 0.591 |
| h526 | 0.714483912 | 1.608 | 0.409 | 0.591 |
| h1655 | 0.714483912 | 1.615 | 0.591 | 0.409 |
| h1733 | 0.714483912 | 1.608 | 0.591 | 0.409 |
| h2161 | 0.714483912 | 1.612 | 0.591 | 0.409 |
| h2219 | 0.714483912 | 1.604 | 0.591 | 0.409 |
| h262 | 0.714483912 | 1.599 | 0.591 | 0.409 |
| h515 | 0.714483912 | 1.588 | 0.591 | 0.409 |
| h747 | 0.714483912 | 1.592 | 0.409 | 0.591 |
| h782 | 0.714483912 | 1.590 | 0.591 | 0.409 |
| h1040 | 0.714483912 | 1.583 | 0.409 | 0.591 |
| h1061 | 0.714483912 | 1.583 | 0.591 | 0.409 |
| h1240 | 0.714483912 | 1.604 | 0.591 | 0.409 |
| h1348 | 0.714483912 | 1.590 | 0.591 | 0.409 |
| h1680 | 0.714483912 | 1.586 | 0.409 | 0.591 |
| h1824 | 0.714483912 | 1.582 | 0.591 | 0.409 |
| h2202 | 0.714483912 | 1.586 | 0.409 | 0.591 |
It is reported that MiR-200 (star miRNAs) is a family of tumour suppressor miRNAs consisting of five members (miR-200a-3p/h609, miR-200b-3p/h888, miR-200c-3p/h1520, miR-200a-429/h1670, miR-141-3p/h515), which are significantly involved in inhibition of epithelial-to-mesenchymal transition (EMT), repression of cancer stem cells (CSCs) self-renewal and differentiation, modulation of cell division and apoptosis, and reversal of chemoresistance21 as shown in Table 10 along with other four miRNAs of miR-200a-5p/h1449, miR-200b-5p/h1677, miR-200c-5p/h2186 and miR-141-5p/h328. We have chosen all these nine miRNAs of human including other miRNAs of human which are 0, 1 and 2 Hamming distance apart from those nine miRNAs.
Table 9.
The set of evolutionarily close species based on mean quantitative value and largest cluster center of the discussed parameters. Pu-Purine.
| Parameters | Close species w.r.t mean quantitative value | Close species w.r.t largest cluster Center |
|---|---|---|
| FD | {Human, Mouse} and {Gorilla, Chimpanzee, Rat} | {Human, Gorilla} and {Chimpanzee, Mouse, Rat} |
| HE | {Human, Gorilla, Chimpanzee} | {Human, Chimpanzee, Mouse} and {Gorilla, Rat} |
| HD | {Gorilla, Chimpanzee} | {Human, Chimpanzee, Rat} |
| Density of Pu | {Human, Chimpanzee} | {Human, Mouse} and {Gorilla, Chimpanzee} |
| SE | {Human, Mouse} and {Gorilla, Chimpanzee, Rat} | {Human, Gorilla, Chimpanzee, Mouse, Rat} |
The FDs of five star miRNAs are almost similar except h1520 whose FD is slightly greater than the other four miRNAs. But the HEs are varying for all the five miRNAs. It is found that h888 is 1 Hamming distance apart from h609 and h1520 although h609 and h1520 are 2 Hamming distance apart. The miRNA h888 is having approximately same HD, HE and density of purine and pyrimidine bases with the miRNAs h609 and h1520. Hence we convict that h888 might also work as h609 and h1520 do. It is also observed that h1670 is 2 HD apart from the miRNAs h609 and h515 and the miRNA h1670 is showing very closeness as per quantitative measures and hence this miRNA h1670 would function as h609 and h515 do. As closeness is a transitive property (HD follows transitive inequality, HD(a, b) + HD(b, c) ≥ HD(a, c)), we can conclude that h888 could also function as h1670 (HD(h888, h1670) = 3). There are two miRNAs of human h1449 and h1677 which are 0 Hamming distance apart with same quantitative measures and hence we firmly propose that these two miRNAs would also function similarly. It is worth noting that both the miRNAs h1449 and h1677 have identical purine-pyrimidine organization. Following the similar argument, other association with the rest of miRNAs can also be made. It is seen that there does not exist any human miRNA which is 0, 1 or 2 HD apart from the miRNA h328. The five star miRNAs and their various combinations are associated with variety of diseases (*Table 1 in21 and23,49–51). The miR−200a−3p/h609 and miR−200c−3p/h1520 are associated with cancer type Cutaneous melanoma as reported in52. These two miRNAs are similar except in two bases (HD = 2) in their purine pyrimidine distribution.
In order to understand the association among the mRNAs and miRNAs, we take eight target mRNAs for some diseases and the set of associated miRNAs of human species as listed in Table 11 and Table 12. It is found that the FDs of mRNAs are quite higher than the same of associated miRNAs. The FDs of h150, h1617 and h22 are very close and they target to TGFBR2. It is observed that the density distribution of purine/pyrimidine is balanced for hh2220 and h616 and they target to DNMT3A causing the disease Lung Neoplasms. If we look for the distance pattern of purine and pyrimidine, we could observe some sub patterns for miRNAs to the corresponding mRNAs. The HD (using Equation (4)) between the purine pyrimidine distribution of miRNAs and the corresponding target mRNAs are determined and it turns out to be ranging from 1 to 5 (1 ≤ HD ≤ 5). This observation suggests that for some specific regions of target mRNAs of length around 22 nt, we have approximately (80–95)% similarities with the corresponding miRNAs.
Table 12.
Target mRNAs/miRNAs and corresponding quantifications. Pu-Purine, Py-Pyrimidine, Dp-Distance pattern.
| Target mRNAs or miRNAs | FD | HE | Pu Density | Py Density | Pu-Dp | Py-Dp |
|---|---|---|---|---|---|---|
| ERK5/t1 | 1.94 | 0.66 | 0.47 | 0.53 | [1-2-3-4-5-6-7-8-9-10-11] | [1-2-3-4-5-6-7-8-9-10-12-13] |
| has-mir-143/h1697 | 1.590 | 0.745 | 0.571 | 0.429 | [1-2-3] | [1-2-3-5] |
| TGFBR2/t2 | 1.8 | 0.57 | 0.53 | 0.47 | [1-2-3-4-5-6-7-8-9-10] | [1-2-3-4-5-6-7-8-9-10-11-12-17] |
| has-mir-20a/h150 | 1.579 | 0.633 | 0.545 | 0.455 | [1-2-3-4] | [1-2-4] |
| has-mir-590/h1617 | 1.570 | 0.569 | 0.476 | 0.524 | [1-2-3-5] | [1-2-3-4] |
| has-mir-106a/h22 | 1.580 | 0.695 | 0.455 | 0.545 | [1-2-5] | [1-2-5] |
| BCL2/t3 | 1.88 | 0.68 | 0.49 | 0.51 | [1-2-3-4-5-6-7-9-13] | [1-2-3-4-5-6-7-8-10] |
| has-mir-16-1/h691 | 1.584 | 0.472 | 0.455 | 0.545 | [1-2-3] | [1-2-3] |
| has-mir-15a/h2533 | 1.599 | 0.575 | 0.409 | 0.591 | [1-2-3-5] | [1-2-4] |
| KIT/t4 | 1.92 | 0.58 | 0.52 | 0.48 | [1-2-3-4-5-6-7-8-9-10-13] | [1-2-3-4-5-6-7-8-9-10-11-12-14-16] |
| has-mir-221/h1013 | 1.611 | 0.540 | 0.391 | 0.609 | [1-2-3-4] | [1-2-4] |
| has-mir-146a/h1057 | 1.608 | 0.723 | 0.364 | 0.636 | [1-4-7] | [1-3-5] |
| RAB30/t5 | 1.87 | 0.59 | 0.54 | 0.46 | [1-2-3-4-5-6-7-8-10-13] | [1-2-3-4-5-6-7-8-9-14-15] |
| has-mir-200a/h609 | 1.579 | 0.578 | 0.500 | 0.500 | [1-2-3-4] | [1-2-3] |
| DMPK/t6 | 1.9 | 0.64 | 0.52 | 0.48 | [1-2-3-4-5-6-7-8-9-10-14] | [1-2-3-4-5-6-7-8-9-10-12] |
| has-mir-103a-2/h29 | 1.643 | 0.668 | 0.348 | 0.652 | [1-2-3-5-8] | [1-2-3] |
| DNMT3A/t7 | 1.91 | 0.66 | 0.60 | 0.40 | [1-2-3-4-5-6-7-9] | [1-2-3-4-5-6-7-8-9-10-11-13] |
| has-mir-29a/h2220 | 1.578 | 0.578 | 0.500 | 0.500 | [1-2-3-4] | [1-2-3-5] |
| has-mir-29b-1/h616 | 1.597 | 0.557 | 0.500 | 0.500 | [1-2-3-4-5] | [1-2-3] |
| has-mir-185/h2277 | 1.621 | 0.839 | 0.409 | 0.591 | [1-3-10] | [1-3] |
| KRAS/t8 | 1.9 | 0.61 | 0.54 | 0.46 | [1-2-3-4-5-6-7-8-9] | [1-2-3-4-5-6-7-8-9-10-11-12-13] |
| has-mir-30c/h2299 | 1.587 | 0.916 | 0.500 | 0.500 | [1-3-4] | [1-2-10] |
Table 10.
Star miRNAs (MiR-200) in human cancer and their quantifications. Pu-purine, Py-Pyrimidine.
| HD | miRNAs | FD | HE | Pu Density | Py Density |
|---|---|---|---|---|---|
| h609 | 1.579 | 0.578 | 0.5 | 0.5 | |
| HD = 1 | h888 | 1.580 | 0.649 | 0.545 | 0.455 |
| HD = 2 | h515 | 1.588 | 0.714 | 0.591 | 0.409 |
| HD = 2 | h875 | 1.587 | 0.610 | 0.478 | 0.522 |
| HD = 2 | h1520 | 1.604 | 0.627 | 0.609 | 0.391 |
| HD = 2 | h1670 | 1.579 | 0.5 | 0.5 | 0.5 |
| h888 | 1.580 | 0.649 | 0.545 | 0.455 | |
| HD = 1 | h515 | 1.588 | 0.714 | 0.5 | 0.5 |
| HD = 1 | h609 | 1.579 | 0.578 | 0.5 | 0.5 |
| HD = 1 | h1520 | 1.604 | 0.627 | 0.609 | 0.391 |
| HD = 2 | h1236 | 1.569 | 0.654 | 0.647 | 0.353 |
| h1520 | 1.604 | 0.627 | 0.609 | 0.391 | |
| HD = 1 | h888 | 1.580 | 0.649 | 0.545 | 0.455 |
| HD = 2 | h515 | 1.588 | 0.714 | 0.591 | 0.409 |
| HD = 2 | h609 | 1.579 | 0.578 | 0.5 | 0.5 |
| HD = 2 | h2413 | 1.590 | 0.528 | 0.706 | 0.294 |
| h1670 | 1.579 | 0.671 | 0.5 | 0.5 | |
| HD = 2 | h515 | 1.588 | 0.714 | 0.591 | 0.409 |
| HD = 2 | h609 | 1.579 | 0.578 | 0.5 | 0.5 |
| HD = 2 | h2485 | 1.533 | 0.873 | 0.471 | 0.529 |
| h515 | 1.588 | 0.714 | 0.591 | 0.409 | |
| HD = 1 | h888 | 1.580 | 0.649 | 0.545 | 0.455 |
| HD = 1 | h1236 | 1.569 | 0.654 | 0.647 | 0.353 |
| HD = 2 | h609 | 1.579 | 0.578 | 0.5 | 0.5 |
| HD = 2 | h712 | 1.543 | 0.745 | 0.556 | 0.444 |
| HD = 2 | h782 | 1.590 | 0.714 | 0.591 | 0.409 |
| HD = 2 | h1520 | 1.604 | 0.627 | 0.609 | 0.391 |
| HD = 2 | h1670 | 1.579 | 0.671 | 0.5 | 0.5 |
| h1449 | 1.579 | 0.671 | 0.5 | 0.5 | |
| HD = 0 | h1677 | 1.579 | 0.671 | 0.5 | 0.5 |
| HD = 2 | h749 | 1.509 | 0.655 | 0.438 | 0.563 |
| HD = 2 | h2186 | 1.596 | 0.638 | 0.409 | 0.591 |
| h1677 | 1.579 | 0.671 | 0.545 | 0.455 | |
| HD = 0 | h1449 | 1.579 | 0.671 | 0.5 | 0.5 |
| HD = 2 | h749 | 1.509 | 0.655 | 0.438 | 0.563 |
| HD = 2 | h2186 | 1.601 | 0.638 | 0.409 | 0.591 |
| h2186 | 1.596 | 0.638 | 0.409 | 0.591 | |
| HD = 1 | h749 | 1.509 | 0.655 | 0.438 | 0.563 |
| HD = 2 | h1449 | 1.579 | 0.671 | 0.5 | 0.5 |
| HD = 2 | h1677 | 1.579 | 0.671 | 0.545 | 0.455 |
| h328 | 1.585 | 0.709 | 0.455 | 0.545 | |
| HD = 0 | × | ||||
| HD = 1 | × | ||||
| HD = 2 | × |
Table 11.
Selected miRNAs of Human and their corresponding target mRNAs. En-Encrypted name.
| Sl no. | miRNAs | En | Target mRNAs | En | Disease |
|---|---|---|---|---|---|
| 1 | hsa-mir-143 | h1697 | ERK5 | t1 | Obesity |
| 2 | hsa-mir-20a | h150 | TGFBR2 | t2 | Breast Neoplasms |
| 3 | hsa-mir-590 | h1617 | TGFBR2 | t2 | Carcinoma, Hepatocellular |
| 4 | hsa-mir-106a | h22 | TGFBR2 | t2 | Colorectal Neoplasms |
| 5 | hsa-mir-16-1 | h691 | BCL2 | t3 | Leukemia, Lymphocytic, Chronic, B-Cell |
| 6 | hsa-mir-15a | h2533 | BCL2 | t3 | Leukemia, Lymphocytic, Chronic, B-Cell |
| 7 | hsa-mir-221 | h1013 | KIT | t4 | Thyroid Neoplasms |
| 8 | hsa-mir-146a | h1057 | KIT | t4 | Thyroid Neoplasms |
| 9 | hsa-mir-200a | h609 | RAB30 | t5 | Carcinoma, Hepatocellular |
| 10 | hsa-mir-103a-2 | h29 | DMPK | t6 | Myotonic Dystrophy |
| 11 | hsa-mir-29a | h2220 | DNMT3A | t7 | Lung Neoplasms |
| 12 | hsa-mir-29b-1 | h616 | DNMT3A | t7 | Lung Neoplasms |
| 13 | hsa-mir-185 | h2277 | DNMT3A | t7 | Glioma |
| 14 | hsa-mir-30c | h2299 | KRAS | t8 | Breast Cancer |
Through these investigations based on quantitative measures, we observe that their is no direct association among the miRNAs and target mRNAs due to their many-many relationships. The complex relationship among miRNAs and the target mRNAs is very much dynamic under various specific conditions as previously pointed out in the literatures13,49,51. Thus it has also been realized through our quantitative analysis over a set of miRNAs and target mRNAs. Our analyses can presume a set of possible miRNAs which would play some key role on the target mRNAs as they are very close with regards to quantitative measures.
Concluding Remarks
One of the integral divisions of nucleotides based on their chemical properties is purine-pyrimidine. We attempted to understand the distribution of purine and pyrimidine bases over all the miRNAs in five species human, gorilla, chimpanzee, mouse and rat. Quantitatively, we deciphered the self-organization of the purine and pyrimidine bases for all the miRNAs through the fractal dimension of the indicator matrix. Also we took out the auto correlation of purine-pyrimidine bases through the parameter Hurst exponent. To get the nearness of the miRNAs based on their purine-pyrimidine distribution, HD is employed. The purine-pyrimidine distance patterns including the frequency distribution have been found for all the miRNAs. For all these parameters, we did cluster the miRNAs into several clusters. Based on the quantitative investigation, some crucial observations are adumbrated in the discussion. Our investigation over all the miRNAs of the five species through the purine and pyrimidine distributions triggers evolutionary closeness among the inter and intra families of different clusters.
Over the analysis through all the quantitative measures we could provide the set of miRNAs which relates target mRNAs and also the set of miRNAs that are associated with the specific diseases. Imperfect base-pairing between the miRNA and the 3′-UTR of its target mRNA leads to blockage of translation, or at least accumulation of the mRNA’s protein product, whereas perfect or near-perfect base-pairing between the miRNA and the middle of its target mRNA causes cleavage of the mRNA, thereby inactivating the same. Such diverse patterns of miRNAs may be responsible for making the correlation among miRNAs and target mRNAs complex, that are yet to be resolved decisively as pointed out by several researchers earlier. As, miRNAs are very smaller in size compared to their target mRNAs, the subsequence/subregions of specific mRNAs and miRNAs association might improve the results. In this context, we plan to bring out the patterns of organization of nucleotides following the other two modes of classifications (amino-keto and strong H-bond and weak H-bond) based on the chemical properties of nucleotides. This is in order to integrate the whole three kinds of grouping to find out the correlationship among the miRNAs-mRNAs and also the targeted regions of mRNAs.
Electronic supplementary material
Acknowledgements
The authors acknowledge Prof. R. L. Brahmachary for his valuable suggestions. The corresponding author thanks to the Indian Statistical Institute for supporting his project fellowships. The authors are most thankful to the anonymous reviewers for their constructive suggestions.
Author Contributions
Research conceptualized by P.P.C., S.S.H. and A.C. J.K.D., S.S.H. and P.B. performed research, collected data, carried out analyses. J.K.D. and S.S.H. wrote the original draft manuscript. All authors (J.K.D., S.S.H., A.C., P.P.C. and P.B.) contributed to interpretation of data, discussion of results. All authors read and approved the manuscript.
Competing Interests
The authors declare no competing interests.
Footnotes
Electronic supplementary material
Supplementary information accompanies this paper at 10.1038/s41598-018-28289-x.
Publisher's note: Springer Nature remains neutral with regard to jurisdictional claims in published maps and institutional affiliations.
References
- 1. Shi, L. & Huang, H. Dna sequences analysis based on classifications of nucleotide bases. Affective Computing and Intelligent Interaction 379–384 (2012).
- 2.Shabarova, Z. A. & Bogdanov, A. A. Advanced organic chemistry of nucleic acids (John Wiley & Sons, 2008).
- 3.Watson JD, et al. Molecular structure of nucleic acids. Nature. 1953;171:737–738. doi: 10.1038/171737a0. [DOI] [PubMed] [Google Scholar]
- 4.Arnott S, Chandrasekaran R, Hukins D, Smith P, Watts L. Structural details of a double-helix observed for dnas containing alternating purine and pyrimidine sequences. Journal of molecular biology. 1974;88:523IN45525–524533. doi: 10.1016/0022-2836(74)90499-9. [DOI] [PubMed] [Google Scholar]
- 5.He L, Hannon GJ. Micrornas: small rnas with a big role in gene regulation. Nature reviews. Genetics. 2004;5:631. doi: 10.1038/nrg1415. [DOI] [PubMed] [Google Scholar]
- 6.Li J, Zhang Z. mirna regulatory variation in human evolution. Trends in Genetics. 2013;29:116–124. doi: 10.1016/j.tig.2012.10.008. [DOI] [PubMed] [Google Scholar]
- 7.Altman S. Enzymatic cleavage of rna by rna. Bioscience reports. 1990;10:317–337. doi: 10.1007/BF01117232. [DOI] [PubMed] [Google Scholar]
- 8.Ambros V. The functions of animal micrornas. Nature. 2004;431:350. doi: 10.1038/nature02871. [DOI] [PubMed] [Google Scholar]
- 9.Chen PY, Meister G. microrna-guided posttranscriptional gene regulation. Biological chemistry. 2005;386:1205–1218. doi: 10.1515/BC.2005.139. [DOI] [PubMed] [Google Scholar]
- 10.Tie J, et al. Mir-218 inhibits invasion and metastasis of gastric cancer by targeting the robo1 receptor. PLoS genetics. 2010;6:e1000879. doi: 10.1371/journal.pgen.1000879. [DOI] [PMC free article] [PubMed] [Google Scholar]
- 11.Lai X, Wolkenhauer O, Vera J. Understanding microrna-mediated gene regulatory networks through mathematical modelling. Nucleic acids research. 2016;44:6019–6035. doi: 10.1093/nar/gkw550. [DOI] [PMC free article] [PubMed] [Google Scholar]
- 12.Enright AJ, et al. Microrna targets in drosophila. Genome biology. 2003;5:R1. doi: 10.1186/gb-2003-5-1-r1. [DOI] [PMC free article] [PubMed] [Google Scholar]
- 13.John B, et al. Human microrna targets. PLoS biology. 2004;2:e363. doi: 10.1371/journal.pbio.0020363. [DOI] [PMC free article] [PubMed] [Google Scholar]
- 14.Stark A, Brennecke J, Russell RB, Cohen SM. Identification of drosophila microrna targets. PLoS biology. 2003;1:e60. doi: 10.1371/journal.pbio.0000060. [DOI] [PMC free article] [PubMed] [Google Scholar]
- 15.Rajewsky N. microrna target predictions in animals. Nature genetics. 2006;38:S8. doi: 10.1038/ng1798. [DOI] [PubMed] [Google Scholar]
- 16.Lai EC, Tomancak P, Williams RW, Rubin GM. Computational identification of drosophila microrna genes. Genome biology. 2003;4:R42. doi: 10.1186/gb-2003-4-7-r42. [DOI] [PMC free article] [PubMed] [Google Scholar]
- 17.Mutum RD, et al. Identification of novel mirnas from drought tolerant rice variety nagina 22. Scientific reports. 2016;6:30786. doi: 10.1038/srep30786. [DOI] [PMC free article] [PubMed] [Google Scholar]
- 18.Mukherji S, et al. Micrornas can generate thresholds in target gene expression. Nature genetics. 2011;43:854–859. doi: 10.1038/ng.905. [DOI] [PMC free article] [PubMed] [Google Scholar]
- 19.Jones-Rhoades MW, Bartel DP. Computational identification of plant micrornas and their targets, including a stress-induced mirna. Molecular cell. 2004;14:787–799. doi: 10.1016/j.molcel.2004.05.027. [DOI] [PubMed] [Google Scholar]
- 20.Hu HY, et al. Microrna expression and regulation in human, chimpanzee, and macaque brains. PLoS genetics. 2011;7:e1002327. doi: 10.1371/journal.pgen.1002327. [DOI] [PMC free article] [PubMed] [Google Scholar]
- 21.Feng X, Wang Z, Fillmore R, Xi Y. Mir-200, a new star mirna in human cancer. Cancer letters. 2014;344:166–173. doi: 10.1016/j.canlet.2013.11.004. [DOI] [PMC free article] [PubMed] [Google Scholar]
- 22.Volinia S, Croce CM. Prognostic microrna/mrna signature from the integrated analysis of patients with invasive breast cancer. Proceedings of the National Academy of Sciences. 2013;110:7413–7417. doi: 10.1073/pnas.1304977110. [DOI] [PMC free article] [PubMed] [Google Scholar]
- 23.Iorio MV, et al. Microrna gene expression deregulation in human breast cancer. Cancer research. 2005;65:7065–7070. doi: 10.1158/0008-5472.CAN-05-1783. [DOI] [PubMed] [Google Scholar]
- 24.Calin GA, Croce CM. Microrna signatures in human cancers. Nature reviews. Cancer. 2006;6:857. doi: 10.1038/nrc1997. [DOI] [PubMed] [Google Scholar]
- 25.Esteller M. Non-coding rnas in human disease. Nature reviews. Genetics. 2011;12:861. doi: 10.1038/nrg3074. [DOI] [PubMed] [Google Scholar]
- 26.Alshalalfa M, Alhajj R. Using context-specific effect of mirnas to identify functional associations between mirnas and gene signatures. BMC bioinformatics. 2013;14:S1. doi: 10.1186/1471-2105-14-S12-S1. [DOI] [PMC free article] [PubMed] [Google Scholar]
- 27.Muniategui A, Pey J, Planes FJ, Rubio A. Joint analysis of mirna and mrna expression data. Briefings in bioinformatics. 2012;14:263–278. doi: 10.1093/bib/bbs028. [DOI] [PubMed] [Google Scholar]
- 28.Enerly E, et al. mirna-mrna integrated analysis reveals roles for mirnas in primary breast tumors. PloS one. 2011;6:e16915. doi: 10.1371/journal.pone.0016915. [DOI] [PMC free article] [PubMed] [Google Scholar]
- 29.Murphy FV, Ramakrishnan V. Structure of a purine-purine wobble base pair in the decoding center of the ribosome. Nature structural & molecular biology. 2004;11:1251. doi: 10.1038/nsmb866. [DOI] [PubMed] [Google Scholar]
- 30.Flynt AS, Lai EC. Biological principles of microrna-mediated regulation: shared themes amid diversity. Nature reviews. Genetics. 2008;9:831. doi: 10.1038/nrg2455. [DOI] [PMC free article] [PubMed] [Google Scholar]
- 31.Todesco M, Rubio-Somoza I, Paz-Ares J, Weigel D. A collection of target mimics for comprehensive analysis of microrna function in arabidopsis thaliana. PLoS genetics. 2010;6:e1001031. doi: 10.1371/journal.pgen.1001031. [DOI] [PMC free article] [PubMed] [Google Scholar]
- 32.Jin HY, et al. Differential sensitivity of target genes to translational repression by mir-17∼92. PLoS genetics. 2017;13:e1006623. doi: 10.1371/journal.pgen.1006623. [DOI] [PMC free article] [PubMed] [Google Scholar]
- 33.Nilsen TW. Mechanisms of microrna-mediated gene regulation in animal cells. TRENDS in Genetics. 2007;23:243–249. doi: 10.1016/j.tig.2007.02.011. [DOI] [PubMed] [Google Scholar]
- 34.Kozomara A, Griffiths-Jones S. mirbase: annotating high confidence micrornas using deep sequencing data. Nucleic acids research. 2013;42:D68–D73. doi: 10.1093/nar/gkt1181. [DOI] [PMC free article] [PubMed] [Google Scholar]
- 35. Cattani, C. Fractals and hidden symmetries in dna. Mathematical problems in engineering2010 (2010).
- 36.Hassan SS, Choudhury PP, Goswami A. Underlying mathematics in diversification of human olfactory receptors in different loci. Interdisciplinary sciences, computational life sciences. 2013;5:270. doi: 10.1007/s12539-013-0176-7. [DOI] [PubMed] [Google Scholar]
- 37.Hassan SS, et al. Quantitative description of genomic evolution of olfactory receptors. Asian-European Journal of Mathematics. 2015;8:1550043. doi: 10.1142/S1793557115500436. [DOI] [Google Scholar]
- 38.Berthelsen CL, Glazier JA, Skolnick MH. Global fractal dimension of human dna sequences treated as pseudorandom walks. Physical Review A. 1992;45:8902. doi: 10.1103/PhysRevA.45.8902. [DOI] [PubMed] [Google Scholar]
- 39.Li W, Kaneko K. Long-range correlation and partial 1/fα spectrum in a noncoding dna sequence. EPL (Europhysics Letters) 1992;17:655. doi: 10.1209/0295-5075/17/7/014. [DOI] [Google Scholar]
- 40.Arneodo A, et al. What can we learn with wavelets about dna sequences? Physica A: Statistical Mechanics and its Applications. 1998;249:439–448. [Google Scholar]
- 41.Carbone A, Castelli G, Stanley HE. Time-dependent hurst exponent in financial time series. Physica A: Statistical Mechanics and its Applications. 2004;344:267–271. doi: 10.1016/j.physa.2004.06.130. [DOI] [Google Scholar]
- 42.ZuGuo Y, GuoYi C. Rescaled range and transition matrix analysis of dna sequences. Communications in Theoretical Physics. 2000;33:673. doi: 10.1088/0253-6102/33/4/673. [DOI] [Google Scholar]
- 43.Hamming RW. Error detecting and error correcting codes. Bell Labs Technical Journal. 1950;29:147–160. doi: 10.1002/j.1538-7305.1950.tb00463.x. [DOI] [Google Scholar]
- 44.Norouzi, M., Fleet, D. J. &Salakhutdinov, R. R. Hamming distance metric learning. In Advances in neural information processing systems, 1061–1069 (2012).
- 45. Burgin, M. Inductive complexity and shannon entropy. In Information and Complexity, 16–32 (2017).
- 46.Zurek WH. Algorithmic randomness and physical entropy. Physical Review A. 1989;40:4731. doi: 10.1103/PhysRevA.40.4731. [DOI] [PubMed] [Google Scholar]
- 47.Roach TN, Nulton J, Sibani P, Rohwer F, Salamon P. Entropy in the tangled nature model of evolution. Entropy. 2017;19:192. doi: 10.3390/e19050192. [DOI] [Google Scholar]
- 48.Wadsworth, G. P. G. P. & Bryan, J. G. Introduction to probability and random variables. Tech. Rep. (1960).
- 49.Friedman RC, Farh KK-H, Burge CB, Bartel DP. Most mammalian mrnas are conserved targets of micrornas. Genome research. 2009;19:92–105. doi: 10.1101/gr.082701.108. [DOI] [PMC free article] [PubMed] [Google Scholar]
- 50.Cimmino A, et al. mir-15 and mir-16 induce apoptosis by targeting bcl2. Proceedings of the National Academy of Sciences of the United States of America. 2005;102:13944–13949. doi: 10.1073/pnas.0506654102. [DOI] [PMC free article] [PubMed] [Google Scholar]
- 51.Tanic M, et al. Deregulated mirnas in hereditary breast cancer revealed a role for mir-30c in regulating kras oncogene. PloS one. 2012;7:e38847. doi: 10.1371/journal.pone.0038847. [DOI] [PMC free article] [PubMed] [Google Scholar]
- 52.van Kempen LC, et al. Loss of microrna-200a and c, and microrna-203 expression at the invasive front of primary cutaneous melanoma is associated with increased thickness and disease progression. Virchows Archiv. 2012;461:441–448. doi: 10.1007/s00428-012-1309-9. [DOI] [PubMed] [Google Scholar]
Associated Data
This section collects any data citations, data availability statements, or supplementary materials included in this article.