

Abstract
Polymeric nanoparticles (nano-paAPCs) modified with T-cell antigens and encapsulating immunostimulatory or immunoinhibitory factors may act as artificial antigen-presenting cells to circulating immune cells, improving the selective delivery of encapsulated drug or cytokine to antigen-specific T-cells. Paracrine delivery of encapsulated agents from these nanoparticles to adjacent cells facilitate sustained delivery lowering the overall administered dose, thus enhancing the overall drug efficacy while reducing toxicity of pleiotropic factors. Little is known mathematically regarding the local concentration of released agent that accumulates around a nanoparticle that is near or embeds in a cell. These concentration fields are calculated here in an attempt to understand paracrine efficacy of these nano-paAPC systems. The significant factor accumulation that can occur if the particles were to embed in the cell membrane may explain observed experimental data regarding enhanced T-cell activation and nanoparticle-mediated improvement in the drug delivery process to noninternalizing cellular targets.
Keywords: Nanoparticle, artificial antigen presenting cell, immunotherapy, T-cell, diffusion, Interleukin-2, APC, drug delivery, analytical model
Graphical Abstract
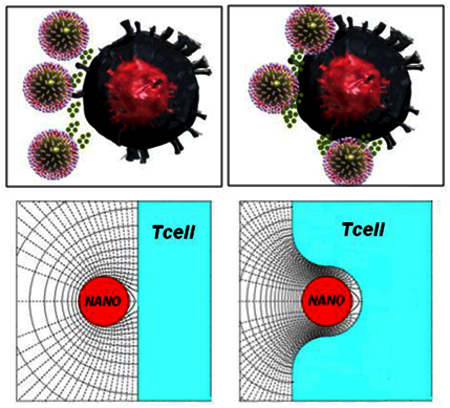
Biodegradable nanoparticles (nano-paAPC’s) impregnated with Interlukin-2 (IL-2) and surface modified with stimulatory and co-stimulatory T-cell ligands have been found to be efficient artificial antigen-presenting cells for T-cells. The present work is an attempt to better understand the efficacy of these particles by calculating the local IL-2 concentration as a function of the secretion characteristics of the nano-paAPC and particle/cell spacing. The potentially significant IL-2 accumulation found here, especially if the nano-paAPCs embed in the cell membrane, may explain observed experimental data regarding enhanced T-cell activation and nanoparticle-mediated improvement in the drug delivery process to non-internalizing cellular targets.
INTRODUCTION:
Several features of nanoparticle-mediated drug delivery make it an attractive modality for enhancing the therapeutic efficacy of pharmacologic agents. These particles can encapsulate a high density of bioactive factors and can be directed to specific cells or tissues. They can also be fabricated from materials that release factor in a slow, sustained fashion over variable time scales, from several days to months. Finally, because of the flexibility in controlling their synthesis and formulation, such particles can be extensively modified to enhance their bioactivity and regulate their transport to and metabolism within specific cells and organs.
While substantial progress has already been made in the fabrication of nanoscale drug delivery systems for biological applications1–9, and there is a good understanding of the thermodynamic10 and biophysiochemical interactions at the nano-bio interface11, 12, little is known about the quantitative aspects of nanoparticle-mediated drug delivery at the cell interface. Previous work in modeling of interactions between variously-sized particles, microcapsules, and cells has been quite limited; several articles have focused primarily on thermodynamic properties of interactions between nanoparticles and cell membranes10; the role of particle size in receptor interaction, adsorption and Endocytosis13; the use of the particles themselves to signal and mediate motion of neighboring particles (in particular, for microfluidic applications that mimic biological cell signaling)14; hydrodynamic and adhesive interactions between nanocarriers and a cell surface (particularly relevant to the immunological synapse)15, and the development of microfluidic devices to help isolate and measure cell-cell and particle-cell interactions16. Thus, most of the literature has focused on the modeling and measurement of interactions between cells and particles themselves rather than on analyzing the paracrine diffusive transfer of encapsulated factors between a particle and a cell; these interactions are of significant interest for targeted drug delivery.
Specifically how does the proximity of a nanoparticle to a target cell influence the concentration and accumulation of factor in the contact region with target cells? This understanding is especially important for nanoparticles engineered to deliver cytokines or immumodulatory factors to specific immune cell targets implicated in cancer or autoimmune disease. T-cells, for example, are exquisitely sensitive to antigen contact and the magnitude and type of the local cytokine milieu. Thus, the avidity of contact and nature of the local cytokine microenvironment can ultimately result in immune cell differentiation, proliferation or tolerance against a specific antigen17, 18 For this reason, polymeric artificial presenting cells (paAPC)19, 20 that release cytokine in the vicinity of the T-cell21–23 are promising new tools for directing the magnitude and direction of an immune response inside and outside the body for active and adoptive immunotherapy respectively6, 21, 24, 25
While cell-mediated immunity is well-studied, recent research has focused on applying “immuno-engineering” methodologies - such as nano-sized particle-based drug delivery for immune modulation6, 21, 24, 25. Multiple teams have been developing biomimetic artificial cells capable of modulating cellular immunity: for example, previous work has demonstrated the creation of self-contained “artificial antigen-presenting cells” (aAPCs) using biodegradable polymeric nanoparticles6,21, 23, 26–28. One example are nanoparticles encapsulating the immunomodulatory cytokine Interleukin-2(IL-2), presenting both costimulatory ligands and recognition ligands on the surface21,22 As these systems contact T-cells and begin to degrade, the paracrine delivery of IL-2 amplified the T-cell expansion response already being seen by presentation of surface ligands. The paracrine accumulation of IL-2 in the contact region enabled an effective level of cytotoxic CD8 T-cell mediated therapy.21, 23
The IL-2 receptor (CD25) is sensitive to directional secretion of a cytokine, specifically in synaptic junctions18, 29, 30. The high-affinity IL-2 receptor, composed of alpha, beta, and gamma subunits, does not appear on the surface until approximately 24 hours following antigen encounter29. In the initial phase of cell activation, therefore, these receptors are often few in number and poor in affinity resulting in a very low rate constant characterizing the internalization of the cytokine and the recycling of the receptor. With a scarcity of receptors, the T-cell is basically non-absorbing. Later stages of activation yield higher avidity receptors and the rate of factor absorption increases.
In the case of T-cells in contact with micron-sized artificial antigen presenting cells (micro-aAPCs) presenting T-cell antigens and releasing the stimulatory factor Interluekin-2 (IL-2), we have previously experimentally noted a striking impact on the magnitude of T-cell activation with much lower doses of IL-221–23. Similar observations have been reported through out the literature with different cell types in proximal contact with micro-and nano-sized particles releasing drug31–33 inhibitory factors34, 35 or stimulatory factors7, 24.
In order to better understand the mechanism by which particles activate cells, it is important to calculate the expected factor concentration near these “cells.” In this regard, our previous analytical work found that in the early stages of cell activation, when there is diffusive transfer of factors between two “cells” of comparable micron size (cell/cell or micro-paAPC/cell: one of which emits and the other receives factor), factor can significantly accumulate in the synaptic contact region leading to a substantial increase in local factor concentration21,36,37 This accumulation was conjectured to effectively induce a T-cell response at much lower overall doses in contrast to free soluble factor. Our attention is turned here to interactions between a cell and nano-sized polymeric antigen presenting cells (nano-paAPC).
Little is known about the magnitude of factor accumulation when a nano-paAPC is in proximity with or embedded in a target cell. The nature of the particle/cell interaction is different than interacting micron sized particles/cells due to the physical size constraint arising from the ligand attachment length, which determines diffusive resistance. As will be shown, significant accumulation can occur but only if the nano-paAPC were to embed into cell membrane. Nanoparticle penetration of the cell membrane has been postulated to occur with a thermodynamic model described by Ginzburg10 and is independent of targeting if physiochemical factors (particle surface charge, hydrophobicity, size) minimize the free energy of interaction between the particle and the cell membrane12. Depending on the degree of penetration, the resulting contorted synapse can offer sufficient diffusive resistance to yield “high” amounts of accumulation. The mechanism by which “high” degrees of accumulation can be achieved, therefore, is different for nano- as opposed to micro-particles.
The significant factor accumulation that these calculations predict may explain observed experimental results regarding enhanced T-cell activation with nanoparticles38. Using nanoparticles encapsulating IL-2 attached to carbon nanotubes presenting T cell stimuli a 1000 fold lower cytokine amount achieves the same proliferation and expansion of antigen-specific T cells. Similar observations have been observed with nanoparticles presenting the same stimuli39. This is not a cytokine-dependent phenomenon as it applies to other factors such Leukemia inhibitory factors (LIF) delivered in a paracrine manner to targeted CD4+ T cells40 stem cells9 and pancreatic islet B cells41. These experimental observations highlight the need for understanding the level of accumulation at the nanoparticle-cell interface that these calculations provide.
METHODS
Governing equations and assumptions
Since our primary interest remains T-cell activation, this analysis will be limited to the case of non-absorbing (naïve) cells but can be extended to absorbing cells in the future. In this case the nano-paAPC exchanges factor only with the ambient medium with none “delivered” to the cell, so we are not looking at paracrine delivery per se, but rather what may be termed paracrine factor accumulation near the cell. The particles and cells are assumed to be spherical and in a quiescent, non-reactive, environment and the concentration field is quasi-steady (QS), varying slowly with time. Under these conditions, the diffusion equation reduces to the Laplace equation that may be written in dimensionless form as:
| (1) |
where C*, the dimensionless factor concentration, is
| (2) |
CNANOiso denotes the surface concentration of factor on the nano-paAPC if it was isolated (far away) from other cells and C∞ is the factor concentration in the ambient medium. The terms “high” and “low” concentrations (C*) used in the following are, therefore, in comparison to the concentration on the surface of an isolated nano-paAPC. A “high” C* may not be very large in absolute terms. The C* field near an isolated nano-paAPC is spherically symmetric, has unit value of the surface, and decreases inversely with distance (Figure 1a). Dimensionless quantities are designated with an asterisk (*) when they have a dimensional counterpart. Distances are measured in units of the nano-paAPC particle radius, RNANO. Thus, the dimensionless synaptic gap width (S*) is S/RNANO. The Laplacian operator in Equation 1 is normalized by RNANO2. The use of dimensionless quantities allows one calculation to be applied to many situations. For example, S*=0.4 results can be applied to a 100nm diameter nano-paAPC with a 20nm synaptic gap (S) interacting with the cell; or a 50nm diameter nano-paAPC with a 10nm synaptic gap.
FIGURE 1.
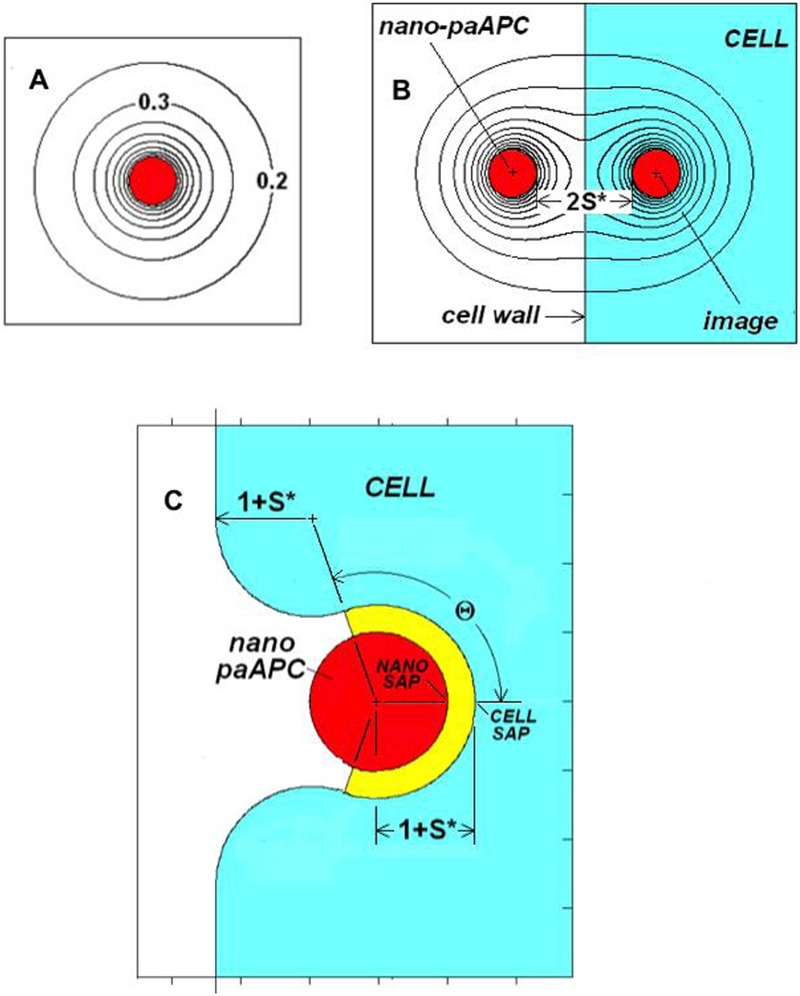
A. C*-field near an isolated nano-paAPC
B. Definition of terms for a nano-paAPC near the surface of a naïve T-cell
C. Definition of terms for an embedded/partially encapsulated nano-paAPC
The local normal nano-paAPC surface flux will be assumed to be first order dependent on the local nano-paAPC surface concentration:
| (3) |
Where D is the diffusion coefficient, Co is the saturation (equilibrium) concentration at or above which the surface flux is zero, CNANO is the local factor surface concentration, n indicates differentiation is normal to the surface, and β is the first order rate constant. In dimensionless form:
| (4) |
where
| (5) |
| (6) |
It can be shown36,37 that when the nano-paAPC is isolated JNANOiso*=1 and since CNANOiso* is by definition unity, a simple relationship exists between β* and Co*:
| (7) |
Given that factor release from biodegradable polymer nanoparticles such as polyesters can occur in two distinct stages; a burst phase associated with release of factor entrapped at the surface and a slow polymer degradation phase associated with factor entrapment in the interior of the particle and release over prolonged periods, a simple expression such as Equation (3) cannot adequately describe such a complex sequence, but it does capture essential elements of the instantaneous transfer process. Besides, since our primary goal is to examine nano- vs micro- size effects, a fair comparison can only be made by adopting the same rate expression (Equation (3)) as previously used37. If Co* is much greater than CNANO*, then the first order dependence of JNANO* on CNANO* can be ignored and JNANO* will have a constant value of β*Co*, independent of the surface concentration. Under these conditions, the nano-paAPC act as a constant flux source. From Equation 7, constant flux behavior would be expected when β *<<1, although, as will be seen, precisely how small β * has to be for the flux to remain constant depends on the nano-paAPC environment. Constant flux behavior will occur when intra-particle diffusion is slow in comparison with external diffusion, as may be the case.42,43 A constant flux source in proximity with a cell is characterized by a non-uniform surface concentration. In the opposite extreme, when β*>>1, Co*->1 transfer is limited by diffusion through the medium. In this large β * case, the nano-paAPC has a uniform surface concentration of unity but a non-uniform local surface flux.
If the T-cell is naïve the normal flux at any point on the cell membrane is zero:
| (8) |
Equation (1) must be solved subject to the boundary conditions on the surface of nano-paAPC (Equation 4) and on the cell wall (Equation (8)).
Method of solution
The curvature of the cell membrane is small on the nanoscale. If the nano-paAPC does not penetrate then curvature can be ignored and the interaction described as a nano-paAPC near a flat, non-absorbing, wall a distance 1+S* from the nano-paAPC’s center. This transfer situation is then equivalent to a nano-paAPC interacting with its image, with a center-to-center of 2(1+S*) (see Figure 1B). When the image is identical (positive) to the nano-paAPC the cell wall midway between the particle and its image is non-absorbing. (Using a negative image would correspond to a perfectly absorbing cell wall.) The boundary condition represented by Equation (8) is automatically satisfied provided Equation(4) is imposed on both the nano-paAPC and its image. The problem can then be solved using the collocation methods described previously21,36,37. These methods use N ring or panel singularities to describe the C*-field between the nano-paAPC and its image. N equations for the N unknown singularity strengths are generated by satisfying Equation(4) at N surface points. By properly choosing the N points, a reasonable solution for the C*-field can be obtained. For example, more collocation points should be located where the interactions are the strongest, such as near the synaptic axis points.
RESULTS
Concentration near a non-embedded Nano-paAPC
Figures 2 shows the C*-field contours surrounding a nearly constant flux (β*=0.0001) and a high β* (β*=100) nano-paAPC as a function of distance from a much larger, naive T-cell. Since no special considerations have been made that are specific to size, this and all of the following results, have general applicability to a spherical emitter of any size approaching a non-absorbing flat wall as, for example, a large particle near a vial wall.
FIGURE 2.
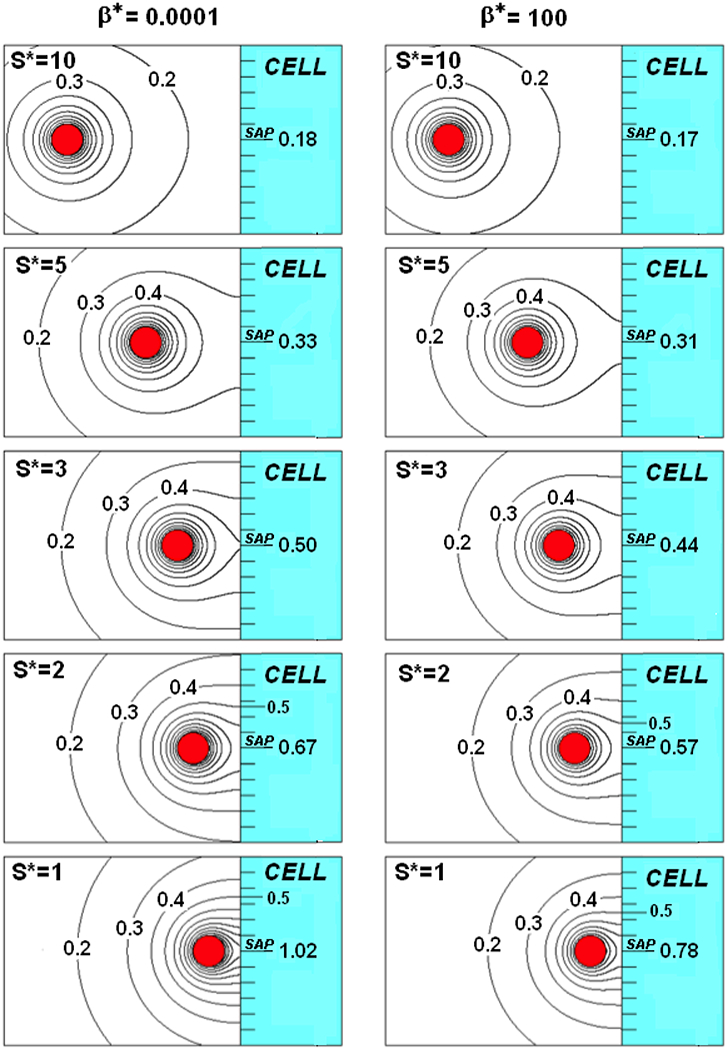
A nano-paAPC near the surface of a naïve T-cell for β* =0.0001 (left) and Β* =100(right)
When S*=10 (Figures 2top), the C* field is little affected by the value of β*. The 0.3 and higher contours decrease inversely with distance and are spherically centered on the nano-paAPC, matching the contours of an isolated nano-paAPC (Figure 1A). The 0.2 contour, however, is no longer spherical but slightly eggshaped. At this spacing, the concentration at the indicated synaptic axis point (SAP) of the cell (CCell*|SAP) is virtually the same (0.18) for both values of β*.
As the nano-paAPC moves closer (S*=5) to the wall the 0.3 and lower contours intersect the wall and CCell*|SAP is slightly larger than 0.3. The effects of β* are small but evident. The 0.3 contour strikes the wall at a radius of 2.9 and 1.3 above the SAP when β*=0.0001 and 100, respectively.
With further decrease in S*, higher order contours intersect the cell wall and a corresponding increase in CCell*|SAP and the effects of β * become more evident. CCell*|SAP increases from 0.5 to 1.02 with an increase in 0.5 contour strike radius from essentially zero to 3.5 as S* decreases from 3 to 1 when β*=0.0001. For β*=100, CCell*|SAP increases from 0.44 to 0.78 and the 0.5 strike radius increases only to 2.5 over the same range of S*. If the actual synaptic gap (S) is 20nm, then S*=3, 2, and 1 correspond to nano-paAPCs that are 13.33nm, 20nm, and 40nm in diameter, respectively.
Figures 3 shows the fields for smaller S* values when β*=0.0001(top) and 100(bottom). The S*=0.4, 0.2 and 0.1 spacings in these figures would correspond to nano-paAPCs of 100nm, 200nm and 400nm in diameter, respectively, if S remained 20nm. Of course, if S is greater or less than 20nm, the corresponding nano-paAPC size would change proportionately. The fields change dramatically due to the more intense interaction with the cell wall for these smaller values S*, so close-up views of the synaptic region are provided as insets.
FIGURE 3.
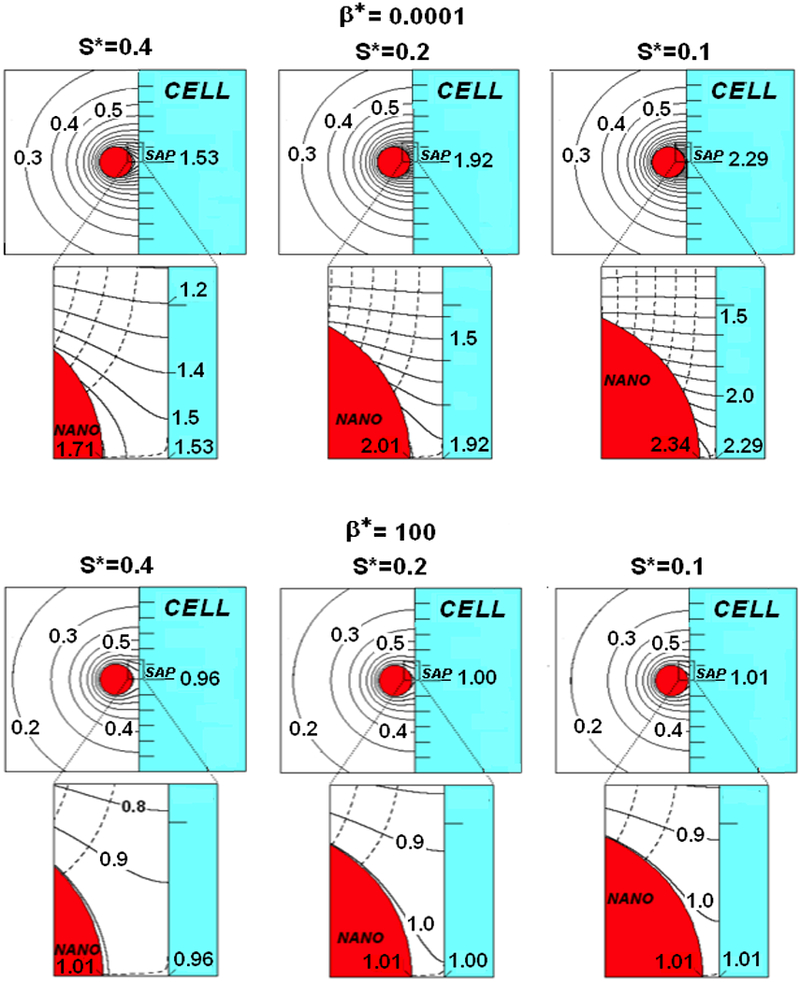
A nano-paAPC near the surface of a naïve T-cell for β*=0.0001 (top) and β* =100(bottom)
For a nearly decreasing S decreasing S (β*=0.0001, Figure 3top), contours less than 0.7 are little affected by decreasing S*. The strike radius of the 0.5 contour, for example, increases only slightly to a value of 3.9 as S* decrease from 0.4 to 0.1. The effects of S* are, however, much more dramatic for the high C* contours near the SAP (see inset). The strike radius of the 1.4 contour increases from 0.6 to 1.05 as S* decreases from 0.4 to 0.1. CCell*|SAP increases from 1.53 to 2.29 coupled with an increase of CNano*|SAP from 1.71 to 2.34 over this S* range. Bear in mind that a C* of 2.29 means that the concentration is 2.29 times greater than an isolated nano-paAPC. The dashed lines in the insets represent flux-lines. Since the nano-paAPC is nearly a constant source, the spacing between the flux-lines on the nano-paAPC’s surface remains constant, but become parallel to the cell wall after leaving the nano-paAPC the closer the particle is to the wall. To maintain a constant flux, a non-uniform surface concentration on the nano-paAPC (and the cell wall) must exist.
Comparing Figure 3(bottom) with Figure 3(top) the C*-field does not penetrate as far into the medium when β *=100 compared with β *=0.0001. For β *=100, the 0.2 contour is near where the 0.3 contour when β*=0.0001. The strike radius for the 0.5 contour is 2.6 compared with 3.9 for β *=0.0001. In other words, the area of the cell wall that is bathed in a factor concentration that is greater than 0.5 of the isolated C* is about 2.25 times larger for a constant source than for a nano-paAPC with β*=100. The reason for this is that the β* =100 nano-paAPC has a Co* of only 1.01, compared with 10001 for β *=0.0001. Any factor accumulation, decreases the local rate of emission, as reflected in the increased spacing between the flux-lines in Figure 3bottom compared with Figure 3top. The SAP approaches saturation (1.01) and the local flux from the nano-paAPC in the synaptic region approaches zero. The overall transfer rate, thus, decreases the closer the high-β * nano-paAPC is to the cell wall.
Figure 4 shows the dimensionless SAP concentration (CCell*|SAP) as a function of S* over a range of β *’s from 0.0001 to 100. Reflecting the qualitative observations in Figures 2 and 3, this graph shows the effect of β * becomes important when S* is small. At S*=2, CCell*|SAP falls within a narrow band from 0.57 to 0.67 over the 7 decade increase in β * represented in this figure. The band narrows for larger S* and eventually approaches zero for large S*.
FIGURE 4.
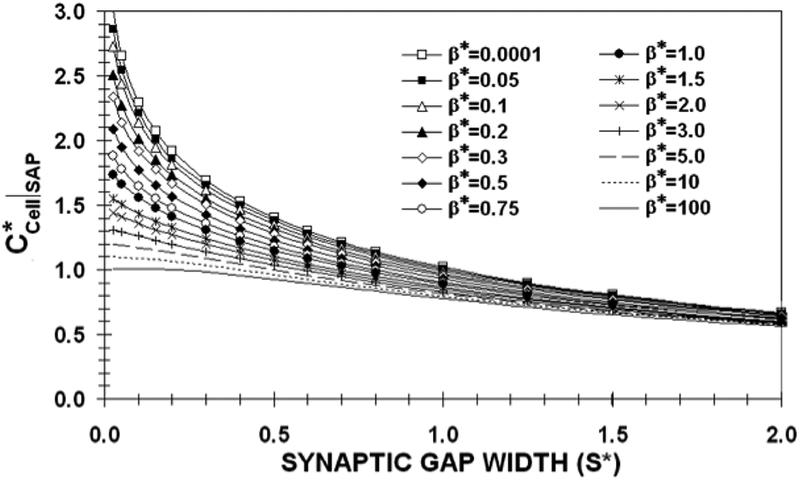
The dimensionless synaptic axis point (SAP) concentration on the T-cell wall as a function of synaptic gap width (S*) for various values of β* when a nano-paAPC does not penetrate the cell wall.
As S* decreases, the β *=100,10, and 5 curves reach their saturation limits of 1.01, 1.1 and 1.2 for S*<0.1. On the other hand, the β *<1 curves are far from saturation for these values of S*. It should be noted that the β *=0.05 curve falls just slightly below the β *=0.0001 curve. This means that a precise knowledge of β * is not important in order to estimate CCell*|SAP. Indeed the utility of this curve lies in the limits it places on possible values of CCell*|SAP. If S*=0.4, corresponding to a 100nm diameter nano-paAPC with an S of 20nm, CCell*|SAP would be between 0.96(β *=100) and 1.53(β *=0.0001).
Concentration near an embedded Nano-paAPC
It was shown in Labowsky and Fahmy37, that cell shape has an important effect on micro-paAPC factor accumulation. If the micron-sized cells were allowed to deform as they interacted, creating a flat synaptic region of radius a*, the CCell*|SAP could easily be more than 20–30 times that of an isolated nano-paAPC for small values of β*. The reason for this large increase in accumulation is the diffusive resistance of the synaptic gap: the higher the resistance, the higher the concentration gradient needed to expel secreted factor from the synapse. An analytical expression was provided in Labowsky and Fahmy (37) for the difference in concentration (∆gap*) between the SAP and the edge of the synaptic region (a distance a* from the axis) for the case of a constant source nano-paAPC interacting with a naïve T-cell:
| (9) |
The narrower the gap or the larger the value of a*, the greater is the diffusive resistance and, thus, the greater the factor accumulation and the higher the CCell*|SAP. While nano-paAPCs are not expected to deform significantly, if they did, the amount of additional accumulation would be considerably less than that experienced by micro-paAPCs due to the inverse dependence of ∆gap* on S*. Deformations, even if they were to occur, therefore, will not appreciably increase factor accumulation for nano-paAPCS as they would for micro-paAPCs.
On the other hand, significant accumulation may occur if the nano-paAPC were to embed in or be partially encapsulated by the cell. The possibility of encapsulation was postulated by Ginzburg10 and was observed experimentally with confocal microscopy of nanoparticles interacting with cells7. To consider the case of embedded particles the numerical procedure in the above analysis, using the image of the nano-paAPC to assure a cell wall, has to be modified. Once the nano-paAPC penetrates the wall collocation points have to be placed not only on the nano-paAPC but also on the cell wall. Further, without prior knowledge concerning how the cell will react in response to penetration by the nano-paAPC, certain liberties must be taken with regard to the shape of the wall. The initial cell indention (See Figure 1C) is spherical with a radius of 1+S* (centered on the nano-paAPC) up to the “encapsulation angle,” at which point it smoothly blends into an off-axis radius of 1+S*. This off-axis radius in turn blends into the nondeformed (flat) portion of the wall. The nano-paAPC and Cell are in “contact” up to the encapsulation angle (Θ). Beyond Θ the distance between the particle and cell exceeds the attachment length (S*). This is a less precise calculation because the collocation points can stretch only so far up the cell wall and so the wall is not perfectly flat beyond a certain distance (~6 nano-paAPC radii) as it was for the non-embedded case.
Figure 5a shows the concentration contours (solid) and flux-lines (dashed) near a nano-paAPC for various degrees of “encapsulation” (Θ) for the case of S*=0.4 when β*=0.0001. As may be seen, as Θ increases the concentration contours compress and CCell*|SAP increases to 1.58, 2.48, 5.79, 9.67, 12.81 and 20.54 for Θ’s of 10, 45, 90, 110, 120, and 130, respectively. For a Θ of 120 and 130, the concentration contours are so compressed that identification of individual contours is difficult. So, order of magnitude increases in CCell*|SAP are possible for large degrees of encapsulation. In addition to the increased CCell*|SAP, the area of the cell wall that is bathed in an enhanced concentration increases with Θ. Increased accumulation over an extended area should increase the chances of cell activation. It should also be noted that the flux-lines become more focused and directed outward from the encapsulation cavity and may serve as a significant signaling beacon that can draw bystander cells to the penetration site.
FIGURE 5.
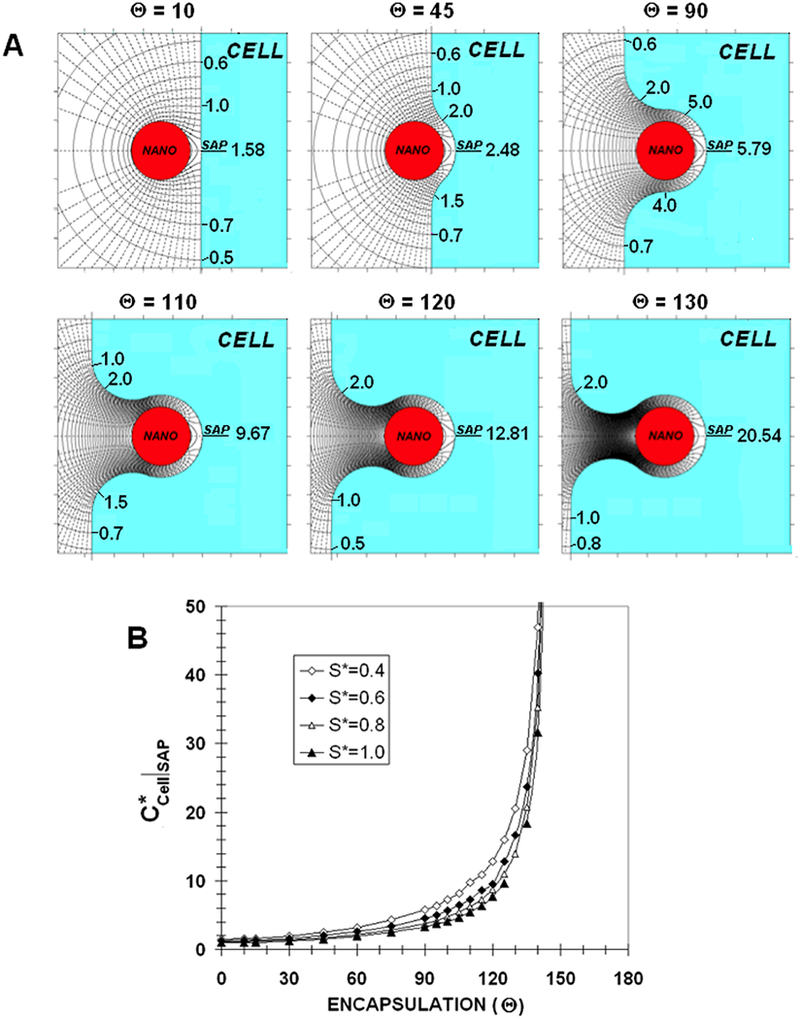
A) Concentration contours (solid) and fluxlines (dashed) near an embedded nano-paAPC for various degrees of encapsulation (β* =0.0001)
B) Dimensionless synaptic axis point (SAP) concentration on the T-cell wall as a function of encapsulation angle (Θ) for various values of synaptic gap width (S*) when a nano-paAPC embeds in the cell (β* =0.0001)
Figure 5b shows CCell*|SAP as a function of Θ for S*=0.4, 0.6, 0.8 and 1.0 for β*=0.0001. All of the curves have similar shapes with relatively small increases in CCell*|SAP for Θ<90. For Θ >90 and especially for Θ>120, accumulation rapidly increases with encapsulation. If the synaptic gap is 20nm, then the S* curves would correspond to nano-paAPCs with diameters of 100nm, 67nm, 50nm and 40nm, respectively. Since the S*=0.4 curve is above the rest, a larger nano-paAPC would seem to be more effective than a smaller one with respect to factor accumulation. On the other hand, it will be more difficult for a larger particle to deeply penetrate the cell. So, while in principle accumulation will be greater the larger the particle, the degree of encapsulation required for this greater accumulation may not be attainable.
Figure 5b also shows that the concept of a “constant source” must be qualified. As Θ −>180, CCell*|SAP increases until it is no longer negligible in comparison with Co*. When Θ is sufficiently large, the transfer rate from the nano-paAPC will eventually begin to decrease and a “constant source” will stop being constant. Indeed, for complete encapsulation (Θ=180), the concentration would reach the equilibrium concentration (Co*=10001 for β*=0.0001); the entire nano-paAPC surface will saturate and all transfer cease until receptors begin to appear on the cell. Designation as a “constant source” is dependent on the ratio the time to emit factor to the diffusion time through the medium. As the cell closes around the nano-paAPC, diffusive resistance dramatically increases, thereby increasing the characteristic diffusion time and the transfer from the nano-paAPC ceases to be constant. With full encapsulation the area of cell wall that is immersed in the equilibrium concentration would be 4π(1+S*)2. Transfer will resume only after the cell activates and high quality factor receptors begin to appear on the included surface.
The degree of encapsulation at which Co* is approached depends on β*. For a β* of 0.0001 this concentration is not approached until the nano-paAPC is nearly fully encapsulated. In contrast, for a high-β* (β*=100, Figure 6) CCell*|SAP (0.97) is within computational error of Co*(1.01) at Θ=10. The field and flux-lines are much less dramatic than for β*=0.0001 in Figure 5a. The cell and nano-paAPC surfaces below and to the right of the 1.0 contour are essentially saturated. As Θ increases, this saturated region spreads further behind the nano-paAPC. Factor flux from the saturated surface shuts down resulting in fewer flux-lines, and a lower bystander signal gradient.
FIGURE 6.
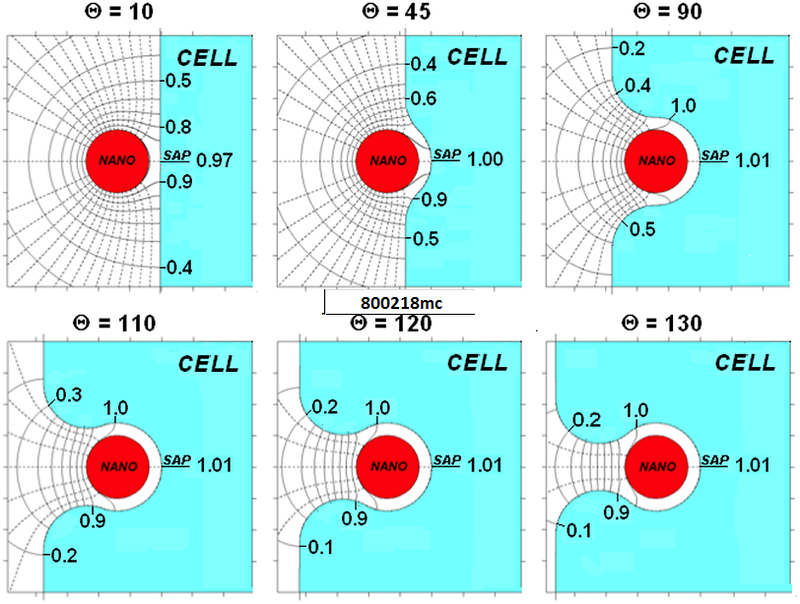
Concentration contours (solid) and flux-lines (dashed) near an embedded nano-paAPC for various degrees of encapsulation (β* =100)
DISCUSSION
Labowsky and Fahmy36,37 discuss in detail the assumptions and limitations of using a boundary collocation method to solve problems in diffusive transfer. We note that Equation 3 provides a simplified description of release rate of factor from a nano-paAPC. A more rigorous, but much more complicated, approach to this problem would involve simultaneously solving the internal and external diffusion equations at each instant in time. This requires an empirical estimate of the rate constants and depends on both the polymer material and method of formulation. Equation 3, however, does capture important elements of the more rigorous solution provided it is realized that Co will decrease with time because a nano-paAPC has only a limited supply of factor. Temporal variations in Co, however, should be low especially for low β particles. The limited factor supply also sets a limit on the distance from the nano-paAPC over which the concentration field will approach the quasi-steady predictions. Indeed, the quasisteady approximation is reasonably valid near the surface of the nano-paAPC. Fortunately, this is exactly the region of interest here.
It should be emphasized that “high and “low” dimensionless concentrations are in comparison with that at the surface of an isolated nano-paAPC. A “high” C* may in fact not be very high in absolute terms. In this regard, for small particles emitting a limited number of molecules, the concept of “concentration” must be viewed in a probabilistic sense. At any instant in time, a snapshot in the vicinity of the cells may show few if any molecules. Viewing many snapshots, however, the probability of seeing a molecule at a given location would be directly related to the calculated “concentration.”
Generally, the application of this analysis goes beyond cell activation with nano-paAPCs. The current focus in pharmaceuticals is shifting to a ‘smart drug’ paradigm, in which increased efficacy and decreased toxicity are the motivating factors. It has been envisioned that this could be achieved with targeted nanoparticles, where repertoires of targets and a series of drugs could yield new generations of highly specific therapeutic agents. Interactions of nanoparticles and cells are critical on this front for understanding both the therapeutic effect as well as the design criteria and formulation of the nanosystems needed to achieve this therapeutic effect. In the case of nanoparticles for immunotherapies, the combination of targeting and sustained delivery results in high local concentrations and continuous cytokine signaling. These effects result in modulation of the cytokine milieu surrounding the targeted immune cell, leading to therapeutically relevant changes in immune cell homeostasis. Continuous local delivery also allows for novel techniques to determine the role of such signals in the long-term properties of T-cells. Central to understanding cellular interactions is knowledge of the concentration fields that surround the particle and the cell. If “high” local concentrations are the key to T-cell activation, then it is critical to know when such concentrations will occur. For micro-sized cells, these high concentrations can occur as a result of the high diffusive resistance in the synapse when the cell surfaces deform.37 Due to their small size, nanoparticles are not expected to deform but, as the above analysis shows, “high” concentrations can occur if the particles were to embed in the cell membrane. While the means (encapsulation rather than deformation) is different in both cases local accumulations more than an order of magnitude greater than the isolated surface concentration can occur, depending on the depth of penetration and the secretion characteristics of the nano-paAPC, and may explain the therapeutic efficacy of these particles. Future experimental work should not only examine nano-paAPC secretion rates and encapsulation but also establish how “high” factor accumulation needs to be in order to stimulate cell activation.
ACKNOWLEDGEMENTS:
Partial funding for this research was provided by the National Institutes of Health Autoimmunity Center of Excellence Pilot Award, U19 AI056363 (T.M.F) and by the Yale University Specialized Programs of Research Excellence (SPORE) in Skin Cancer (Grant#: 1 P50 CA121974).
Footnotes
Publisher's Disclaimer: This is a PDF file of an unedited manuscript that has been accepted for publication. As a service to our customers we are providing this early version of the manuscript. The manuscript will undergo copyediting, typesetting, and review of the resulting proof before it is published in its final citable form. Please note that during the production process errors may be discovered which could affect the content, and all legal disclaimers that apply to the journal pertain.
REFERENCES
- 1).Parveen S, Misra R and Sahoo SK, Nanoparticles: a boon to drug delivery, therapeutics, diagnostics and imaging. Nanomedicine. 2012;8:147–66 [DOI] [PubMed] [Google Scholar]
- 2).Sultana S, Khan MR, Kumar M, Kumar S and Ali M, Nanoparticles-mediated drug delivery approaches for cancer targeting: a review. J Drug Target. 2013;21:107–25 [DOI] [PubMed] [Google Scholar]
- 3).Colson YL and Grinstaff MW, Biologically responsive polymeric nanoparticles for drug delivery. Adv Mater. 2012;24:3878–86 [DOI] [PubMed] [Google Scholar]
- 4).Bamrungsap S, Zhao Z, Chen T, Wang L, Li C, Fu T, et al. , Nanotechnology in therapeutics: a focus on nanoparticles as a drug delivery system. Nanomedicine. 2012;7:1253–71 [DOI] [PubMed] [Google Scholar]
- 5).Zolnik BS, Gonzalez-Fernandez A, Sadrieh N and Dobrovolskaia MA, Nanoparticles and the immune system. Endocrinology. 2010;151:458–65 [DOI] [PMC free article] [PubMed] [Google Scholar]
- 6).Balmert SC and Little SR, Biomimetic delivery with micro- and nanoparticles. Adv Mater. 2012;24:3757–78 [DOI] [PMC free article] [PubMed] [Google Scholar]
- 7).Stephan MT, Stephan SB, Bak P, Chen J and Irvine DJ, Synapse-directed delivery of immunomodulators using T-cell-conjugated nanoparticles. Biomaterials. 2012;33:5776–87 [DOI] [PMC free article] [PubMed] [Google Scholar]
- 8).Moon JJ, Suh H, Polhemus ME, Ockenhouse CF, Yadava A and Irvine DJ, Antigen-displaying lipid-enveloped PLGA nanoparticles as delivery agents for a Plasmodium vivax malaria vaccine. PLoS One. 2012;7:e31472. [DOI] [PMC free article] [PubMed] [Google Scholar]
- 9).Corradetti B, Freile P, Pells S, Bagnaninchi P, Park J, Fahmy TM, et al. , Paracrine signalling events in embryonic stem cell renewal mediated by affinity targeted nanoparticles. Biomaterials. 2012;33:6634–43 [DOI] [PubMed] [Google Scholar]
- 10).Ginzburg VV and Balijepalli S, Modeling the thermodynamics of the interaction of nanoparticles with cell membranes. Nano Lett. 2007;7:3716–22 [DOI] [PubMed] [Google Scholar]
- 11).Peetla C and Labhasetwar V, Biophysical characterization of nanoparticle-endothelial model cell membrane interactions. Mol Pharm. 2008;5:418–29 [DOI] [PubMed] [Google Scholar]
- 12).Nel AE, Madler L, Velegol D, Xia T, Hoek EM, Somasundaran P, et al. , Understanding biophysicochemical interactions at the nano-bio interface. Nat Mater. 2009;8:543–57 [DOI] [PubMed] [Google Scholar]
- 13).Shi W, Wang J, Fan X and Gao H, Size and shape effects on diffusion and absorption of colloidal particles near a partially absorbing sphere: implications for uptake of nanoparticles in animal cells. Phys Rev E Stat Nonlin Soft Matter Phys. 2008;78:061914. [DOI] [PubMed] [Google Scholar]
- 14).Usta OB, Alexeev A, Zhu G and Balazs AC, Modeling microcapsules that communicate through nanoparticles to undergo self-propelled motion. ACS Nano. 2008;2:471–6 [DOI] [PubMed] [Google Scholar]
- 15).Uma B, Radhakrishnan R, Eckmann DM and Ayyaswamy PS, Nanocarrier-Cell Surface Adhesive and Hydrodynamic Interactions: Ligand-Receptor Bond Sensitivity Study. J Nanotechnol Eng Med. 2012;3:310101–310108 [DOI] [PMC free article] [PubMed] [Google Scholar]
- 16).Prabhakarpandian B, Shen MC, Pant K and Kiani MF, Microfluidic devices for modeling cell-cell and particle-cell interactions in the microvasculature. Microvasc Res. 2011;82:210–20 [DOI] [PMC free article] [PubMed] [Google Scholar]
- 17).Germain RN and Stefanova I, The dynamics of T cell receptor signaling: complex orchestration and the key roles of tempo and cooperation. Annu Rev Immunol. 1999;17:467–522 [DOI] [PubMed] [Google Scholar]
- 18).Huse M, Quann EJ and Davis MM, Shouts, whispers and the kiss of death: directional secretion in T cells. Nat Immunol. 2008;9:1105–11 [DOI] [PMC free article] [PubMed] [Google Scholar]
- 19).Oelke M, Maus MV, Didiano D, June CH, Mackensen A and Schneck JP, Ex vivo induction and expansion of antigen-specific cytotoxic T cells by HLA-Ig-coated artificial antigen-presenting cells. Nat Med. 2003;9:619–24 [DOI] [PubMed] [Google Scholar]
- 20).Kim JV, Latouche JB, Riviere I and Sadelain M, The ABCs of artificial antigen presentation. Nat Biotechnol. 2004;22:403–10 [DOI] [PubMed] [Google Scholar]
- 21).Steenblock ER, Fadel T, Labowsky M, Pober JS and Fahmy TM, An artificial antigen-presenting cell with paracrine delivery of IL-2 impacts the magnitude and direction of the T cell response. J Biol Chem.2011;286:34883–92 [DOI] [PMC free article] [PubMed] [Google Scholar]
- 22).Steenblock ER, Wrzesinski SH, Flavell RA and Fahmy TM, Antigen presentation on artificial acellular substrates: modular systems for flexible, adaptable immunotherapy. Expert Opin Biol Ther. 2009;9:451–64 [DOI] [PubMed] [Google Scholar]
- 23).Steenblock ER and Fahmy TM, A comprehensive platform for ex vivo T-cell expansion based on biodegradable polymeric artificial antigen-presenting cells. Mol Ther. 2008;16:765–72 [DOI] [PubMed] [Google Scholar]
- 24).Stephan MT, Moon JJ, Um SH, Bershteyn A and Irvine DJ, Therapeutic cell engineering with surface-conjugated synthetic nanoparticles. Nat Med. 2010;16:1035–41 [DOI] [PMC free article] [PubMed] [Google Scholar]
- 25).Demento S, Steenblock ER and Fahmy TM, Biomimetic approaches to modulating the T cell immune response with nano- and micro- particles. Conf Proc IEEE Eng Med Biol Soc. 2009;2009:1161–6 [DOI] [PubMed] [Google Scholar]
- 26).Sunshine JC, Perica K, Schneck JP and Green JJ, Particle shape dependence of CD8+ T cell activation by artificial antigen presenting cells. Biomaterials. 2013 [DOI] [PMC free article] [PubMed] [Google Scholar]
- 27).Sunshine JC and Green JJ, Nanoengineering approaches to the design of artificial antigen-presenting cells. Nanomedicine. 2013;8:1173–89 [DOI] [PMC free article] [PubMed] [Google Scholar]
- 28).Fadel TR, Steenblock ER, Stern E, Li N, Wang X, Haller GL, et al. , Enhanced cellular activation with single walled carbon nanotube bundles presenting antibody stimuli. Nano Lett. 2008;8:2070–6 [DOI] [PubMed] [Google Scholar]
- 29).Malek TR, The biology of interleukin-2. Annu Rev Immunol. 2008;26:453–79 [DOI] [PubMed] [Google Scholar]
- 30).Sabatos CA, Doh J, Chakravarti S, Friedman RS, Pandurangi PG, Tooley AJ, et al. , A synaptic basis for paracrine interleukin-2 signaling during homotypic T cell interaction. Immunity. 2008;29:238–48 [DOI] [PMC free article] [PubMed] [Google Scholar]
- 31).Chan JM, Valencia PM, Zhang L, Langer R and Farokhzad OC, Polymeric nanoparticles for drug delivery. Methods Mol Biol. 2010;624:163–75 [DOI] [PubMed] [Google Scholar]
- 32).Farokhzad OC and Langer R, Impact of nanotechnology on drug delivery. ACS Nano. 2009;3:16–20 [DOI] [PubMed] [Google Scholar]
- 33).Cheng J, Teply BA, Sherifi I, Sung J, Luther G, Gu FX, Formulation of functionalized PLGA-PEG nanoparticles for in vivo targeted drug delivery. Biomaterials. 2007;28:869–76 [DOI] [PMC free article] [PubMed] [Google Scholar]
- 34).Park J, Gao W, Whiston R, Strom TB, Metcalfe S and Fahmy TM, Modulation of CD4+ T lymphocyte lineage outcomes with targeted, nanoparticle-mediated cytokine delivery. Mol Pharm. 2011;8:143–52 [DOI] [PMC free article] [PubMed] [Google Scholar]
- 35).Molavi O, Mahmud A, Hamdy S, Hung RW, Lai R, Samuel J, et al. , Development of a poly(d,l-lactic-co-glycolic acid) nanoparticle formulation of STAT3 inhibitor JSI-124: implication for cancer immunotherapy. Mol Pharm. 2010;7:364–74 [DOI] [PubMed] [Google Scholar]
- 36).Labowsky M and Fahmy TM, Diffusive transfer between two intensely interacting cells with limited surface kinetics. Chem Eng Sci. 2012;74:114–123 [DOI] [PMC free article] [PubMed] [Google Scholar]
- 37).Labowsky M and Fahmy TM, Effect of cell surface deformation on synaptic factor accumulation during the early stages of T cell activation. Chem Eng Sci. 2013;90:275–283 [Google Scholar]
- 38).Fadel TR,Sharp FA, Vudattu N, Ragheb R, Garyu J, Kim D, Hong E,Li N, Haller GL, Pfefferle LD, Justesen S, Harold KC and Fahmy TM, A carbon nanotube polymer composite for T-cell Therapy. Nat. Nanotechnol 2014;9:639–47 [DOI] [PubMed] [Google Scholar]
- 39).Sharp FA, Ragheb RR, Fahmy TM, A magnetically separable biodegradable nanoparticle platform for T-cell activation and expansion. J.of Immunology (submitted) [Google Scholar]
- 40).Park J, Gao W, Whiston R, Strom TB, Metcalfe S, Fahmy TM, Modulation of CD4+ T lymphocyte lineage outcomes with targeted nanoparticle-mediated cytokine delivery. Mol Pharm.2011;8:143–52. [DOI] [PMC free article] [PubMed] [Google Scholar]
- 41).Dong H, Fahmy TM, Metcalfe SM, Morton SL,Dong X, Inverardi L, Adams DB, Gao W, Wong H, Immuno-isolation of pancreatic islet allografts using pegylated nanotherapy leads to long-term normoglycemia in full MHC mismatch recipient mice. PLoS 0ne.2012;7:e50265. [DOI] [PMC free article] [PubMed] [Google Scholar]
- 42).Almeria B, Fahmy TM and Gomez A, A multiplexed electrospray process for single-step synthesis of stabilized polymer particles for drug delivery. J Control Release. 2011; 154:203–10 [DOI] [PubMed] [Google Scholar]
- 43).Almeria B, Deng W, Fahmy TM and Gomez A, Controlling the morphology of electrospray-generated PLGA microparticles for drug delivery. J Colloid Interface Sci. 2010;343:125–33 [DOI] [PubMed] [Google Scholar]