

Abstract
Spinocerebellar ataxia type 1 (SCA1) is a polyglutamine (polyQ) repeat neurodegenerative disease in which a primary site of pathogenesis are cerebellar Purkinje cells. In addition to polyQ expansion of ataxin-1 protein (ATXN1), phosphorylation of ATXN1 at the serine 776 residue (ATXN1-pS776) plays a significant role in protein toxicity. Utilizing a biochemical approach, pharmacological agents and cell-based assays, including SCA1 patient iPSC-derived neurons, we examine the role of Protein Kinase A (PKA) as an effector of ATXN1-S776 phosphorylation. We further examine the implications of PKA-mediated phosphorylation at ATXN1-S776 on SCA1 through genetic manipulation of the PKA catalytic subunit Cα in Pcp2-ATXN1[82Q] mice. Here we show that pharmacologic inhibition of S776 phosphorylation in transfected cells and SCA1 patient iPSC-derived neuronal cells lead to a decrease in ATXN1. In vivo, reduction of PKA-mediated ATXN1-pS776 results in enhanced degradation of ATXN1 and improved cerebellar-dependent motor performance. These results provide evidence that PKA is a biologically important kinase for ATXN1-pS776 in cerebellar Purkinje cells.
Keywords: SCA1, Purkinje cells, Ataxia, Phosphorylation, ATXN1-S776, cAMP-dependent protein kinase, PKA, Ataxin-1, Cerebellum, Polyglutamine, Protein stability
Introduction
Spinocerebellar ataxia type 1 (SCA1) is an autosomal dominant neurodegenerative disorder caused by expansion of a polyCAG repeat within the coding region of the ataxin-1 gene (ATXN1 or SCA1) (see Kraus-Perrotta and Lagalwar [1] for review). This expansion increases the length of a polyglutamine (polyQ) tract within the Ataxin1 protein (ATXN1) with expansion length directly correlating with the severity and age of onset of SCA1 [2]. SCA1 is characterized neurologically by ataxia, dysarthria, dysphagia, and bulbar dysfunction. A key pathological finding in SCA1 is the loss of Purkinje cells (PCs) from the cerebellar cortex [3, 4].
Experimental reduction of ATXN1 in a mouse model of SCA1 dampens cerebellar pathology and motor deficits induced by ATXN1 with an expanded polyQ tract [5-7]. In a murine model of the Purkinje cell component of SCA1, phosphorylation of ATXN1 at serine 776 (ATXN1-pS776) is crucial to disease pathogenesis and progression. Transgenic mice that express the expanded protein containing a phospho-resistant alanine at 776 (ATXN1[82Q]-S776A) develop mild, late-onset asymptomatic cerebellar cortex atrophy only when crossed to homozygosity [8]. In contrast, transgenic mice lacking the polyglutamine expansion mutation but harboring an irreversible phosphomimetic aspartic acid at 776 (ATXN1[30Q]-S776D) manifest motor deficits of disease [9]. In the cerebellum, a consequence of S776 phosphorylation is cytoplasmic stabilization of ATXN1 [10, 11]. ATXN1[30Q]-S776A transgenic mice feature a 10-fold lower ATXN1 protein/mRNA ratio than ATXN1[30Q]-S776 transgenic mice [12]. Stability of phosphorylated ATXN1 is regulated through the interaction of phospho-S776 with the molecular chaperone 14-3-3 [13]. Binding to 14-3-3 protects ATXN1 against dephosphorylation by cytoplasmic phosphatases [14].
Within the nucleus, phosphorylation of ATXN1-S776 reduces binding to the spliceosomal element U2AF65 [15] and enhances binding to the splicing factor RBM17 [16]. Importantly, interaction of ATXN1-S776 with RBM17 increases with increasing length of the polyQ tract while the interaction of RBM17 with ATXN1-S776A is decreased dramatically regardless of polyQ tract length. Furthermore, the interaction of RBM17 with ATXN1[30Q]-S776D is enhanced like that seen with ATXN1[82Q]-S776 [16].
Given the seminal role S776 phosphorylation plays in regulating ATXN1 biochemistry and function, identification of the biologically active kinase(s) in the central nervous system is of considerable importance. An initial study identified the kinase Akt in phosphorylation of ATXN1 at S776 in non-cerebellar tissue culture cells and a Drosophila retinal model of SCA1 [13]. However, co-expression of ATXN1[30Q]-S776 or ATXN1[82Q]-S776 with a dominant-negative form of Akt in mouse Purkinje cells did not diminish ATXN1-pS776 [12]. A parallel Drosophila and cell-based screen revealed the involvement of the RAS-MAPK-MSK1 pathway in regulation of ATXN1 levels via S776 phosphorylation [17]. Importantly, this study demonstrated that reductions in Msk levels dampen disease severity in vivo using two SCA1 mouse models. In addition, immunodepletion and pharmacological strategies indicate that cAMP-dependent protein kinase (PKA) may also be a biologically relevant kinase for ATXN1-S776 phosphorylation in the mammalian cerebellum [12]. Consistent with this finding is the observation that postnatal day 7 ATXN1[82Q] mouse cerebellar slices treated with forskolin, a PKA pathway activator, displayed enhanced dendritic morphological abnormalities similar to those seen in aged ATXN1[82Q] mice [18]. Correspondingly, application of an inhibitory PKA peptide improved SCA1 Purkinje cell morphology in ATXN1[82Q] mouse cerebellar slices [19].
In the present study, we use pharmacological and genetic approaches to further examine the biological role of PKA as a kinase for ATXN1-S776 phosphorylation and its implications in SCA1. We demonstrate that inhibition of phosphorylation at the S776 residue results in rapid degradation of Atxn1/ATXN1 protein in several mammalian neural experimental systems, including SCA1 patient iPSC-derived neuronal cells. Moreover, reduction of the PKA catalytic subunit Cα in Pcp2-ATXN1[82Q] mice reduces ATXN1[82Q]-S776 phosphorylation, lowers Purkinje cell ATXN1 levels, and delays onset of cerebellar-dependent motor deficits. These data provide further insight into how the dynamic nature of ATXN1, regulated through S776 phosphorylation, impacts disease.
Materials and Methods
Reagents
Tables 1 and 2 provide information on the antibodies and pharmacological compounds used in this study.
Table 1.
Antibodies used for western blotting (WB) and in MESO phosphorylation assay (MESO)
| Antibody | Target | Source | Methods |
|---|---|---|---|
| Ab26322 | Pkaca | Abeam | WB |
| Ab94612 | Pkacb | Abeam | WB |
| AF2518 | MSK1 | R&D Systems | WB, MESO |
| MoAb-17 | ATXN1-phosphoS776 | Harlan | WB |
| PN1248 | ATXN1-phosphoS776 | Lab reagent1 | WB |
| PN1249 | ATXN1-phosphoS776 | New England Peptides | WB |
| 100G7E | Pan Pka phospho-substrates | Cell Signaling Technology | WB |
| 11750 | ATXN1 | Lab reagent2 | WB |
| 12NQ | ATXN1 | Lab reagent2 | WB |
| T5168 | Tubulin | Sigma | WB |
| MAB374 | GAPDH | Millipore | WB |
| ΜΑΒ1195 | bII Tubuin | R&D Systems | WB, IHC?? |
| R32AC-5 | Sulfo-tag anti mouse | MSD | MESO |
Table 2.
Pharmacological compounds
| Compound | Source/catalog number | Stock solvent |
|---|---|---|
| Balanol | AnalytoCon Discovery | DMSO |
| GSK690693 | Tocris/4144 | DMSO |
| H7 | Sigma/I6266 | DMSO |
| H8 | Sigma/M9656 | DMSO |
| H89 | Sigma/B1427 | DMSO |
| SB-747651A | Tocris/4630/10 | DMSO |
| Staurosporine | Sigma/S6942 | DMSO |
| 6-22 amide peptide | Tocris/1904 | DMSO |
Mice
FVB/n mice (Atxn12Q/2Q), CαLoxM120A mice [21], and Sox2-Cre mice [22] were obtained from The Jackson Laboratory. Mice generated by our laboratory include Atxn166Q/2Q mice (derived from Atxn178Q/2Q mice [23]), Atxn1−/− null mice [24], Pcp2-ATXN1[30Q], and Pcp2-ATXN1[82Q] mice [25]. The Institutional Animal Care and Use Committee approved all animal use protocols. All mice were housed and managed by Research Animal Resources under SPF conditions in an AAALAC-approved facility. In all experiments, equal numbers of male and females were used.
In vitro kinase assay
Three gBlocks were designed to encode human Ataxin-1 [30Q] with codons optimized for expression in E.coli K-12 (IDT technologies). Gibson cloning was performed using the pET28a vector and the three gBlocks to generate a protein expression vector with a 6X-His tag and a TEV cleavage site. This construct was transformed in BL21AI One Shot E. coli and Ataxin-1 [30Q] expression was induced with 0.5 mM IPTG and 0.2% L-arabinose for 4 hours at 37°C. The bacteria were lysed using sonication and 1% Triton X-100 in lysis buffer (6 M urea 20 mM BME 0.5 M NaCl 30 mM Imidazole 50 mM NaPO4 pH 7.4). The supernatant was then loaded onto a pre-packed 5 mL high performance Ni sepharose column (GE healthcare). Elution was performed using a step gradient of 330 mM imidazole in lysis buffer. Fractions with >80% purity were used in the kinase assays. 1 µg of recombinant Ataxin-1[30Q] was combined with 250 ng of active kinase and incubated in kinase buffer (25 mM MOPS pH 7.4, 25 mM MgCl2, 5 mM EGTA, 2mM EDTA, 0.1 mg/mL BSA, 1 mM dithiothreitol (DTT)) with phosphatase inhibitor (Roche) and 100 µM ATP (Invitrogen) for 1 hour at 30°C. The kinase reaction was terminated by the addition of NuPAGE LDS sample buffer and sample reducing agent (Invitorgen) followed by boiling for 15 min. Samples were run on NuPAGE 4-12% Bis-Tris Gels (Invitrogen) and stained with InstantBlue Protein Stain (Expedeon) for 1 hour at room temperature. The bands corresponding to Ataxin-1 were extracted, subject to trypsin digestion and analyzed by the Mass Spectrometry-Proteomics Core Laboratory at Baylor College of Medicine using LC-MS/MS on an AB SCIEX TripleTOF 5600 mass spectrometer.
IC50 Profiling
IC50 profiles of GSK690693 and staurosporine were tested against AKT1 (Upstate, cat. no. 14-276), MSK1 (Upstate, cat. no. 14-548M), MSK2 (Upstate, 14-616), PKA (Sigma, cat. no. C8482, PRKACA) and ROCK2 (CARNA, cat. no. 01-110) by Nanosyn. Kinase assays were run in a 12-point dose response format in duplicate wells in two independent trials and fitted to sigmoidal dose-response curves. Confidence intervals of 95% and Hill coefficients were calculated.
Live cell imaging
DAOY cells stably-expressing RFP-ATXN1[82Q]-IRES-YFP [17] were grown on 35mm culture plates, transferred to RC-30HV imaging chambers (Warner Instruments 64-0321), heated to 37 °C using a dual automatic temperature controller (Warner TC-344C), and imaged for brightfield and RFP with an Olympus IX-70 inverted light microscope equipped with fluorescent optics and an Olympus DP71 digital camera. 10 nM staurosporine or DMSO vehicle were added to the plates at time zero; images were captured every 2 minutes and processed using Adobe Photoshop.
GSK690693 inhibition of ATXN1[82Q] phosphorylation (modified MESO assay)
The MESO assay in which compound GSK690693 was analyzed was modified slightly to allow use of the mouse monoclonal antibody specific for pS776 of ATXN1. MESO 96-well Small Spot Glutathione plates (MESO Scale Discovery, MSD L15GB-1) were blocked with ELISA blocking buffer (Thermo N502) for one hr at 4 °C shaking at 700 rpm. Plates were washed three times with PBS-T. Each reaction was plated in triplicate, 25 µl per well, onto the blocked plate and shaken for two hr at 4 °C at 700 rpm. Plates were washed three times with PBS 0.1% Triton. A phosphorylation specific antibody was generated against position S776 of ATXN1 by Harlan, monoclonal antibody-17 (MoAB-17). MoAB-17 was diluted to 1 ng /μl in PBS-T and 25 μl of the diluted antibody added to each well. Plates were shaken for two hr at 4 °C at 700 rpm and washed three times with PBS-T. Sulfo-tag labeled anti-mouse antibody (Meso R32AC-5) was diluted to 1 μg/μl in PBS-T and 25 μl was added to each well. Plates were shaken for two hr at 4 °C at 700 rpm and washed three times with PBS-T. Read Buffer (MSDR92TC-3) was added followed by electrical stimulation on a Sector 6000 Microplate Imaging System.
SCA1 patient iPSC-derived neuronal cells and GSK690693 treatment
Fibroblast samples were collected from a donor skin biopsy and expanded to passage three. Induced pluripotent stem cells (iPSCs) were generated by lentiviral reprogramming with the four pluripotency genes (C-MYC, KLFM3, OCT4 and SOX2). iPSCs were differentiated for two weeks using Stem Cell Technologies Neural Induction Protocol. Neural progenitor cells (NPCs) were expanded on PLO/L-coated plates and frozen. Differentiation of NPCs was performed for seven days using DMEM/F12, 100 ng/ml FGF8, 200 ng/mL SHH and 1:100 N2 supplement. Differentiated cells were stained for the neuronal marker Beta III Tubulin to confirm that they were restricted neural progenitor cells. For drug treatments, cells were treated for two days with 10 μM GSK690693. Cells were lysed in Tris-Triton lysis buffer and extracted protein was processed and analyzed by western blotting. Phosphorylated ATXN1 was labeled with 1 ng/μl MoAb-17 and total ATXN1 was labeled with the anti-ATXN1 antibody 11750. Blots were quantified on ImageQuant and normalized to GAPDH expression.
GSK690693 treatment in Atxn166Q/2Q slice cultures
Inhibition of ATXN1 phosphorylation by GSK690693 was detected in Atxn166Q/2Q cerebellar slices as described in the supplemental methods. Cerebellar slices were treated with GSK690693 for up to five days. Monoclonal MoAB-17 antibody at a concentration of 1 ng/μl was used to detect Atxn1-pS776 and polyclonal antibody 12NQ at 1:2,500 dilution to detect total Atxn1 on western blots.
Histology and immunostaining
Animals were anesthetized and transcardially exsanguinated with PBS and perfused using 10% formalin. Brains were post-fixed 1 hr to overnight in 10% formalin and placed in PBS before sectioning. Cerebella were sectioned into 50 um parasagittal sections using a vibratome. Epitopes were exposed using antigen retrieval by boiling sections four times for 10 s each in 0.01 M urea. Sections were blocked 1hr - overnight in 2% normal donkey serum and 0.3% Triton X-100 in PBS. For staining, primary antibodies were diluted blocking solution as indicated. Rabbit Anti-calbindin antibody was used to label Purkinje neurons (Sigma-Aldrich Cat# C2724, RRID: AB_258818) at a 1:500 dilution). Following incubation, sections were washed three times in PBS and exposed to secondary antibodies (Cy3 donkey anti-rabbit 711-165-152, Jackson Immunoresearch Labs) for 24 hr at 4°C. Sections were washed three times in PBS and mounted onto charged slides (Colorfrost Plus, Fisher). Fluorescently labeled tissue was imaged using a confocal Olympus 1000 IX inverted microscope. Primary fissure molecular layer width was measured on 20x z-stack images, of 10um 1um step sizes. The width was measured as the distance from the base of the PC soma to the pia surface. Six measurements were averaged per section and three sections were measured for each animal. The final average was considered the molecular layer thickness and plotted on the graph.
RNA isolation and sequencing
Total RNA was isolated from dissected cerebella using TRIzol Reagent (Life Technologies, Carlsbad, California) following the manufacturer’s protocols. Cerebella were homogenized using an RNase-Free Disposable Pellet Pestles in a motorized chuck. For RNA-sequencing, RNA was further purified to remove any organic carryover using the RNeasy Mini Kit (Qiagen, Venlo, Netherlands) following the manufacturer’s RNA Cleanup protocol. Cerebellar RNA from five biological replicates for each genotype was isolated. Purified RNA was sent to the University of Minnesota Genomics Center for quality control, including quantification using fluorimetry (RiboGreen assay, Life Technologies) and RNA integrity assessed with capillary electrophoresis (Agilent BioAnalyzer 2100, Agilent Technologies, Inc.) generating an RNA integrity number (RIN). All submitted samples had greater than 1ug total mass and RINs 8.9 or greater (Table S1). Library creation was completed using oligo-dT purification of polyadenylated RNA, which was reverse transcribed to create cDNA. cDNA was fragmented, blunt-ended, and ligated to barcoded adaptors. Library was size selected to 320bp +/− 5% to produce average inserts of approximately 200bp, and size distribution validated using capillary electrophoresis and quantified using fluorimetry (PicoGreen, Life Technologies) and qPCR. Libraries were then normalized, pooled, and sequenced on an Illumina HiSeq 2000 using a 100nt paired-end read strategy. Data were stored and maintained on University of Minnesota Supercomputing Institute Servers.
Reads were aligned to the mouse reference genome (mm10) with Tophat2 [26] using mostly default parameters with two exceptions: mate inner distance and standard deviation were adjusted to the data and using a gene annotation model only looking for supplied junctions (mm10 gtf file from iGenomes). Reads were quantified using Cuffquant [27, 28], and differential gene expression was determined with Cuffdiff2 using default parameters [29]. Genes/introns with a q≤0.05 were considered significant. Genome tracks were visualized with Integrated Genomics Viewer (Broad Institute). Results were graphed with CummeRbund [http://compbio.mit.edu/cummeRbund/ [30]]. Pathway and clustering analysis was completed with Ingenuity Pathway Analysis (Ingenuity Systems, Redwood City, California). Normalized expression values of all genes across all samples were prepared from Cuffquant results using Cuffnorm [28]. The iGenomes mm10 gtf contains both miRNAs and snoRNAs, which are too small to be accurately sequenced using standard RNA-seq library preparation and sequencing. Including these short transcripts in the expression data used for the PCA resulted in PCs driven by the extreme expression of a few miRNAs and snoRNAs. As a result, the expression data used in the PCA was re-quantified using Cuffquant and Cuffnorm after removing miRNAs and snoRNAs from the iGenomes gtf.
Expression analyses
Gene expression analyses were performed using the Tuxedo pipeline [26, 28]. Initial read quality was assessed using FastQC [31] and reads trimmed to remove low quality 3′ ends and adapter contamination using Trimmomatic [32]. Reads were aligned to the mouse reference genome (mm10) with Tophat2 [26] using mostly default parameters with two exceptions: mate inner distance and standard deviation were adjusted to the data and using a gene annotation model only looking for supplied junctions (mm10 gtf file from iGenomes). Reads were quantified using Cuffquant [27, 28], and differential gene expression was determined with Cuffdiff2 using default parameters [29]. Genes/introns with a q≤0.05 were considered significant. Genome tracks were visualized with Integrated Genomics Viewer (Broad Institute). Results were graphed with CummeRbund [30]. Pathway and clustering analysis was completed with Ingenuity Pathway Analysis (Ingenuity Systems, Redwood City, California). Normalized expression values of all genes across all samples were prepared from Cuffquant results using Cuffnorm [28]. The iGenomes mm10 gtf contains both miRNAs and snoRNAs, which are too small to be accurately sequenced using standard RNA-seq library preparation and sequencing. Including these short transcripts in the expression data used for the PCA resulted in PCs driven by the extreme expression of a few miRNAs and snoRNAs. As a result, the expression data used in the PCA was re-quantified using Cuffquant and Cuffnorm after removing miRNAs and snoRNAs from the iGenomes gtf.
WGCNA
FPKM abundance estimates for all 27 samples were produced by CuffNorm [29] and were log2 transformed (log2(FPKM+1)) for WGCNA analysis [33]. The WGCNA R package (v. 1.41) was used to construct an unsigned gene coexpression network with a soft threshold power [beta] of 10. Three gene modules (wt/FVB vs ATXN1[82Q] and ATXN1[82Q]/CαM120A/M120A mice, t-test, Bonferroni corrected p < 1e-5) emerged with only one, the Pink module, being significantly associated with ataxia (p=4.663758e-05).
Behavioral analyses
Behavioral assessments were performed at the University of Minnesota’s Mouse Behavior Core facility. Assessor was blinded to mouse genotypes. For the Balance Beam test, mice were trained to cross a large square beam for three days. On test day four, mice were challenged to cross beams of narrowing sizes, with two test trials per beam size. The beams (round: 25 mm, 17 mm and 10 mm diameter; square: 25 mm, 15 mm and 8 mm wide) are 1 meter long and elevated 50 cm above the bench, suspended between a start point and goal box. The average number of hind paw faults (foot slips) was graphed once the genotypes were decoded at the end of the behavioral experiments. There was no difference between genotypes on the two widest beam sizes for each rod shape; the average number of foot slips on the smallest beam widths is shown here, which differentiates motor skills in wild type from mutant. For the accelerating rotarod assessment (Ugo Basile), mice underwent testing with four trials per day for four consecutive days. For each trial, acceleration was from 4 to 40 rpm over 300 s, and then speed maintained at 40 rpm. Latency to fall was recorded for each mouse per trial.
Statistical analysis
Data are expressed as the means ± standard error of mean (SEM). Statistical analyses were performed using GraphPad Prism software (version 6.0c). Significant differences were based on either t-test, one-way, or two-way analysis of variance (ANOVA) followed by Bonferroni or Dunnett post-hoc test, depending on the analysis (see Figure legends). p<0.05 were considered as statistically significant differences.
Results
In vitro phosphorylation of ATXN1-S776 by MSK1, MSK2, and PKA
Previous evidence suggests that three kinases can phosphorylate ATXN1 at S776: MSK1, MSK2, and PKA [12, 17]. To compare the relative abilities of these kinases to phosphorylate ATXN1-S776, an in vitro kinase assay was developed that utilized mass spectroscopic analysis to quantitate the degree to which purified MSK1, MSK2, and PKA phosphorylated ATXN1 at the seven identified phosphorylation sites [https://phosphomouse.hms.harvard.edu/]. As shown in Table 3, only peptides containing S776 were significantly phosphorylated above background by MSK1, MSK2, and PKA. Although MSK1 and 2 phosphorylated S776 to a slightly higher degree, the results suggest that all three enzymes can contribute to the phosphorylation of Ser776 of ATXN1.
Table 3.
Quantification of Ser776 phosphorylation
| Total MS1 area | ||||
|---|---|---|---|---|
| Peptides (Ser776) | Control | PKA | MSK1 | MSK2 |
| RWsr[p]APESR | 2.74E+09 | 2.37E+09 | 2.32E+10 | |
| WS[p]APESR | 8.86E+07 | 8.35E+07 | ||
| RRWS[p]APESR | 7.26E+06 | 4.60E+08 | 3.90E+08 | 1.14E+09 |
| RWSAPESR | 1.16E+09 | 8.36E+08 | 3.07E+08 | 6.21E+09 |
| WSAPESR | 3.40E+09 | 1.75E+09 | 8.57E+08 | 9.27E+09 |
| % phosphorylation | 0.16 | 55.93 | 70.97 | 61.14 |
Phosphorylation of S776 regulates mammalian ATXN1 levels
Using an in vitro cerebellar lysate kinase assay, evidence suggested that PKA can phosphorylate ATXN1 at S776 [12]. To gain further evidence supporting a role for PKA in ATXN1-S776 phosphorylation, a modification of the in vitro mouse cerebellar extract kinase assay was used to assess a panel of six kinase inhibitors with a range of activity against PKA for their ability to affect the S776 phosphorylation status of ATXN1 (Figure S1A). All inhibitors produced sigmoidal dose response curves for inhibition of GST-ATXN1[30Q]-S776 phosphorylation with IC50 values in the nanomolar to low micromolar range with a trend that largely correlated with their reported affinities for PKA (Figure S1B). To visualize the time course of ATXN1 decrease induced by blocking ATXN1-S776 phosphorylation in live cells, DAOY cells stably expressing RFP-ATXN1[82Q] [17] were treated with 10 nM staurosporine or vehicle (DMSO). Staurosporine was selected since it was one of three inhibitors of ATXN1-S776 phosphorylation with an IC50 in the low nanomolar range. Importantly, of these, only staurosporine is cell membrane permeable. Cells were incubated at 37 °C on a heated stage and imaged using bright field and RFP fluorescence. As shown in Figure 1A and graphed in Figure 1C, a slight reduction in RFP-ATXN1[82Q] signal was seen in cells treated with DMSO vehicle. However, in the presence of 10 nM staurosporine, RFP-ATXN1[82Q] signal was substantially diminished as early as two minutes post-treatment and continued to decrease out to six minutes of treatment (Figure 1B and 1C). Thus, in cerebellar-derived human medulloblastoma DAOY cells, pharmacological treatment at a concentration shown to be effective against PKA (Figure S1B) reduced the amount of total RFP-ATXN1[82Q].
Figure 1. Rapid in situ clearance of ATXN1 following inhibition of pS776 by a small molecule kinase inhibitor.
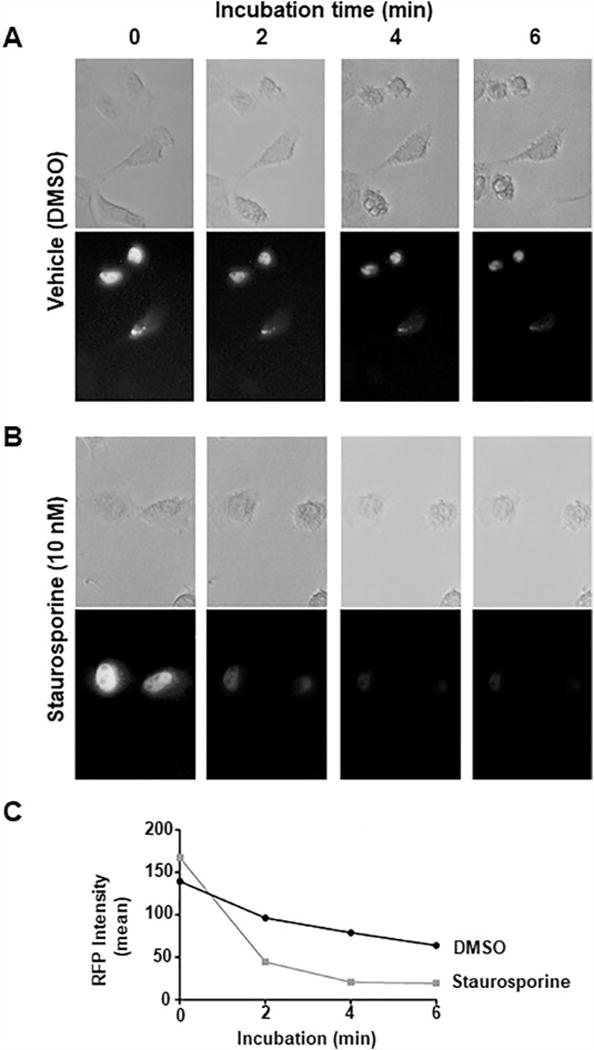
(A) DAOY cells stably-expressing RFP-ATXN1[82Q] were treated with DMSO vehicle for 0 or 6 minutes and imaged for brightfield (upper row) and RFP (lower row). (B) DAOY cells stably-expressing RFP-ATXN1[82Q] were treated with 10 nM staurosporine (STR) for 0-6 min while imaged for brightfield and RFP signals on a heated stage. (C) Graphic representation of decrease in RFP-ATXN1[82Q] over time seen in (A) and (B).
Subsequently, we became aware of a small molecule GSK690693, 4-[2-(4-Amino-1,2,5-oxadiazol-3-yl)-1-ethyl-7-[(3S)-3-piperidinylmethoxy)-1H-imidazo[4,5-c]pyridin-4-yl]-2-methyl-3-butyn-2-ol, developed as a potent inhibitor of the kinase AKT for the potential treatment of tumors in which AKT is activated [34, 35]. Analysis of GSK690693 revealed that it inhibited members of the AGC kinase family including PKA with nanomolar IC50s [34]. To confirm GSK690693 is a PKA inhibitor, a kinase inhibition profile was generated yielding the following results: IC50 for AKT1, 4.1 nM; IC50 for PKA (PRKACA), 8.7 nM; IC50 for ROCK2, 323 nM; IC50 for MSK1, 492 nM; and IC50 for MSK2, 1,130 nM. Next the IC50 of GSK690693 for ATXN1-S776 phosphorylation was determined. ATXN1-S776[30Q] phosphorylation was measured using MoAB-17, a mouse monoclonal that recognizes phospho-S776-ATXN1 (Figure S2). The ability of GSK690693 to inhibit S776 phosphorylation was compared to the PKA inhibitor H89 and to the compound SB-747651A, an MSK inhibitor with an IC50 of 11 nM and approximately 10-fold less inhibitory activity towards PKA [36]. GSK690693 more potently inhibited ATXN1[30Q]-S776 phosphorylation with an IC50 of 0.3 μM compared to H89 and SB-747651A that had IC50s of 2.8 μM and 3.0 μM, respectively (Figure 2A).
Figure 2. The small molecule kinase inhibitor GSK690693 inhibits Atxn1-S776 phosphorylation and promotes clearance of Atxn1 in Atxn166Q/2Q mouse cerebellar slices and in SCA1 patient iPSC-derived neuronal cells.
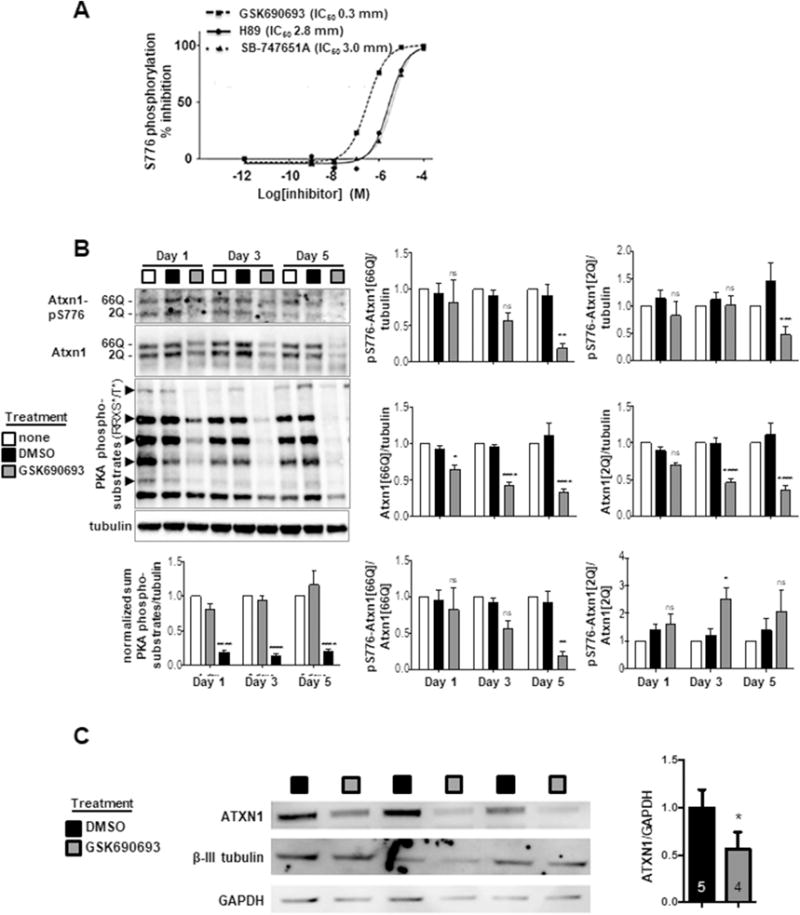
(A) GSK690693, H89 and SB757651 reduced S776 phosphorylation of exogenous GST-ATXN1[82Q] protein in mouse cerebellar extract containing the endogenous kinase. GSK690693 (IC50 = 0.3 μM) decreased phosphorylation with greater efficiency than H89 (IC50 = 2.8 μM) or SB757651 (IC50 = 3.0 μM). (B) 10 μM GSK690693 blocks phosphorylation of PKA substrates and decreases levels of Atxn1[66Q] and Atxn1[2Q] in cultured cerebellar slices from Atxn166Q/2Q mice. N = 5 mice/condition. (C) GSK690693 at 10 μM decreases endogenous human ATXN1 in cultured SCA1 patient iPSC-derived neuronal cells. N is indicated within bars. * p < 0.05, ** p < 0.01, *** p < 0.001, **** p <0.0001.
The effectiveness of GSK690693 as an inhibitor of ATXN1-S776 phosphorylation and to induce a corresponding decrease in ATXN1 levels was examined using Atxn166Q/2Q mouse [23] cerebellar slice cultures and SCA1 patient iPSC-derived neurons. In postnatal day 10 Atxn166Q/2Q mouse cerebellar slice cultures, 10 μM GSK690693 reduced Atxn1[66Q] and Atxn1[2Q] levels in a time dependent manner (Figure 2B). After one day of exposure to GSK690693, Atxn1[66Q] and Atxn1[2Q] levels were reduced by 29% and 22%, respectively. Subsequently, Atxn1 levels were reduced by 56% (Atxn1[66Q]) and 54% (Atxn1[2Q]) at three days, and by 70% (Atxn1[66Q]) and 68% (Atxn1[2Q]) by five days. Inhibition by GSK690693 of other cerebellar proteins harboring the PKA consensus site RRX(S/T) was also seen by one day of treatment using pan-PKA substrates antibody. Anti-phospho-S776-ATXN1 antibody MoAB-17 was used to detect GSK690693 directly on S776 phosphorylation status, which demonstrated a decrease in pS776 by 5 days of treatment. Interpretation of results at earlier times of treatment was limited due to relative poor quality of phospho-Atxn1-S776 blots. While the image quality of the pS776 blots were inferior to blots of total Atxn1, by the 5-day time point, quantification of both supported a conclusion blocking PKA activity with GSK690693 leads to a time-dependent degradation of endogenous murine Atxn1. In addition, a two-day treatment of a SCA1 patient iPSC-derived neuronal cells with 10 μM GSK690693 reduced endogenous ATXN1 levels by 44% (Figure 2C).
Reduction in cerebellar PKA Cα in vivo diminishes Purkinje cell ATXN1-S776 phosphorylation and delays onset of ataxia in a SCA1 mouse model
In the mouse genome two genes encode PKA catalytic subunits (Cα and Cβ) designated Prkaca and Prkacb, respectively [37]. Prkaca is highly expressed in the cerebellum, including Purkinje cells. In contrast, Prkacb expression is much lower and not detected in Purkinje cells [38, 39]. Thus, we reasoned that targeting Prkaca expression/activity would be an effective strategy for studying the contribution of PKA signaling in SCA1 mouse cerebellum. To accomplish this, we adapted an approach developed by Shokat [40] in which the ATP-binding site gatekeeper amino acid of PKA Cα is mutated from a methionine to an alanine at residue 120 (M120A). The engineered kinase becomes a potentially analog-sensitive allele because it can be specifically targeted by an inhibitor analog that contains a bulky substituent complementing the enlarged ATP binding pocket [40, 41]. In addition, previous studies report that PKA Cα with a M120A mutation (CαM120A) results in decreased expression of CαM120A mRNA and protein [21].
CαLoxM120A mice were obtained from the Mutant Mouse Resource & Research Center (Univ. of California, Davis). CαLoxM120A mice were generated by inserting a targeting vector containing the M120A mutation into the Prkaca gene. The targeting vector consisted of a NEO cassette, flanked by lox 1 and lox 2 elements, and a wild type Cα minigene (exons 5 – 10), flanked by lox 2 and lox 3 elements; a second exon 5 containing an M120A mutation was located downstream of lox 3 site on the 3′ end of the exon 5 - 10 portion of the targeting vector [21]. After insertion of the targeting vector into Prkaca, an initial Cre recombination step was done to delete the NEO cassette (flanked by lox 1 and lox 2), generating CαLoxM120A mice (Figure 3A). We then crossed CαLoxM120A mice to Sox2Cre mice to obtain mice with a Prkaca M120A allele (CαM120A) expressed in all tissues (Figure 3A). These were bred to homozygosity (CαM120A/M120A) for Prkaca CαM120A to completely replace wild type Prkaca. To generate animals that would enable an assessment of the M120A mutation on PKA activity and subsequent ATXN1-S776 phosphorylation, CαM120A/M120A mice were crossed to each of two ATXN1 transgenic lines having transgene expression restricted to cerebellar Purkinje cells, Pcp2-ATXN1[30Q];Atxn1−/− or Pcp2-ATXN1[82Q];Atxn12Q/2Q (Figure 3B & 3F). Pcp2-ATXN1[30Q];Atxn1−/− express human ATXN1 harboring a wt (30Q) polyQ tract under control of the Pcp2/L7 Purkinje cell-specific regulatory region [25] on a Atxn1−/− background [24]. Since ATXN1[30Q] and the endogenous mouse Atxn1[2Q] migrate to the same position on PAGE gels, having ATXN1[30Q] on a Atxn1−/− background enables the use of western blots to assess effect of PKA CαM120A on ATXN1[30Q]-S776 phosphorylation and ATXN1[30Q] levels. Figures 3C and 3D show that in ATXN1[30Q];Atxn1−/−; CαM120A/M120A cerebellar extracts there was a significant reduction (27%) in CαM120A protein with no compensatory increase in wt Cβ protein. Decrease in CαM120A was associated with significant reductions in phospho-S776 and total ATXN1[30Q] levels. A decrease in the ratio of pS776-to-total ATXN1 is not seen experimentally because blocking S776 phosphorylation promotes rapid clearance of ATXN1 protein (Figure 1 and data not shown).
Figure 3. Decreased ATXN1-S776 cerebellar phosphorylation induced by a M120A mutation in Prkaca.
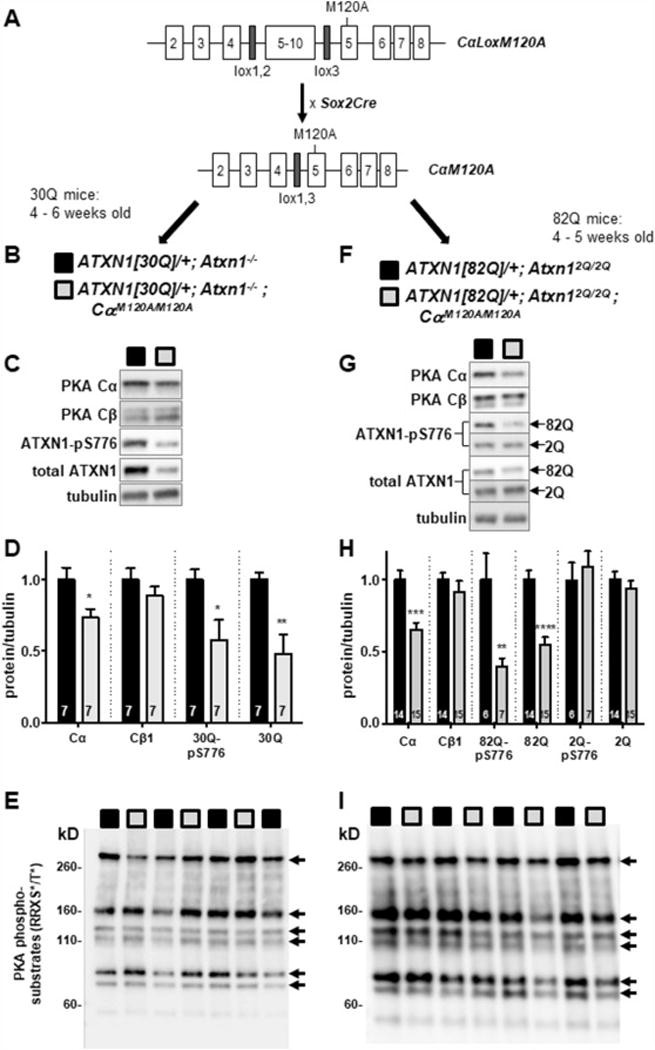
(A) Outline of the strategy used to create the CαM120 mouse. CαLoxM120A mice were obtained, crossed to Sox2Cre mice (Jackson laboratories), and bred to homozygosity. (B-E) CαM120A/M120A mice crossed to Pcp2-ATXN1[30Q];Atxn1−/− mice. (C) Western blot of relevant proteins in a cerebellar extract of 4-6 week old ATXN1[30Q];Atxn1−/− ;CαM120A/M120A mice. (D) Quantification of the results in (C). (E) Western blot of ATXN1[30Q];Atxn1−/− and ATXN1[30Q];Atxn1−/−;CαM120A/M120A -cerebellar extracts for PKA phospho-substrates as revealed using a pan-PKA-phospho-specific antibody. (F-I) CαM120A/M120A mice crossed to Pcp2-ATXN1[82Q];Atxn12Q/2Q mice. (G) Western blot of relevant proteins in a cerebellar extract of 4-5 week old ATXN1[82Q];CαM120A/M120A mice. (H) Quantification of the results in (G). (I) Western blot of ATXN1[82Q] and ATXN1[82Q];CαM120A/M120A cerebellar extracts for PKA phospho-substrates as revealed using a pan-PKA-phospho-specific antibody. Biological replicates (n) are indicated in bars (D and H). Data are represented as mean, ± SEM. Student’s t-test. * p < 0.05, ** p < 0.01, *** p < 0.001, p < 0.0001.
To determine whether PKA CαM120A has an effect on ATXN1 harboring a polyglutamine expansion mutation, CαM120A/M120A mice were crossed to Pcp2-ATXN1[82Q];Atxn12Q/2Q transgenic mice (Figure 3F). CαM120A protein levels decreased 34%, ATXN1[82Q]-S776 phosphorylation decreased 60%, and ATXN1[82Q] protein levels decreased 41% in ATXN1[82Q];Atxn12Q/2Q;CαM120A/M120A cerebellar extracts (Figure 3G, 3H). Intriguingly, in the case of Atxn1[2Q]-pS776 and total Atxn1[2Q] no alteration in levels were detected (Figure 3G, 3H). In this regard, it is important to note that Atxn1[2Q] is expressed in all cells of the cerebellum including granule cells, which are far more numerous than Purkinje cells. On the other hand, ATXN1[82Q] expression is restricted to Purkinje cells, which represent a much smaller fraction of the cerebellar cells. Thus, the finding that only ATXN1[82Q] was impacted in ATXN1[82Q]; Atxn12Q/2Q;CαM120A/M120A cerebellar tissue indicates that Purkinje cell PKA Cα plays a more prominent role in S776 phosphorylation than PKA Cα in other cerebellar cells.
Two additional findings are of note; there was no detectable change in the phosphorylation status of other PKA targets as assessed using a pan-PKA-phospho-specific antibody in either ATXN1[30Q];Atxn1−/−;CαM120A/M120A or ATXN1[82Q];Atxn12Q/2Q;CαM120A/M120A cerebellar extracts (Figures 3E and 3I). In addition, upon crossing CαM120A/M120A mice with Pcp2-ATXN1[82Q]-S776D mice no changes in ATXN1[82Q]-S776D levels were detected in cerebellar extracts (Figure S3). This observation further supports that ATXN1 stability is enhanced by direct phosphorylation of ATXN1-S776 by PKA since ATXN1[82Q]-S776D is an irreversible phospho-mimic.
We next assessed whether the reduction of ATXN[82Q] levels in Purkinje cells seen in ATXN1[82Q];CαM120A/M120A cerebellar extracts impacted SCA1-related ataxic motor deficits. Figure 4A shows that on the balance beam 6 – 7 week old ATXN1[82] mice performed significantly worse than wt/FVB controls. Notably, 6 – 7 week old ATXN1[82Q];CαM120A/M120A mice performed significantly better than ATXN1[82Q] animals on both the 10 mm round and 8 mm square beams. Moreover, performance on the balance beams of 6 – 7 week old ATXN1[82Q];CαM120A/M120A mice was indistinguishable from that of age-matched wt/FVB (Figure 4A). The following week, this same cohort of mice was analyzed using the accelerating Rotarod assessment. On all four trial days, ATXN1[82Q] mice performed significantly worse than wt/FVB animals (Figure 4B). In contrast, on the first three trial days ATXN1[82Q];CαM120A/M120A mice performed significantly better than ATXN1[82Q] mice with a level of performance that matched that of wt/FVB. Thus, reduction in ATXN1[82Q]-S776 phosphorylation and total ATXN1[82Q] total protein levels in Purkinje cells of ATXN1[82Q];CαM120A/M120A cerebella was sufficient to at least delay deficits in motor performance.
Figure 4. PKA CαM120A reduction delays onset of cerebellar motor deficits in ATXN[82Q];CαM120A/M120A mice.
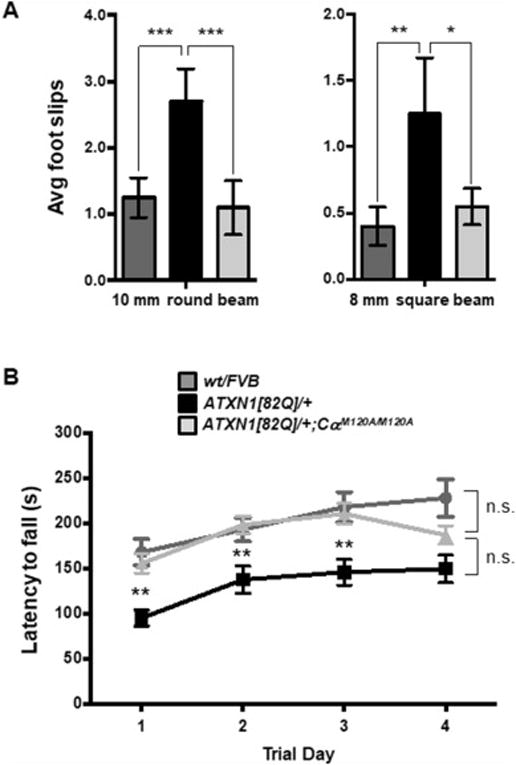
(A) Balance beam assessment of 6-7 week old wt/FVB, ATXN1[82]/+ and ATXN[82Q];CαM120A/M120A mice on a 10 mm round beam and 8 mm square beam. (B). Rotarod assessment of wt/FVB, ATXN1[82] and ATXN[82Q];CαM120A/M120A mice at 7-8 weeks. Data are represented as mean, ± SEM. Two-way ANOVA. n=10 per group. * p < 0.05, ** p < 0.01.
On trial day 4, however, the performance of ATXN1[82Q];CαM120A/M120A animals decreased to a level intermediate between wt/FVB and ATXN1[82Q] mice. A possible explanation for this apparent loss of protective function on trial day 4, at an age of 7.5 to 8.5 weeks, was revealed with a molecular analysis of cerebellar extracts from older ATXN1[82Q];CαM120A/M120A mice. ATXN1[82Q]-S776 phosphorylation and total ATXN1[82Q] protein returned to control levels by 8 weeks of age, despite PKA Cα levels remained suppressed out to 12 weeks (Figure S4). Early and transient decrease in Purkinje cell ATXN1[82Q] levels did not avert ATXN1[82Q]-induced molecular layer atrophy, a histological feature of disease progression, in ATXN1[82Q];CαM120A/M120A brains (Figure S5). Thus, PKA-mediated reduction in Purkinje cell ATXN1[82Q] has therapeutic effects on the ataxic phenotype early in disease, but does not prevent disease progression.
That PKA CαM120A mutation has a transient effect on ATXN1[82Q] clearance is likely due to transgenic overexpression of ATXN1[82Q] or impaired protein clearance machinery as degeneration pathways progress with age [25, 42]. There was no compensatory increase in levels of Msk1 at ages 4 or 12 weeks to account for increase in ATXN1 to control levels (Figure S4B). Other components of the PKA holoenzyme (RII, RIb) or PKA signaling in PCs (AKAP150) were also unchanged (data not shown).
The ATP-binding site analogue 1-NM-PP1 is reported to selectively inhibit genetically engineered kinases, be cell permeable, and cross the blood brain barrier in mice when delivered in drinking water or by IP injection [21, 43]. However, in our hands, all attempts to inhibit CαM120A with 1-NM-PP1 in cerebellar slices or in vivo failed. Figures S6A and S6B illustrate this point using the cerebellar slice culture assay. A three-day incubation of Atxn12Q/2Q;CαM120A/M120A cerebellar slices with 20μM 1-NM-PP1 failed to affect phosphorylation of pan-PKA substrates or the level of Atxn1[2Q] protein, when compared to Atxn12Q/2Q;CαM120A/M120A slices with no treatment or DMSO. Tissues with wild type PKA were not used in these experiments. We had similar results when attempting to deliver 1-NM-PP1 compound in vivo in the cage drinking water or via intra-cerebro-ventricular injections (data not shown). In contrast, incubating Atxn12Q/2Q;CαM120A/M120A cerebellar slices with 10μM GSK690693 for two days dramatically decreased pan-PKA substrate phosphorylation and significantly decreased the amount of Atxn1[2Q] protein. GSK690693 treatment serves as a positive control to demonstrate efficient inhibition of phosphorylation of PKA substrates decreases levels of Atxn1 (presumably as consequence of impaired S776 phosphorylation). The inability of 1-NM-PP1 to effectively inhibit PKA CαM120A was further evident in vitro using cerebellar lysates from Atxn12Q/2Q;CαM120A/M120A mice as the kinase source to phosphorylate exogenous GST-ATXN1[30Q]-S776. In this case 1-NM-PP1 was 2-3 orders of magnitude less sensitive than GSK690693 (Figure S6C). These limitations precluded utilizing a feature of CαM120A, a kinase engineered for selective inhibition by 1-NM-PP1. Finally, given the robust effects GSK690693 has on PKA substrates and ATXN1-S776 in vitro, we tested this compound in vivo. Unfortunately, GSK690693 was very toxic with treated mice having seizures.
Cerebellar RNA-seq reveals pathways associated with onset of ataxia
Recently we reported the identification of a gene co-expression network that correlated with Purkinje cell disease progression based on a cerebellar RNA-seq analysis of ATXN1[82Q] and ATXN1[30Q]-S776D mice [44]. We hypothesized that a similar RNA-seq approach could reveal gene changes in ATXN1[82Q];CαM120A/M120A cerebella that reflect early disease pathways contributing to onset of ataxia. Whole cerebellar RNA from ATXN1[82Q], ATXN1[82Q];CαM120A/M120A, and wt/FVB at 8 - 9 weeks of age was isolated for RNA-seq analysis. Five samples were collected for each genotype based on the average performance on rotarod and beam walking tasks. The five most ataxic ATXN1[82Q] mice, the five best performing ATXN1[82Q];CαM120A/M120A and the five best performing wt/FVB were selected for cerebellar RNA isolation (the last two groups having comparable performance). Cerebellar RNA libraries were generated and subjected to HiSeq 2500 sequencing. A total of 1,621,761,236 paired-end reads were generated, with each sample having an average of 108,117,416 reads. Reads were mapped to the UCSC mm10 mouse annotated genome using Hisat2 (Table S1).
Weighted Gene Coexpression Network Analysis (WGCNA) was used to identify genes that are similarly expressed in cerebella of mice that exhibit motor deficits versus those that did not [33, 45]. ATXN1[82Q] was defined as the ataxic group, and wt/FVB and ATXN1[82Q];CαM120A/M120A were defined as the non-ataxic groups. Two pairwise t-tests were performed comparing ATXN1[82Q] vs wt/FVB and ATXN1[82Q];CαM120A/M120A. Three gene modules emerged and of these, the Pink module, consisting of 498 genes (Table S2) significantly correlated with ataxia (p=4.663758e-05). Calculation of the eigengene as an expression profile of genes across the Pink-ataxia module revealed that expression of genes within this module were enhanced in ATXN1[82Q] cerebella relative to wt/FVB or ATXN1[82Q];CαM120A/M120A cerebella (Figure 5A). The connectivity diagram in Figure 5B illustrates genes with the highest connectivity within the Pink-ataxia network. There are both upregulated (red) and downregulated (green) hub genes in ATXN1[82Q] (ataxic) relative to wt/FVB (non-ataxic). Gene expression profiles available online (Allen Brain Atlas) from the top 10 genes with highest connectivity indicates at least 6 of these genes are enriched in PCs (Table S3), with 3 having no expression data. To query the biology underlying the Pink-ataxia WGCNA module we used Ingenuity Pathway Analysis (IPA). Of the top five significant IPA canonical pathways identified within the Pink-ataxia module, four are signaling pathways with Gq, i.e. G protein-coupled receptor signaling at the top (p = 0.00017) (Figure 5C, Table S4).
Figure 5. WGCNA Pink-ataxia gene network.
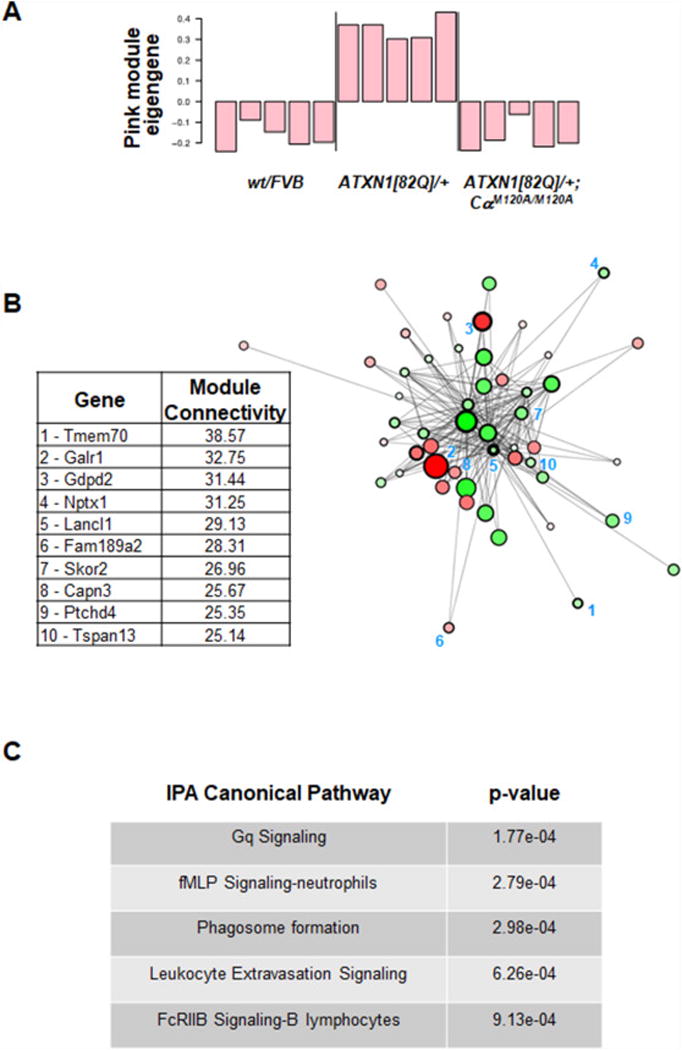
(A) Pink Module eigengene changes in wt/FVB, ATXN1[82]/+ and ATXN1[82Q];CαM120A/M120A mice at 8-9 wks of age. (B) Cytoscape plot of Pink module Eigengene illustrates genes with highest connectivity (hubs) within the Pink-ataxia network. The color of the circles represents the log2 fold change; genes that are red are up in ATXN[82Q]/+ (with ataxia) relative to wt/FVB (without ataxia), and those that are green are down in ATXN[82Q]/+ relative to wt/FVB. The size of the circles represents the absolute value of the log2 fold change. The thickness of the line around each circle represents the log10 of the adjusted p-value (a thick border line means highly significant). The top 10 genes with the highest intramodular connectivity are listed in the table. Module connectivity measures the sum of the connections of a gene to the other genes in the module, whereby higher connectivity indicates higher correlation with every other gene. (C) IPA canonical pathway analysis of the WGCNA Pink-ataxia module is notable for G protein-coupled signaling pathways of the Gq type.
Discussion
Results of this study further demonstrate that ATXN1-S776 phosphorylation regulates ATXN1 levels in vitro and in vivo. Importantly, inhibition of ATXN1-S776 phosphorylation decreased ATXN1 protein levels in SCA1 mouse cerebellar slice cultures as well as in SCA1 patient iPSC-derived neuronal cells. Furthermore, results indicate that PKA Cα is a critical regulator of ATXN1-S776 phosphorylation in the cerebellum, particularly in Purkinje cells, a major site of SCA1 pathology [3]. Notably, in mice with Purkinje cell-specific expression of ATXN1[82Q], a 30% reduction of PKA Cα, due to insertion of a M120A amino acid substitution at the gate-keeper residue of Cα, resulted in a significant decrease in ATXN1[82Q] protein and delayed onset of ataxia. WGCNA analysis of cerebellar RNA-seq from these ATXN1/CαM120A mice revealed a gene co-expression network that significantly correlates with onset of ataxia. Genes within this ataxia network were enriched for those encoding components of signaling pathways, in particular, Gq protein-coupled receptor signaling.
The present study extends previous work on the critical role phosphorylation of ATXN1-S776 has in regulating the clearance of ATXN1 to several biologically relevant neural systems. After four minutes of exposing the cerebellar-derived human medulloblastoma cell line DAOY to staurosporine, fluorescently tagged ATXN1[82Q] was no longer detectable (Figure 1). Staurosporine is a readily cell permeable kinase inhibitor that we found in in vitro assays blocked ATXN1-S776 phosphorylation and PKA with a nanomolar IC50 (Figure S1), suggesting that PKA is a key kinase for ATXN1-S776 phosphorylation. The importance of PKA was further demonstrated using the small molecule kinase inhibitor GSK690693. This compound was originally developed as a high-affinity inhibitor of AKT [46], yet in a kinase panel assay it inhibited PKA at nanomolar levels. GSK690693 inhibited ATXN1-S776 phosphorylation using cerebellar lysate as the kinase source (Figure 2A). In this assay, GSK690693 inhibited ATXN1-S776 phosphorylation with an IC50 of 300 nM, 10-fold more potent than H89, a previously identified inhibitor of PKA [46] and SB757651, a MSK inhibitor [36]. Importantly, we found GSK690693 effectively reduced wt and polyQ expanded Atxn1/ATXN1 when administered to cerebellar slices from Atxn166Q/2Q knock-in mice as well as SCA1 patient iPSC-derived neurons (Figure 2B and 2C). That this effect is a consequence of blocking PKA activity was supported by the positive control demonstrating sustained decrease in phosphorylation of other cerebellar proteins harboring the PKA consensus phosphorylation site RRX(S/T).
To date, there are data supporting the role of multiple kinases in regulating ATXN1-S776 phosphorylation; Akt, PKA, and Msk1/2. Using tissue culture cells and a Drosophila model of SCA1, Akt was the first kinase shown to regulate ATXN1-S776 phosphorylation and neurodegeneration [13]. However, subsequent studies in which mouse cerebellar lysates were immunodepleted for Akt or SCA1 mice were crossed with mice expressing a dominant-negative Akt, showed no effect on ATXN1-S776 phosphorylation, arguing against Akt as having a role in the cerebellum in regulating ATXN1-S776 phosphorylation [12]. More recently, a genetic screen revealed the RAS-MAPK-MSK1/2 pathway as one that modulates ATXN1 levels and toxicity[17]. This study found that a genetic reduction of Msk1/2 partially rescued motor and pathological SCA1-like phenotypes in two SCA1 mouse models.
Besides in vitro studies [12], data implicating PKA as a regulator of cerebellar ATXN1-S776 phosphorylation included results from cerebellar slice studies using the PKA agonist forskolin [18] and a novel PKA inhibitory peptide [19]. Here, a role for PKA in regulating ATXN1-S776 phosphorylation was extended to an in vivo characterization using ATXN1[30Q] or ATXN1[82Q] transgenic mice crossed to CαM120A/M120A mice. In both instances, the M120A mutation induced an approximately 30% reduction in PKA Cα that corresponded with significant and substantive reductions in ATXN1-S776 phosphorylation and levels of ATXN1[30Q] or ATXN1[82Q] proteins. Interestingly, in ATXN1[82Q] transgenic mice where both ATXN1[82Q] and endogenous mouse Atxn1[2Q] protein levels could be assessed, a transient reduction in ATXN1[82Q] was detected in absence of a reduction in Atxn1[2Q]. In these mice, the ATXN1[82Q] protein is expressed only by Purkinje cells while Atxn1[2Q] is expressed in cells throughout the cerebellum including the highly abundant granule neurons. Thus, we suggest that regulation of ATXN1-S776 phosphorylation by PKA Cα is particularly prominent in Purkinje cells and considerably less so in other cells such as granule neurons.
Previous work utilized RNA-seq WGCNA to compare the cerebellar transcriptome of ATXN1[82Q] mice that are ataxic and have a progressive Purkinje cell disease with that of ATXN1[30Q]-S776D mice that have ataxia but lack a progressive Purkinje cell disease [44]. This analysis yielded the Magenta-disease progression gene network. In the current study, a similar strategy was used to compare the cerebellar transcriptomes of ATXN1[82Q] and ATXN1[82Q];CαM120A/M120A mice that differed in age of ataxia onset to define the Pink-ataxia WGCNA module. As noted above, an IPA of the Pink-ataxia module revealed an enrichment of genes encoding components of cell-signaling pathways with Gq-coupled signaling being the most significant (p = 1.77e-04).
GPCR signaling in which the Gα subunit is coupled to q-protein leads to phospholipase C (PLC) activation and downstream activation of PKC and Ca2+ release from intracellular stores. Gq signaling pathways components have previously been implicated in SCA1 and linked to mGluR1 receptor signaling [6, 47, 48]. Of note, mGluR1 expression, which is reduced in ATXN1[82Q] mice, is not contained in the Pink-ataxia module, and was not restored to wild type levels in ATXN1[82Q];CαM120A/M120A mice by RNA-seq or by western blot (data not shown). More recently, increases in PKC activity without increase in kinase components, was implicated as having a neuroprotective effect in SCA1 by decreasing neuronal excitability [49].
The sequencing results presented here cannot discriminate between gene changes occurring in Purkinje cells from other cerebellar neurons, namely granule neurons or glial cells. We inquired the Allen Brain Atlas to regional cerebellar expression of the 12 genes in the “Gq signaling” list, but found limited information: only 5 genes had interpretable in situ hybridization expression data, of which 4 are expressed in Purkinje cells and one had low cerebellar expression. By restricting ATXN1[82Q] expression to the Purkinje neuron, the ATXN1[82Q] mouse model has provided compelling insights into how mutant ATXN1 expression in this critical cell type triggers cerebellar pathological changes beyond this cell type, including cerebellar circuit abnormalities and reactive glial changes [50-52]. RNA-seq changes presented here reflect how pS776-ATXN1[82Q] protein burden in PCs alters gene expression changes in whole cerebellum that in turn modulates motor dysfunction changes independent of cerebellar atrophy.
The Pink-ataxia WGCNA module brings forth novel signaling pathways associated with the initial motor disturbance not previously implicated in heritable cerebellar ataxia. The “Gq signaling” genes in our list include cholinergic receptor muscarinic 1 (Chrm1) and Fibroblast growth factor receptor 1 (Fgfr1) at the top (Table S4). Recent work has shown that mAChR1 may be involved in synaptic signaling in the cerebellum, where postsynaptic mAChR activation in Purkinje cells triggers the synthesis and release of endocannabinoids that act presynaptically on parallel fiber terminals to attenuate LTP [53], suggesting a dynamic signaling role that may impact motor dysfunction. Simultaneously knocking out Fgfr1 and Fgfr2 in cerebellar glial cells results in a disrupted cerebellar phenotype that affects neuronal proliferation and cerebellar organization during development [54]. This model illustrates how non-neuronal Gq signaling can impact neuronal fates and cerebellar function.
The IPA of genes within the Magenta-disease progression network also revealed GPCR signaling pathways as being significantly enriched in this module [44]. In addition, analysis of hub genes of the Magenta-disease progression module [33] showed that a substantial portion of the most highly connected hubs encoded signaling pathway components [33]. It was noted that Rgs8, a potent negative regulator of G-protein-coupled signaling, was one of the highly-connected hub genes of the Magenta-disease progression network. Yet, there is no significant overlap in genes between the Magenta-disease progression and Pink-ataxia WGCNA modules (17 genes, p = 0.2). Moreover, the eigengene - a single representation of the gene expression profile for each module - for the Magenta-disease progression module decreased with disease progression in ATXN1[82Q] cerebella from 5 to 12 weeks of age and remained negative out to 28 weeks [44]. In contrast, the Pink-ataxia module eigengene in this study was positive in 8 - 9 week old ATXN1[82Q] cerebella. Together, these findings raise the interesting possibility that while alterations in cell signaling correlate with both onset of ataxia and progressive Purkinje cell disease, the elements of and manner in which cell signaling is impacted in Purkinje cells differs between onset of ataxia and progressive Purkinje cell disease.
Conclusions
Our findings provide in vivo evidence supporting a direct role for PKA Cα in regulating cerebellar ATXN1-S776 phosphorylation, ATXN1 protein levels, and motor behavior. These results along with the previously reported studies on Msk1/2 support a model whereby cerebellar ATXN1-S776 phosphorylation is regulated by at least three kinases, Msk1/2 and PKA. It is intriguing to speculate that the contribution of each kinase to ATXN1-S776 phosphorylation varies among cerebellar cell types. In any case, our data indicate that to be most effective, a kinase-based therapeutic strategy for SCA1 should target multiple kinases. Cerebellar RNA-seq from mice expressing ATXN1[82Q] and reduced PKA Cα revealed that alterations in cell signaling, in particular G-coupled receptor signaling, have a pronounced role in the onset of ataxia.
Supplementary Material
(A) Table of six small molecule inhibitors and their documented IC50 against PKA. (B) Dose response curves showing the inhibition of ATXN1[82]-S776 phosphorylation by mouse cerebellar lysate in the presence of six cell-characterized kinase inhibitors. The IC50s obtained for each are presented. NS = non-significant (p > 0.05), * p < 0.05.
(A) The rabbit polyclonal phospho-independent antibody 12NQ, (B) the rabbit polyclonal phospho-dependent antibody PN1249, (C) and the phospho-dependent mouse monoclonal antibody MoAb-17 detect full-length human ATXN1[30Q] transgenic protein (arrow, ~120 kDa) and full-length mouse endogenous protein (~80 kDa) in cerebellar homogenates. (A-C) After detection with ATXN1 antibodies, blots were stripped and re-probed for tubulin. (D) ELISA showing binding specificity of diluted MoAb-17 against an ATXN1 peptide featuring the phosphorylated (phospho) or non-phosphorylated (non-phospho) serine at the 776 residue.
(A) Western blot analysis of total ATXN1[82Q] in 4 wk old ATXN[82Q]-S776D/+; Atxn1−/−; and ATXN[82Q]-S776D/+; Atxn1−/−;CαM120A/M120A cerebella. (B) Quantitation of data in A. Data are represented as mean, ± SEM. T-test, p = 0.3432. Total ATXN1 was probed with antibody 11750.
(A) PKA Cα protein is destabilized with an M to A point mutation at amino acid 120, and this reduction persists up to 12 wks of age. (B) There is no compensatory upregulation in Msk1 levels at 4 and 12 wks. (C) There is a significant decrease in ATXN1[82Q]-pS776 at 4 wks, but the effect is attenuated by 8 wks and 12 wks, and is not statistically different from age-matched controls. (D) Total ATXN1[82Q] protein is reduced at 4 wks, but there is no change in total ATXN1[82Q] at 8 and 12 wks of age. The levels of phosphorylated and total Atxn1[2Q] are equal to wild type at all ages in both genotypes (not shown). (Data are represented as mean, ± SEM. Two-way ANOVA. * p < 0.05, ** p < 0.01, *** p < 0.001, **** p < 0.0001.
(A) Immunofluorescence staining using the Purkinje cell marker Calbindin was used to identify the molecular layer (ML) at 6 weeks and 12 weeks of age. ML thickness is an indicator of Purkinje cell integrity. (B) ML length (μm) was measured in the genotypes indicated, demonstrating the expected age-dependent atrophy in ATXN1[82Q], which was seen to a similar degree in ATXN1[82Q];CαM120A/M120A cerebella. CαM120A/M120A controls showed mild ML thinning compared to wt/FVB, but this was independent of age. Data are represented as mean ± SEM. Two-way ANOVA. * p < 0.05, ** p < 0.01, *** p < 0.001, **** p < 0.0001. Notice the symbol * indicates comparison between ages, and + indicates comparison to age-matched wild type.
(A-C) Organotypic cerebellar slices of Atxn12Q/2Q;CαM120A/M120A pups (P10 ± 2d) were grown in culture for 1 day and treated with vehicle (DMSO), 20 μM 1-NM-PP1, or 10 μM GSK690693 for 3 more days, replacing the drug daily. (B) Inhibition of phosphorylation of PKA substrates was detected in samples treated with 10 μM GSK690693, but not in samples treated with 20 μM 1-NM-PP1, demonstrating a failure of 1-NM-PP1 to block PKA CαM120A activity. (C) Decrease in total Atxn1[2Q] was observed with 10 μM GSK690693, but not by 20 μM 1-NM-PP1 treatment that failed to block PKA CαM120A. Biological replicates (n) are indicated in bars. Data are represented as mean, ± SEM. One-Way ANOVA, Dunnett post hoc test. * p < 0.05, ** p < 0.01. (D) Cerebellar extracts of mice expressing PKA CαM120A were used as kinase source to phosphorylate purified GST-ATXN1[30Q] in vitro. Subtle inhibition of S776 phosphorylation is seen at 10 μM 1-NM-PP1, the highest dose tested. In contrast, ATXN1[30Q]-S776 phosphorylation is blocked with as little as 10 nM of GSK690693.
Additional file 8: Table S2. SCA1 WGCNA Pink Module Gene List. Values that were not significantly differentially expressed are omitted (Module correlation ≥ 0.9).
Additional file 7: Table S1. ATXN1 mouse cerebellar RNA-seq summary.
Additional file 9: Table S3. Genes associated with Figure 5B. Expression is based on in situ hybridization, Allen Brain Atlas. Protein type and function was derived from genecards.org.
Additional file 10: Table S4. Complete list of genes in the Gq signaling pathway contained in the IPA of the Pink-ataxia module.
Highlights.
Ataxin-1 protein is abnormally stabilized in Spinocerebellar ataxia type 1
Phosphorylation of ataxin-1 at the serine 776 residue regulates protein stability
Reduced protein kinase A activity reduces ataxin-1 protein levels and delays ataxia
RNAseq analysis reveals Gq signaling pathways associated with delayed ataxia onset
Acknowledgments
We thank Orion Rainwater for his expertise in propagating and maintaining the mouse colony. The authors acknowledge the Minnesota Supercomputing Institute (MSI) at the University of Minnesota for providing resources that contributed to the research results reported within this paper. URL: http://www.msi.umn.edu
Funding
This research was supported NIH Grant RO1-NS045667 and a National Ataxia Foundation Pioneer Award (HTO); R37-NS027699 and IDDRC U54HD083092 (HYZ); National Ataxia Foundation Young Investigator Awards (NM & SL); and a NIH/NRSA F31-NS084540 (JMPO).
Abbreviations
- AKT
ATXN1: ataxin-1 protein
- iPSC
induced pluripotent stem cell
- MSK1/2
mitogen- and stress-activated kinases 1 and 2
- PKA
cyclic AMP-dependent protein kinase
- SCA1
Spinocerebellar ataxia type 1
Footnotes
Publisher's Disclaimer: This is a PDF file of an unedited manuscript that has been accepted for publication. As a service to our customers we are providing this early version of the manuscript. The manuscript will undergo copyediting, typesetting, and review of the resulting proof before it is published in its final citable form. Please note that during the production process errors may be discovered which could affect the content, and all legal disclaimers that apply to the journal pertain.
Availability of supporting data
Supporting datasets are included within the article and additional files. RNA-seq data reported in this paper are deposited at … with an accession number of ….
Author’s contributions
JMPO, NM, NT, BO, LD. JF, JS, JH, SL, and CA performed experiments and analyzed data. CH performed computational analyses of RNA-seq data. JMPO, MAW, SL, CA, HYZ, and HTO conceived the experiments. JMPO, SL, and HTO wrote the manuscript. JMPO, HYZ, SL, and HTO edited the manuscript. All authors read and approved the final manuscript.
Competing interests
None declared
Ethics approval
Mice were housed and treated in accordance with guidelines established by the Institutional Animal Care and Use Committee of the University of Minnesota.
References
- 1.Kraus-Perrotta C, Lagalwar S. Expansion, mosaicism and interruption: mechanisms of the CAG repeat mutation in spinocerebellar ataxia type 1. Cerebellum Ataxias. 2016;3:20. doi: 10.1186/s40673-016-0058-y. [DOI] [PMC free article] [PubMed] [Google Scholar]
- 2.Orr HT, Chung MY, Banfi S, Kwiatkowski TJ, Servadio A, Beaudet AL, McCall AE, Duvick LA, Ranum LP, Zoghbi HY. Expansion of an unstable trinucleotide CAG repeat in spinocerebellar ataxia type 1. Nat Genet. 1993;4:221–226. doi: 10.1038/ng0793-221. [DOI] [PubMed] [Google Scholar]
- 3.Schut J, Haymaker W. A pathologic study of five cases of common ancestry. JNeuropath Clin Neurol. 1951;1:183–213. [PubMed] [Google Scholar]
- 4.Matilla-Dueñas A, Goold R, Giunti P. Clinical, genetic, molecular, and pathophysiological insights into spinocerebellar ataxia type 1. Cerebellum. 2008;7:106–114. doi: 10.1007/s12311-008-0009-0. [DOI] [PubMed] [Google Scholar]
- 5.Xia H, Mao Q, Eliason SL, Harper SQ, Martins IH, Orr HT, Paulson HL, Yang L, Kotin RM, Davidson BL. RNAi suppresses polyglutamine-induced neurodegeneration in a model of spinocerebellar ataxia. Nat Med. 2004;10:816–820. doi: 10.1038/nm1076. [DOI] [PubMed] [Google Scholar]
- 6.Zu T, Duvick LA, Kaytor MD, Berlinger MS, Zoghbi HY, Clark HB, Orr HT. Recovery from polyglutamine-induced neurodegeneration in conditional SCA1 transgenic mice. J Neurosci. 2004;24:8853–8861. doi: 10.1523/JNEUROSCI.2978-04.2004. [DOI] [PMC free article] [PubMed] [Google Scholar]
- 7.Keiser MS, Boudreau RL, Davidson BL. Broad therapeutic benefit after RNAi expression vector delivery to deep cerebellar nuclei: implications for spinocerebellar ataxia type 1 therapy. Mol Ther. 2014;22:588–595. doi: 10.1038/mt.2013.279. [DOI] [PMC free article] [PubMed] [Google Scholar]
- 8.Emamian ES, Kaytor MD, Duvick LA, Zu T, Tousey SK, Zoghbi HY, Clark HB, Orr HT. Serine 776 of ataxin-1 is critical for polyglutamine-induced disease in SCA1 transgenic mice. Neuron. 2003;38:375–387. doi: 10.1016/s0896-6273(03)00258-7. [DOI] [PubMed] [Google Scholar]
- 9.Duvick L, Barnes J, Ebner B, Agrawal S, Andresen M, Lim J, Giesler GJ, Zoghbi HY, Orr HT. SCA1-like disease in mice expressing wild-type ataxin-1 with a serine to aspartic acid replacement at residue 776. Neuron. 2010;67:929–935. doi: 10.1016/j.neuron.2010.08.022. [DOI] [PMC free article] [PubMed] [Google Scholar]
- 10.Lagalwar S, Orr HT. Regulation of ataxin-1 phosphorylation and its impact on biology. Methods Mol Biol. 2013;1010:201–209. doi: 10.1007/978-1-62703-411-1_13. [DOI] [PubMed] [Google Scholar]
- 11.Kohiyama MF, Lagalwar S. Stabilization and Degradation Mechanisms of Cytoplasmic Ataxin-1. J Exp Neurosci. 2015;9:123–129. doi: 10.4137/JEN.S25469. [DOI] [PMC free article] [PubMed] [Google Scholar]
- 12.Jorgensen ND, Andresen JM, Lagalwar S, Armstrong B, Stevens S, Byam CE, Duvick LA, Lai S, Jafar-Nejad P, Zoghbi HY, Clark HB, Orr HT. Phosphorylation of ATXN1 at Ser776 in the cerebellum. J Neurochem. 2009;110:675–686. doi: 10.1111/j.1471-4159.2009.06164.x. [DOI] [PMC free article] [PubMed] [Google Scholar]
- 13.Chen HK, Fernandez-Funez P, Acevedo SF, Lam YC, Kaytor MD, Fernandez MH, Aitken A, Skoulakis EM, Orr HT, Botas J, Zoghbi HY. Interaction of Akt-phosphorylated ataxin-1 with 14-3-3 mediates neurodegeneration in spinocerebellar ataxia type 1. Cell. 2003;113:457–468. doi: 10.1016/s0092-8674(03)00349-0. [DOI] [PubMed] [Google Scholar]
- 14.Lai S, O’Callaghan B, Zoghbi HY, Orr HT. 14-3-3 Binding to ataxin-1(ATXN1) regulates its dephosphorylation at Ser-776 and transport to the nucleus. J Biol Chem. 2011;286:34606–34616. doi: 10.1074/jbc.M111.238527. [DOI] [PMC free article] [PubMed] [Google Scholar]
- 15.de Chiara C, Menon RP, Strom M, Gibson TJ, Pastore A. Phosphorylation of S776 and 14-3-3 binding modulate ataxin-1 interaction with splicing factors. PLoS One. 2009;4:e8372. doi: 10.1371/journal.pone.0008372. [DOI] [PMC free article] [PubMed] [Google Scholar]
- 16.Lim J, Crespo-Barreto J, Jafar-Nejad P, Bowman AB, Richman R, Hill DE, Orr HT, Zoghbi HY. Opposing effects of polyglutamine expansion on native protein complexes contribute to SCA1. Nature. 2008;452:713–718. doi: 10.1038/nature06731. [DOI] [PMC free article] [PubMed] [Google Scholar]
- 17.Park J, Al-Ramahi I, Tan Q, Mollema N, Diaz-Garcia JR, Gallego-Flores T, Lu HC, Lagalwar S, Duvick L, Kang H, Lee Y, Jafar-Nejad P, Sayegh LS, Richman R, Liu X, Gao Y, Shaw CA, Arthur JS, Orr HT, Westbrook TF, Botas J, Zoghbi HY. RAS-MAPK-MSK1 pathway modulates ataxin 1 protein levels and toxicity in SCA1. Nature. 2013;498:325–331. doi: 10.1038/nature12204. [DOI] [PMC free article] [PubMed] [Google Scholar]
- 18.Hearst SM, Lopez ME, Shao Q, Liu Y, Vig PJ. Dopamine D2 receptor signaling modulates mutant ataxin-1 S776 phosphorylation and aggregation. J Neurochem. 2010;114:706–716. doi: 10.1111/j.1471-4159.2010.06791.x. [DOI] [PMC free article] [PubMed] [Google Scholar]
- 19.Hearst SM, Shao Q, Lopez M, Raucher D, Vig PJ. The design and delivery of a PKA inhibitory polypeptide to treat SCA1. J Neurochem. 2014;131:101–114. doi: 10.1111/jnc.12782. [DOI] [PubMed] [Google Scholar]
- 20.Servadio A, Koshy B, Armstrong D, Antalffy B, Orr HT, Zoghbi HY. Expression analysis of the ataxin-1 protein in tissues from normal and spinocerebellar ataxia type 1 individuals. Nat Genet. 1995;10:94–98. doi: 10.1038/ng0595-94. [DOI] [PubMed] [Google Scholar]
- 21.Morgan DJ, Weisenhaus M, Shum S, Su T, Zheng R, Zhang C, Shokat KM, Hille B, Babcock DF, McKnight GS. Tissue-specific PKA inhibition using a chemical genetic approach and its application to studies on sperm capacitation. Proc Natl Acad Sci U S A. 2008;105:20740–20745. doi: 10.1073/pnas.0810971105. [DOI] [PMC free article] [PubMed] [Google Scholar]
- 22.Hayashi S, Lewis P, Pevny L, McMahon AP. Efficient gene modulation in mouse epiblast using a Sox2Cre transgenic mouse strain. Mech Dev. 2002;119(Suppl 1):S97–S101. doi: 10.1016/s0925-4773(03)00099-6. [DOI] [PubMed] [Google Scholar]
- 23.Lorenzetti D, Watase K, Xu B, Matzuk MM, Orr HT, Zoghbi HY. Repeat instability and motor incoordination in mice with a targeted expanded CAG repeat in the Sca1 locus. Hum Mol Genet. 2000;9:779–785. doi: 10.1093/hmg/9.5.779. [DOI] [PubMed] [Google Scholar]
- 24.Matilla A, Roberson ED, Banfi S, Morales J, Armstrong DL, Burright EN, Orr HT, Sweatt JD, Zoghbi HY, Matzuk MM. Mice lacking ataxin-1 display learning deficits and decreased hippocampal paired-pulse facilitation. J Neurosci. 1998;18:5508–5516. doi: 10.1523/JNEUROSCI.18-14-05508.1998. [DOI] [PMC free article] [PubMed] [Google Scholar]
- 25.Burright EN, Clark HB, Servadio A, Matilla T, Feddersen RM, Yunis WS, Duvick LA, Zoghbi HY, Orr HT. SCA1 transgenic mice: a model for neurodegeneration caused by an expanded CAG trinucleotide repeat. Cell. 1995;82:937–948. doi: 10.1016/0092-8674(95)90273-2. [DOI] [PubMed] [Google Scholar]
- 26.Kim D, Pertea G, Trapnell C, Pimentel H, Kelley R, Salzberg SL. TopHat2: accurate alignment of transcriptomes in the presence of insertions, deletions and gene fusions. Genome Biol. 2013;14:R36. doi: 10.1186/gb-2013-14-4-r36. [DOI] [PMC free article] [PubMed] [Google Scholar]
- 27.Roberts A, Trapnell C, Donaghey J, Rinn JL, Pachter L. Improving RNA-Seq expression estimates by correcting for fragment bias. Genome Biol. 2011;12:R22. doi: 10.1186/gb-2011-12-3-r22. [DOI] [PMC free article] [PubMed] [Google Scholar]
- 28.Trapnell C, Williams BA, Pertea G, Mortazavi A, Kwan G, van Baren MJ, Salzberg SL, Wold BJ, Pachter L. Transcript assembly and quantification by RNA-Seq reveals unannotated transcripts and isoform switching during cell differentiation. Nat Biotechnol. 2010;28:511–515. doi: 10.1038/nbt.1621. [DOI] [PMC free article] [PubMed] [Google Scholar]
- 29.Trapnell C, Roberts A, Goff L, Pertea G, Kim D, Kelley DR, Pimentel H, Salzberg SL, Rinn JL, Pachter L. Differential gene and transcript expression analysis of RNA-seq experiments with TopHat and Cufflinks. Nat Protoc. 2012;7:562–578. doi: 10.1038/nprot.2012.016. [DOI] [PMC free article] [PubMed] [Google Scholar]
- 30.Goff L, Trapnell C, Kelley D. Cummerbund: Analysis, exploration, manipulation and visualization of Cufflinks high-throughput sequencing data. 2012 R package versoin 2.8.2, http://compbio.mit.edu/cummeRbund/
- 31.Andrews S. A quality control tool for high throughput sequence data. Babraham Bioinformatics. https://www.bioinformatics.babraham.ac.uk/projects/fastqc/
- 32.Bolger AM, Lohse M, Usadel B. Trimmomatic: a flexible trimmer for Illumina sequence data. Bioinformatics. 2014;30:2114–2120. doi: 10.1093/bioinformatics/btu170. [DOI] [PMC free article] [PubMed] [Google Scholar]
- 33.Langfelder P, Horvath S. WGCNA: an R package for weighted correlation network analysis. BMC Bioinformatics. 2008;9:559. doi: 10.1186/1471-2105-9-559. [DOI] [PMC free article] [PubMed] [Google Scholar]
- 34.Heerding DA, Rhodes N, Leber JD, Clark TJ, Keenan RM, Lafrance LV, Li M, Safonov IG, Takata DT, Venslavsky JW, Yamashita DS, Choudhry AE, Copeland RA, Lai Z, Schaber MD, Tummino PJ, Strum SL, Wood ER, Duckett DR, Eberwein D, Knick VB, Lansing TJ, McConnell RT, Zhang S, Minthorn EA, Concha NO, Warren GL, Kumar R. Identification of 4-(2-(4-amino-1,2,5-oxadiazol-3-yl)-1-ethyl-7-([(3S)-3-piperidinylmethyl]oxy)-1H-imidazo[4,5-c]pyridin-4-yl)-2-methyl-3-butyn-2-ol (GSK690693), a novel inhibitor of AKT kinase. J Med Chem. 2008;51:5663–5679. doi: 10.1021/jm8004527. [DOI] [PubMed] [Google Scholar]
- 35.Rhodes N, Heerding DA, Duckett DR, Eberwein DJ, Knick VB, Lansing TJ, McConnell RT, Gilmer TM, Zhang SY, Robell K, Kahana JA, Geske RS, Kleymenova EV, Choudhry AE, Lai Z, Leber JD, Minthorn EA, Strum SL, Wood ER, Huang PS, Copeland RA, Kumar R. Characterization of an Akt kinase inhibitor with potent pharmacodynamic and antitumor activity. Cancer Res. 2008;68:2366–2374. doi: 10.1158/0008-5472.CAN-07-5783. [DOI] [PubMed] [Google Scholar]
- 36.Naqvi S, Macdonald A, McCoy CE, Darragh J, Reith AD, Arthur JS. Characterization of the cellular action of the MSK inhibitor SB-747651A. Biochem J. 2012;441:347–357. doi: 10.1042/BJ20110970. [DOI] [PubMed] [Google Scholar]
- 37.Uhler MD, McKnight GS. Expression of cDNAs for two isoforms of the catalytic subunit of cAMP-dependent protein kinase. J Biol Chem. 1987;262:15202–15207. [PubMed] [Google Scholar]
- 38.Cadd G, McKnight GS. Distinct patterns of cAMP-dependent protein kinase gene expression in mouse brain. Neuron. 1989;3:71–79. doi: 10.1016/0896-6273(89)90116-5. [DOI] [PubMed] [Google Scholar]
- 39.Lein ES, Hawrylycz MJ, Ao N, Ayres M, Bensinger A, Bernard A, Boe AF, Boguski MS, Brockway KS, Byrnes EJ, Chen L, Chen TM, Chin MC, Chong J, Crook BE, Czaplinska A, Dang CN, Datta S, Dee NR, Desaki AL, Desta T, Diep E, Dolbeare TA, Donelan MJ, Dong HW, Dougherty JG, Duncan BJ, Ebbert AJ, Eichele G, Estin LK, Faber C, Facer BA, Fields R, Fischer SR, Fliss TP, Frensley C, Gates SN, Glattfelder KJ, Halverson KR, Hart MR, Hohmann JG, Howell MP, Jeung DP, Johnson RA, Karr PT, Kawal R, Kidney JM, Knapik RH, Kuan CL, Lake JH, Laramee AR, Larsen KD, Lau C, Lemon TA, Liang AJ, Liu Y, Luong LT, Michaels J, Morgan JJ, Morgan RJ, Mortrud MT, Mosqueda NF, Ng LL, Ng R, Orta GJ, Overly CC, Pak TH, Parry SE, Pathak SD, Pearson OC, Puchalski RB, Riley ZL, Rockett HR, Rowland SA, Royall JJ, Ruiz MJ, Sarno NR, Schaffnit K, Shapovalova NV, Sivisay T, Slaughterbeck CR, Smith SC, Smith KA, Smith BI, Sodt AJ, Stewart NN, Stumpf KR, Sunkin SM, Sutram M, Tam A, Teemer CD, Thaller C, Thompson CL, Varnam LR, Visel A, Whitlock RM, Wohnoutka PE, Wolkey CK, Wong VY, Wood M, Yaylaoglu MB, Young RC, Youngstrom BL, Yuan XF, Zhang B, Zwingman TA, Jones AR. Genome-wide atlas of gene expression in the adult mouse brain. Nature. 2007;445:168–176. doi: 10.1038/nature05453. [DOI] [PubMed] [Google Scholar]
- 40.Bishop AC, Ubersax JA, Petsch DT, Matheos DP, Gray NS, Blethrow J, Shimizu E, Tsien JZ, Schultz PG, Rose MD, Wood JL, Morgan DO, Shokat KM. A chemical switch for inhibitor-sensitive alleles of any protein kinase. Nature. 2000;407:395–401. doi: 10.1038/35030148. [DOI] [PubMed] [Google Scholar]
- 41.Zhang C, Lopez MS, Dar AC, Ladow E, Finkbeiner S, Yun CH, Eck MJ, Shokat KM. Structure-guided inhibitor design expands the scope of analog-sensitive kinase technology. ACS Chem Biol. 2013;8:1931–1938. doi: 10.1021/cb400376p. [DOI] [PMC free article] [PubMed] [Google Scholar]
- 42.López-Otín C, Blasco MA, Partridge L, Serrano M, Kroemer G. The hallmarks of aging. Cell. 2013;153:1194–1217. doi: 10.1016/j.cell.2013.05.039. [DOI] [PMC free article] [PubMed] [Google Scholar]
- 43.Wang H, Feng R, Phillip Wang L, Li F, Cao X, Tsien JZ. CaMKII activation state underlies synaptic labile phase of LTP and short-term memory formation. Curr Biol. 2008;18:1546–1554. doi: 10.1016/j.cub.2008.08.064. [DOI] [PMC free article] [PubMed] [Google Scholar]
- 44.Ingram M, Wozniak EA, Duvick L, Yang R, Bergmann P, Carson R, O’Callaghan B, Zoghbi HY, Henzler C, Orr HT. Cerebellar Transcriptome Profiles of ATXN1 Transgenic Mice Reveal SCA1 Disease Progression and Protection Pathways. Neuron. 2016;89:1194–1207. doi: 10.1016/j.neuron.2016.02.011. [DOI] [PMC free article] [PubMed] [Google Scholar]
- 45.Zhang B, Horvath S. A general framework for weighted gene co-expression network analysis. Stat Appl Genet Mol Biol. 2005;4 doi: 10.2202/1544-6115.1128. Article17. [DOI] [PubMed] [Google Scholar]
- 46.Chijiwa T, Mishima A, Hagiwara M, Sano M, Hayashi K, Inoue T, Naito K, Toshioka T, Hidaka H. Inhibition of forskolin-induced neurite outgrowth and protein phosphorylation by a newly synthesized selective inhibitor of cyclic AMP-dependent protein kinase, N-[2-(p-bromocinnamylamino)ethyl]-5-isoquinolinesulfonamide (H-89), of PC12D pheochromocytoma cells. J Biol Chem. 1990;265:5267–5272. [PubMed] [Google Scholar]
- 47.Skinner PJ, Vierra-Green CA, Clark HB, Zoghbi HY, Orr HT. Altered trafficking of membrane proteins in purkinje cells of SCA1 transgenic mice. Am J Pathol. 2001;159:905–913. doi: 10.1016/S0002-9440(10)61766-X. [DOI] [PMC free article] [PubMed] [Google Scholar]
- 48.Serra HG, Byam CE, Lande JD, Tousey SK, Zoghbi HY, Orr HT. Gene profiling links SCA1 pathophysiology to glutamate signaling in Purkinje cells of transgenic mice. Hum Mol Genet. 2004;13:2535–2543. doi: 10.1093/hmg/ddh268. [DOI] [PubMed] [Google Scholar]
- 49.Chopra R, Wasserman AH, Pulst SM, De Zeeuw CI, Shakkottai VG. Protein kinase C activity is a protective modifier of Purkinje neuron degeneration in cerebellar ataxia. Hum Mol Genet. 2018;27:1396–1410. doi: 10.1093/hmg/ddy050. [DOI] [PMC free article] [PubMed] [Google Scholar]
- 50.Barnes JA, Ebner BA, Duvick LA, Gao W, Chen G, Orr HT, Ebner TJ. Abnormalities in the climbing fiber-Purkinje cell circuitry contribute to neuronal dysfunction in ATXN1[82Q] mice. J Neurosci. 2011;31:12778–12789. doi: 10.1523/JNEUROSCI.2579-11.2011. [DOI] [PMC free article] [PubMed] [Google Scholar]
- 51.Ebner BA, Ingram MA, Barnes JA, Duvick LA, Frisch JL, Clark HB, Zoghbi HY, Ebner TJ, Orr HT. Purkinje cell ataxin-1 modulates climbing fiber synaptic input in developing and adult mouse cerebellum. J Neurosci. 2013;33:5806–5820. doi: 10.1523/JNEUROSCI.6311-11.2013. [DOI] [PMC free article] [PubMed] [Google Scholar]
- 52.Cvetanovic M, Ingram M, Orr H, Opal P. Early activation of microglia and astrocytes in mouse models of spinocerebellar ataxia type 1. Neuroscience. 2015;289:289–299. doi: 10.1016/j.neuroscience.2015.01.003. [DOI] [PMC free article] [PubMed] [Google Scholar]
- 53.Rinaldo L, Hansel C. Muscarinic acetylcholine receptor activation blocks long-term potentiation at cerebellar parallel fiber-Purkinje cell synapses via cannabinoid signaling. Proc Natl Acad Sci U S A. 2013;110:11181–11186. doi: 10.1073/pnas.1221803110. [DOI] [PMC free article] [PubMed] [Google Scholar]
- 54.Müller Smith K, Williamson TL, Schwartz ML, Vaccarino FM. Impaired motor coordination and disrupted cerebellar architecture in Fgfr1 and Fgfr2 double knockout mice. Brain Res. 2012;1460:12–24. doi: 10.1016/j.brainres.2012.04.002. [DOI] [PMC free article] [PubMed] [Google Scholar]
Associated Data
This section collects any data citations, data availability statements, or supplementary materials included in this article.
Supplementary Materials
(A) Table of six small molecule inhibitors and their documented IC50 against PKA. (B) Dose response curves showing the inhibition of ATXN1[82]-S776 phosphorylation by mouse cerebellar lysate in the presence of six cell-characterized kinase inhibitors. The IC50s obtained for each are presented. NS = non-significant (p > 0.05), * p < 0.05.
(A) The rabbit polyclonal phospho-independent antibody 12NQ, (B) the rabbit polyclonal phospho-dependent antibody PN1249, (C) and the phospho-dependent mouse monoclonal antibody MoAb-17 detect full-length human ATXN1[30Q] transgenic protein (arrow, ~120 kDa) and full-length mouse endogenous protein (~80 kDa) in cerebellar homogenates. (A-C) After detection with ATXN1 antibodies, blots were stripped and re-probed for tubulin. (D) ELISA showing binding specificity of diluted MoAb-17 against an ATXN1 peptide featuring the phosphorylated (phospho) or non-phosphorylated (non-phospho) serine at the 776 residue.
(A) Western blot analysis of total ATXN1[82Q] in 4 wk old ATXN[82Q]-S776D/+; Atxn1−/−; and ATXN[82Q]-S776D/+; Atxn1−/−;CαM120A/M120A cerebella. (B) Quantitation of data in A. Data are represented as mean, ± SEM. T-test, p = 0.3432. Total ATXN1 was probed with antibody 11750.
(A) PKA Cα protein is destabilized with an M to A point mutation at amino acid 120, and this reduction persists up to 12 wks of age. (B) There is no compensatory upregulation in Msk1 levels at 4 and 12 wks. (C) There is a significant decrease in ATXN1[82Q]-pS776 at 4 wks, but the effect is attenuated by 8 wks and 12 wks, and is not statistically different from age-matched controls. (D) Total ATXN1[82Q] protein is reduced at 4 wks, but there is no change in total ATXN1[82Q] at 8 and 12 wks of age. The levels of phosphorylated and total Atxn1[2Q] are equal to wild type at all ages in both genotypes (not shown). (Data are represented as mean, ± SEM. Two-way ANOVA. * p < 0.05, ** p < 0.01, *** p < 0.001, **** p < 0.0001.
(A) Immunofluorescence staining using the Purkinje cell marker Calbindin was used to identify the molecular layer (ML) at 6 weeks and 12 weeks of age. ML thickness is an indicator of Purkinje cell integrity. (B) ML length (μm) was measured in the genotypes indicated, demonstrating the expected age-dependent atrophy in ATXN1[82Q], which was seen to a similar degree in ATXN1[82Q];CαM120A/M120A cerebella. CαM120A/M120A controls showed mild ML thinning compared to wt/FVB, but this was independent of age. Data are represented as mean ± SEM. Two-way ANOVA. * p < 0.05, ** p < 0.01, *** p < 0.001, **** p < 0.0001. Notice the symbol * indicates comparison between ages, and + indicates comparison to age-matched wild type.
(A-C) Organotypic cerebellar slices of Atxn12Q/2Q;CαM120A/M120A pups (P10 ± 2d) were grown in culture for 1 day and treated with vehicle (DMSO), 20 μM 1-NM-PP1, or 10 μM GSK690693 for 3 more days, replacing the drug daily. (B) Inhibition of phosphorylation of PKA substrates was detected in samples treated with 10 μM GSK690693, but not in samples treated with 20 μM 1-NM-PP1, demonstrating a failure of 1-NM-PP1 to block PKA CαM120A activity. (C) Decrease in total Atxn1[2Q] was observed with 10 μM GSK690693, but not by 20 μM 1-NM-PP1 treatment that failed to block PKA CαM120A. Biological replicates (n) are indicated in bars. Data are represented as mean, ± SEM. One-Way ANOVA, Dunnett post hoc test. * p < 0.05, ** p < 0.01. (D) Cerebellar extracts of mice expressing PKA CαM120A were used as kinase source to phosphorylate purified GST-ATXN1[30Q] in vitro. Subtle inhibition of S776 phosphorylation is seen at 10 μM 1-NM-PP1, the highest dose tested. In contrast, ATXN1[30Q]-S776 phosphorylation is blocked with as little as 10 nM of GSK690693.
Additional file 8: Table S2. SCA1 WGCNA Pink Module Gene List. Values that were not significantly differentially expressed are omitted (Module correlation ≥ 0.9).
Additional file 7: Table S1. ATXN1 mouse cerebellar RNA-seq summary.
Additional file 9: Table S3. Genes associated with Figure 5B. Expression is based on in situ hybridization, Allen Brain Atlas. Protein type and function was derived from genecards.org.
Additional file 10: Table S4. Complete list of genes in the Gq signaling pathway contained in the IPA of the Pink-ataxia module.