

Abstract
A set of missense mutations in the gene encoding profilin-1 has been linked to the onset of familial forms of ALS (fALS), also known as Lou Gehrig's disease. The pathogenic potential of these mutations is linked to the formation of intracellular inclusions of the mutant proteins and correlates with the mutation-induced destabilization of its native, fully folded state. However, the mechanism by which these mutations promote misfolding and self-assembly is yet unclear. Here, using temperature-jump and stopped-flow kinetic measurements, we show that, during refolding, WT profilin-1 transiently populates a partially folded (PF) state endowed with hydrophobic clusters exposed to the solvent and with no detectable secondary structure. We observed that this conformational state is marginally stable at neutral pH but becomes significantly populated at mildly acidic pH. Interestingly, the fALS-associated mutations did not cause a change in the refolding mechanism of profilin-1, but induced a stabilization of the PF state. In the presence of preformed profilin-1 aggregates, the PF state, unlike the unfolded and folded states, could interact with these aggregates via nonspecific hydrophobic interactions and also increase thioflavin-T fluorescence, revealing its amyloidogenic potential. Moreover, in the variants tested, we found a correlation between conformational stability of PF and aggregation propensity, defining this conformational state as an aggregation-prone folding intermediate. In conclusion, our findings indicate that mutation-induced stabilization of a partially folded state can enhance profilin-1 aggregation and thereby contribute to the pathogenicity of the mutations.
Keywords: amyotrophic lateral sclerosis (ALS) (Lou Gehrig disease), protein folding, protein misfolding, aggregation, amyloid, neurodegenerative disease, profilin, ALS, Lou Gehrig Disease, protein dynamics, protein self-assembly
Introduction
ALS, also known as Lou Gehrig's disease, is a progressive neurodegenerative disease involving degeneration of motoneurons of the primary motor cortex, corticospinal tracts, brainstem, and spinal cord, resulting in progressive muscle weakness, atrophy, fasciculation, spasticity, and difficulty in moving, speaking, swallowing, and breathing (1–3). Whereas in most cases, the disease is sporadic (sALS),2 ∼10% of cases consist of an inherited familial form (fALS), with ∼20 genes involved (4). It was recently found that the gene PFN1, located on chromosome 17, is the site of a set of fALS-linked mutations and is among the genes that have been associated with fALS (5–8).
PFN1 encodes for profilin-1, a 139-residue-long α+β protein consisting of a seven-stranded β-sheet packed between three helices (Fig. 1). This protein is normally implicated in the regulation of actin polymerization. Profilin-1 binds to monomeric G-actin and regulates the growth of F-actin filaments through the exchange between ADP and ATP (9). Furthermore, profilin-1 is required for the early development of the brain (10). Indeed, in mouse models, this protein has been found to be necessary for the radial migration of cerebellar granule neurons and for their adhesion to glia (10). Recently, some profilin-1 variants have been associated with ALS thanks to the early identification of four mutations in the PFN1 gene of patients suffering from fALS: C71G, M114T, E117G, and G118V (5). A second set of mutations has been identified following this pivotal study: A20T (8), T109M (7), R136W (6), and Q139L (8). The positions that are the sites of these mutations are depicted in Fig. 1. These mutations exert different levels of pathogenicity. The E117G and the Q139L seem to represent moderate risk factors or benign polymorphisms, as these mutations have also been found in healthy individuals or sALS cases (5, 8). The R136W has an uncertain effect, as this mutation was identified only in a female early onset ALS patient, whereas no other ALS cases were found in the same family (6).
Figure 1.
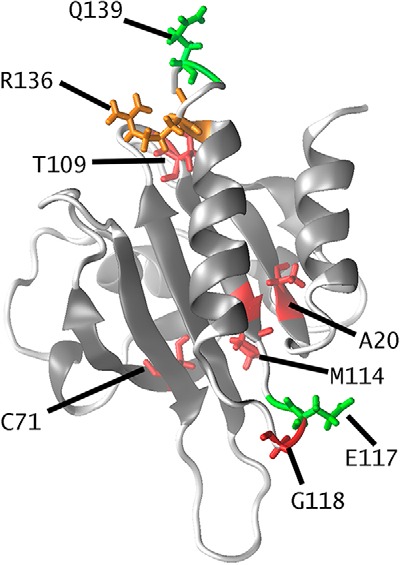
Structure of profilin-1 (Protein Data Bank code 1PFN) color-coded to illustrate residues for which either fALS-related mutations (Ala-20, Cys-71, Thr-109, Met-114, Gly-118, in red), benign polymorphisms or moderate risk factors (Glu-117 and Gln-139, in green), or uncertain effect (Arg-136, in orange) have been reported.
Cultured immortalized cells and primary motoneurons transfected with profilin-1 show that, among the four mutations initially identified, the C71G, M114T, and G118V protein variants exhibit diminished actin-binding capability and deposit into ubiquitinated, insoluble aggregates that contain another ALS-associated protein, TAR DNA-binding protein 43 (TDP-43) (5). In a study conducted on transgenic mice expressing human profilin-1, the C71G variant, but not the WT, appeared to be able to disrupt the cytoskeleton, increase ubiquitin and p62/SQSTM levels in motor neurons, and form intracellular insoluble deposits, leading to progressive muscle weakness, ending in paralysis and death (11). Interestingly, the damage precedes deposition, suggesting that formation of mature aggregates may not be the sole cause of motor neuron degeneration (11), although it is likely that misfolding and oligomer formation of profilin-1 contributes significantly to its onset (9). In a similar line of research, other authors found that expression of C71G profilin-1 in cultured mouse hippocampal neurons results in increased dendritic arborization and spine formation and leads to the formation of cytoplasmic inclusions (12). In the group of mutations identified more recently, the A20T mutation causes protein aggregation and formation of insoluble high-molecular weight species in transient transfections of HEK203T cells and in fibroblasts extracted from ALS patients (8).
Although all four initially identified ALS mutations are located in the actin-binding site of profilin-1, leading to the hypothesis that they affect the binding of the protein to actin (5), the mutations identified more recently are not located in that site. Moreover, only the G118V mutant, among the four variants initially identified, changed the rate of actin polymerization in vitro relative to the WT protein, ruling out a general mechanism of action of mutant profilin-1 that involves impaired actin binding (13). This conclusion is corroborated by another report showing that the T109M substitution displays unaltered actin binding of profilin-1 and does not affect actin cytoskeleton in vivo (14). Therefore, the lack of binding of mutant profilin-1 to actin and the ability to regulate cytoskeleton growth, when observed, are likely to result from the mutation-induced misfolding of the protein rather than from the ability of the mutation to interfere with actin binding within a context of fully folded profilin-1.
By exploiting a battery of biophysical techniques, two independent studies showed that the mutations promote aggregation of profilin-1 by destabilizing its native structure, thus enabling conformational changes that result in either stable modified folded structures (15, 16) or transiently populated unfolded states (13). Moreover, a positive correlation has been found between such a destabilization and aggregation propensity in a group of profilin-1 variants (15, 16). Furthermore, it was recently found that co-expression of TDP-43 and fALS-associated profilin-1 mutants increased cytoplasmic localization of TDP-43 and exacerbated TDP-43-induced retinal degeneration in a Drosophila melanogaster model (17). These findings corroborate the idea that profilin-1 mutants induce the cytosolic accumulation of TDP-43, possibly via the conversion of normal nuclear TDP-43 into an aberrant cytosolic form (18). Hence, it is clear that the fALS-associated profilin-1 mutations induce protein aggregation and deposition of profilin-1 and TDP-43, a cascade that culminates in cellular dysfunction (9, 13, 15).
In the search for possible nonnative conformations populated by profilin-1, we investigated the folding process of the WT protein (19). Equilibrium and kinetic folding/unfolding data, acquired at different urea concentrations and monitored via intrinsic tryptophan fluorescence, could be interpreted by a two-state model, in which the protein populates only two conformational ensembles, the folded (F) and the unfolded (U) states, whereas conversion between U and F occurs through a cooperative reversible transition (19). Despite these pieces of evidence, the comparison between the spectroscopic signals associated with U and the beginning of the refolding time course revealed a burst phase taking place at the beginning of the refolding experiment, within the dead time, and escaping direct detection. This phase consisted of the transient formation of a third, previously undetected, partially folded ensemble (PF), which is characterized by a far-UV CD and tryptophan fluorescence comparable with U, but inducing fluorescence of 8-anilinonaphthalene-1-sulfonic acid (ANS) (19). Therefore, these experiments allowed this PF state to be described as a pre-molten globule conformational state with a free energy similar to that of the U state and possessing solvent-exposed collapsed hydrophobic clusters, in the absence of detectable secondary structure (19).
Although these experiments point toward a three-state reaction scheme, in which the protein populates the F, U, and PF states, ANS fluorescence remains the only experimental evidence available so far of the formation of PF. Consequently, in the present study, we undertook a series of kinetic experiments on WT profilin-1 and on a set of mutants, with the goal of further characterizing the PF state and investigating possible roles played by such a previously undetected conformational state in the onset of PFN1-linked fALS. We will show that the PF state of profilin-1 is able to interact with preformed aggregates of the same protein and that a positive correlation exists between the previously described aggregation propensity and the conformational stability of the PF state in a group of fALS mutants.
Results
T-jump experiments provide evidence for the formation of PF in WT profilin-1
Formation/disruption of the profilin-1 PF state escaped detection by conventional refolding experiments, and this suggests that this process is completed within the dead time of conventional stopped-flow measurements (i.e. ∼10 ms). To overcome this limitation, we performed T-jump experiments (Fig. 2, A and B), a methodology that allows dead times shorter than 0.1 ms to be achieved. The G-buffer previously employed for studying profilin-1 (15, 16, 19) is incompatible with these experiments, because pKa of Tris has a strong dependence on temperature (d(pKa)/dT = −0.028 °C−1 at 25 °C) (20). Consequently, the experiments were performed in phosphate buffer (d(pKa)/dT = −0.0022 °C−1 at 25 °C) (20). When profilin-1 underwent a temperature jump from 28 to 37 °C in the presence of different concentrations of denaturant, the emitted fluorescence exhibited a rapid decrease, complete in ∼4 ms (Fig. 2A). No change in emission was detected when we repeated the experiment with N-acetyl-l-tryptophanamide or under conditions in which the protein folds following a two-state equilibrium (Fig. S3). As expected, such a time scale is within the dead time of stopped-flow kinetics (∼10 ms), but not of T-jump kinetics (∼100 μs). Thus, this experiment provided direct evidence of the transient formation of the PF state and paved the way to the possibility of investigating the kinetics and thermodynamics of formation of such a conformational state.
Figure 2.
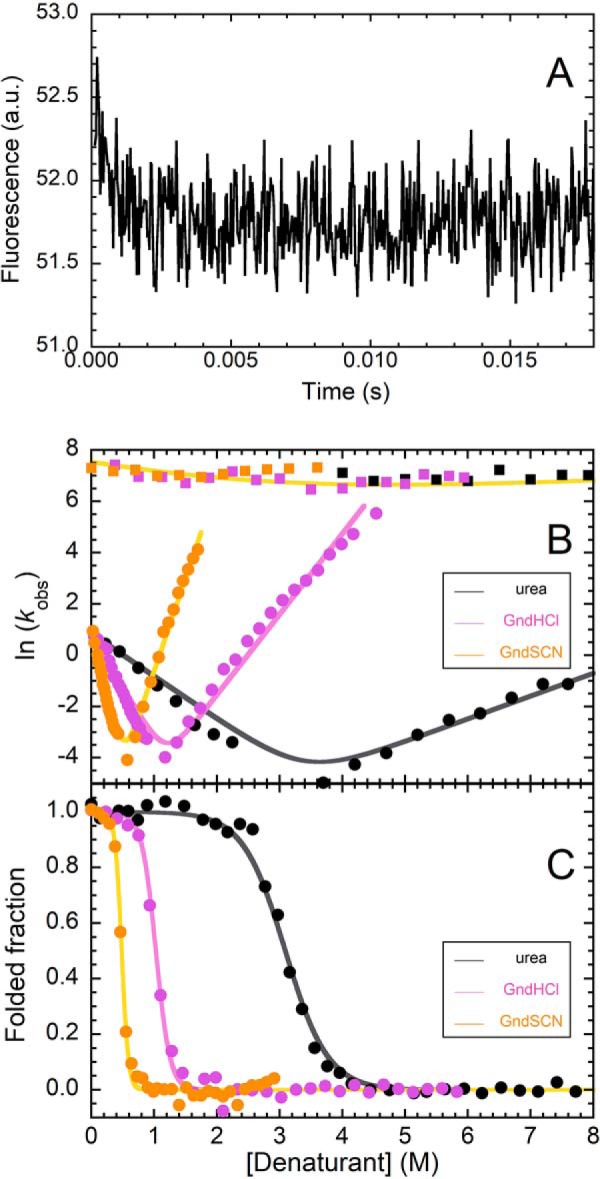
A, representative T-jump experiment of WT profilin-1, carried out at 2 m GdnHCl, showing the occurrence of a fast phase, complete within ∼3 ms. The trace is the average of 20 measurements. B, natural logarithm of the observed folding–unfolding microscopic rate constants (kobs) measured as a function of GdnSCN (yellow), GdnHCl (light purple), and urea (black) concentrations (chevron plots). Values for the fast phase (squares) and slow phases (circles) are shown. Continuous lines, best fits obtained from a global fitting procedure, in which only folding and unfolding rate constants in the absence of denaturant were shared among the data sets (see “Experimental procedures” for details). C, fraction of folded protein at equilibrium plotted against the concentration of GdnSCN (yellow), GdnHCl (light purple), and urea (black). Traces in all panels were obtained in a 50 mm phosphate buffer with 150 mm NaCl, pH 7.4.
Chevron plots of WT profilin-1 are best interpreted by a three-state model
The transient formation of partially folded states is usually revealed by a downward curvature in the plot showing the natural logarithm of the refolding/unfolding rate constants versus denaturant concentration (i.e. chevron plot) (21). However, we could not observe one such trend in our previous investigations, carried out on profilin-1 in G-buffer at 25 °C (19). Consequently, we measured the rate constants for the fast (T-jump) and slow (stopped-flow) refolding/unfolding phases in phosphate buffer at 37 °C. Furthermore, we performed these experiments in the presence of three different denaturants: urea, GdnHCl, and GdnSCN. The rationale behind this approach is that, as GdnHCl and GdnSCN have a stronger denaturing effect than urea, a possible weak curvature in the presence of the latter may become more evident in the presence of guanidine salts. Experimental data are shown in Fig. 2B and reveal, under these conditions, a weak downward curvature in the unfolding limb of the chevron plots obtained with all denaturants. We analyzed kinetic data with a procedure of global fitting in which refolding/unfolding rate constants in the absence of denaturant were shared among the data sets collected with the three denaturants, whereas the dependences of the refolding/unfolding rate constants on denaturant concentration varied independently for the three denaturants. Results of this analysis led to values of 1490 ± 70 and 400 ± 40 s−1 for refolding (kF1H2O) and unfolding (kU1H2O) fast phases and values of 2.34 ± 0.10 and 0.0004 ± 0.00004 s−1 for refolding (kF2H2O) and unfolding (kU2H2O) slow phases (Table S1). These values can be combined to calculate the conformational stability of F relative to U (ΔGU–FH2O), leading to a value of 25.8 ± 2.0 kJ mol−1 and of PF with respect to U (ΔGU–PFH2O), resulting in 3.4 ± 2.0 kJ mol−1.
We compared the results obtained with those of equilibrium denaturation experiments performed under the same conditions with the three denaturants (Fig. 2C). Experimental data were analyzed with a procedure of global fitting to determine the best ΔGU–FH2O value. The results of this analysis led to a value of ΔGU–FH2O of 23.5 ± 2.0 kJ mol−1. We also reported equilibrium Cm and m values in Table S1. The table shows that equilibrium m and Cm are compatible, within experimental error, with the values obtained from kinetics, further confirming that profilin-1 unfolding/refolding is a reversible process with all of the denaturants employed here. The ΔGU–FH2O values obtained here with kinetic and equilibrium experiments are in agreement, within experimental error, with each other and with those previously reported under slightly different conditions (19, 22). Taken together, these results indicate that unfolding/refolding data of WT profilin-1 are best interpreted by a three-state equilibrium in which a poorly stable partially folded state transiently forms during folding.
Acidic pH decreases the stability of the F state in WT and mutant profilin-1
We then investigated whether fALS-associated mutations alter the equilibrium existing between F and PF states. In particular, we compared the WT protein with the G118V variant (5), which has a significantly increased propensity to aggregate compared with the WT (15). Given the poor stability exhibited by the PF state in the WT protein, we measured the stabilities of F and PF as a function of pH; indeed, a slightly acidic pH may destabilize differently the U and PF states, thus exacerbating the formation of the latter. As a preliminary experiment, we investigated the range of pH values in which WT and G118V profilin-1 remain folded. Because acid-induced denaturation of WT profilin-1 causes a red shift of its fluorescence emission, we measured the fluorescence center of mass (COM) as a function of pH, using various buffers at 25 °C (Fig. 3). The results of this experiment revealed that WT profilin-1 remains folded at pH higher than 4.0 with a COM value of ∼354 nm. Below this pH value, the F state undergoes a transition that can be detected as a red shift of emission, resulting in an increase of the COM value, and is complete at pH 3.0. At pH values lower than 3.0, the protein is fully unfolded and does not show further structural modifications, with a COM value of ∼367 nm. The G118V variant appears more sensitive to the decrease of pH; the transition from the folded to the acid-unfolded states is shifted to higher pH than observed for the WT protein as it takes place between pH values of 4.5 and 3.5. This is in agreement with the previously found lower conformational stability of this mutant (13, 15).
Figure 3.

Fluorescence COM, calculated as reported under “Experimental procedures,” plotted versus pH, for WT (black circles) and G118V (gray diamonds) profilin-1. This analysis reveals the transition from folded to acid-unfolded protein as a red shift (i.e. an increase in COM) occurring at low pH.
We then acquired chevron plots and equilibrium denaturant–induced curves for the WT and the G118V variants at different pH values, ranging from 7.0 to 3.0, using urea as a denaturant at 25 °C (Fig. 4A). These experiments allowed a profile of the folded fraction of each variant to be reconstructed as a function of both pH and urea concentration (Fig. S1). As expected, equilibrium denaturation data revealed apparent two-state transitions at all pH values for the variants tested (bottom panels in Fig. 4A and Fig. S2, B, D, F, H, J, and L). We analyzed these data as reported under “Experimental procedures” and listed the numerical values obtained for ΔGU–FH2O, Cm, and meq in Table S2. The concentration of middle denaturation decreased with pH. The lowest pH values at which F appeared to be, in the absence of denaturant, more stable than U were 3.5 and 4.0 for WT and G118V, respectively. The plot of ΔGU–FH2O versus pH shows that in both the WT and G118V variants, F becomes destabilized below pH 6.5 (Fig. 4B). However, the ΔGU–FH2O values of G118V profilin-1 are generally lower than those observed for the WT protein at corresponding pH values, and this, together with the destabilization induced by acidic pH, makes the mutant completely unfolded even in the absence of denaturant at pH lower than 4.0.
Figure 4.
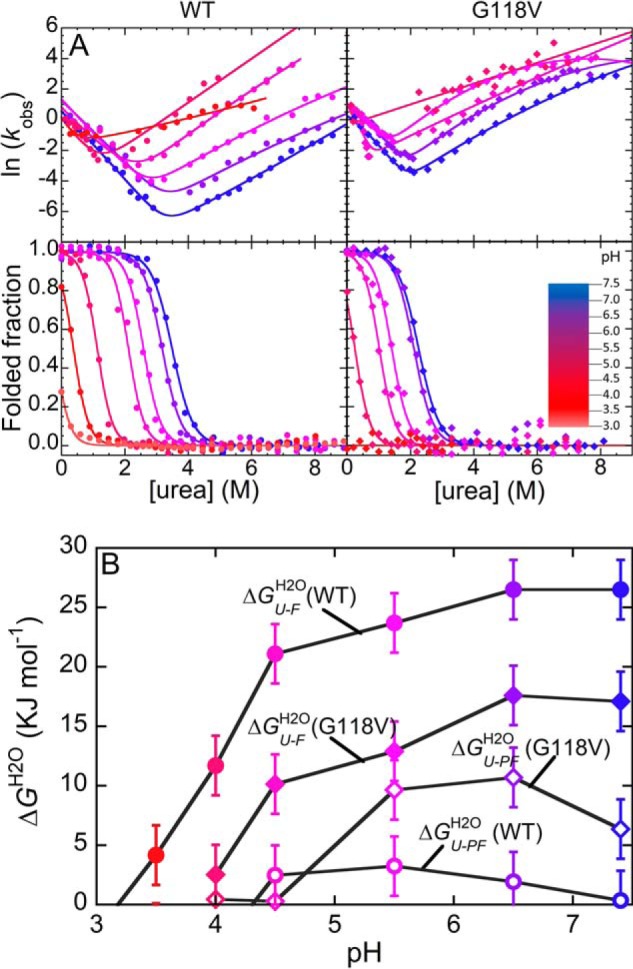
A, chevron plots (top panels) and equilibrium unfolding curves (bottom panels) for WT (circles, left panels) and G118V (diamonds, right panels) profilin-1, carried out at different pH values. As indicated by the color scale, color varies from blue to red as pH decreases from 7.0 to 3.0. B, conformational stabilities, calculated as free energy change following conversion into U for the PF (ΔGU–PFH2O, empty symbols) and F (ΔGU–FH2O, filled symbols) states of WT (circles) and G118V (diamonds) profilin-1. Error bars, S.D.
Equilibrium meq values showed a linear increase as pH decreases (Fig. 4A and Table S2). Indeed, meq appeared to be 7.59 ± 0.50 and 10.40 ± 0.50 kJ mol−1 m−1 at pH 7.4 and 4.0, respectively, as assessed by a fitting procedure in which meq values of the two variants were shared at each pH value. Equilibrium meq values are related to the change in solvent-accessible surface area upon unfolding (23). As profilin-1 net charge increases from +2.0 to +10.0 when pH decreases from 7.4 to 4.0, the trend observed may reflect an increasingly more expanded U state.
The G118V mutation and acidic pH increase the stability of the PF state
The analysis of the chevron plots obtained under identical conditions revealed a more complex behavior (top panels in Fig. 4A and Fig. S2, A, C, E, G, I, and K). In the case of the WT variant, refolding limbs exhibited a strong downward curvature as the pH decreases, whereas unfolding limbs appeared almost linear or weakly curved. This trend appeared most marked at pH 5.5 and 4.5. We observed a downward curvature even in the case of the G118V variant. However, this curvature was present even at physiological pH and could be detected in both the unfolding and the refolding limbs of the plot (insets in Fig. S2). We analyzed the data to calculate ΔGU–PFH2O at all pH values and reported the obtained values in Fig. 4B and Table S2. In this case, ΔGU–PFH2O was calculated as the difference between the equilibrium ΔGU–FH2O value and the conformational stability obtained by imposing linear (two-state) trends on the refolding/unfolding limbs of the chevron plots, which yielded ΔGU–PFH2O. In the case of the WT protein at pH 7.4, the PF state is energetically indistinguishable from U, with a ΔGU–PFH2O of 0.35 ± 2.50 kJ mol−1 (Table S2), as suggested previously (19). However, acidic pH increases the energy of U, and this renders the PF state relatively more stable, with a ΔGU–PFH2O of 3.24 ± 2.50 kJ mol−1 at pH 5.5 (Table S2). Below this pH value, the PF state appears increasingly destabilized and becomes too unstable, relative to U, to be significantly populated at pH 4.0. We found a different behavior for the G118V variant. Even at pH 7.4, the PF state is more stable than U, with a ΔGU–PFH2O of 6.36 ± 2.50 kJ mol−1. The stability of PF reaches its maximum at pH 6.5 (ΔGU–PFH2O = 10.70 ± 2.50 kJ mol−1) and decreases below this value, with ΔGU–PFH2O reaching a value of 0.29 ± 2.50 kJ mol−1 at pH 4.5.
Interestingly, the two chevron plots measured at the lowest pH (pH 3.5 and 4.0 for WT and G118V, respectively) significantly deviated from the behavior observed at higher pH, with smaller slope in the unfolding limbs (mU2 in Table S2) and higher slope in the refolding limbs (mF2 in Table S2). The ratio between mF2 and meq, usually referred to as the β-Tanford (βT) value, identifies the position of the folding transition state along the reaction coordinate and correlates with its structural compaction (24, 25). Consequently, this behavior may further corroborate the trend of ΔGU–PFH2O. The experimental data are compatible with the idea that the PF state is less stable than U at acidic pH; the refolding pathway switches from three-state to two-state, and the transition state moves along the reaction coordinate, becoming more compact. To corroborate this hypothesis, we performed T-jump relaxation kinetics at pH 3.5 and 4.0 for WT and G118V profilin-1, respectively. The results do not show detectable changes in fluorescence emission over time, thus showing that the PF state is not populated at these pH values (Fig. S3).
Refolding pathway is not altered by fALS-linked mutations
The experiments described above show that, in the case of WT profilin-1, PF can be energetically detected only at slightly acidic pH. In the case of the pathogenic variant G118V, we observed destabilization of the F state in the presence of a more stable PF state, even at physiological pH. We extended this analysis to other mutants of profilin-1, investigating all of the variants under the same experimental conditions (15). In our previous work, we had measured the chevron plots for the WT protein (19) and for the M114T, E117G, G118V, and C71G variants (15) in G-buffer at 25 °C. Here, we measured for the first time the chevron plots for the A20T and Q139L under the same experimental conditions (Fig. 5A). Among the previously investigated variants, we could not obtain the chevron plot for the T109M and R136W variants because of technical problems associated with the low purification yield, and consequently, we did not include these variants in the subsequent analysis. We analyzed the seven chevron plots, as reported under “Experimental procedures,” with a procedure of global fitting in which the two βT values (i.e. the two values for the two transition states, βT1 and βT2) were shared. The rationale of this approach is that the possibility of interpreting all of the datasets with the same βT values (i.e. with the same positions of the transition states) is in agreement with the idea that the same folding mechanism is able to interpret the behavior of all of the mutants (26). We reported the results of the fitting procedure in Table S3. Fig. 5A shows that this fitting strategy successfully interpreted experimental data, leading to shared βT values of 0.59 ± 0.02 and 0.79 ± 0.03 (fit errors). This result suggests that none of the mutations investigated induced a switch in the refolding mechanism. Rather, the mutations alter the relative stabilities of the F and PF states.
Figure 5.

A, global fitting procedure of the chevron plots measured for the indicated profilin-1 variants. The possibility to fit all of the chevron plots with shared βT values illustrates that all folding/unfolding data can be interpreted using the same model. In this case, we obtained βT1 = 0.59 ± 0.02 and βT2 = 0.79 ± 0.03 (fit errors). B, ThT emission during refolding of WT profilin-1 in the absence (black) or presence of preformed aggregates of profilin-1 (pink) or M-TTR (cyan). Control traces in the absence of refolding profilin-1 but in the presence of aggregates of profilin-1 (red) or M-TTR (blue) are shown. C, correlation between aggregation propensity, represented by the plateau ThT signal observed following aggregation (circles; linear fit shown as a continuous line) or by the percentage of light scattering intensity of the aggregates (squares; linear fit shown as a dashed line) and conformational stability of PF state, represented by ΔGU–PFH2O (p < 0.01 in both cases). The former values were obtained previously (15, 16). The color scale is as in A. D, comparison between the energy profiles for refolding of the WT and an aggregation-prone variant (e.g. G118V); the scheme illustrates that in the latter case, a more accessible aggregation-prone PF state favors aggregation.
We then exploited the same data sets to calculate all relevant parameters for each mutant under these experimental conditions, including the ΔGU–PFH2O values (Table S3). The analysis shows that the WT protein has the lowest value of ΔGU–PFH2O (0.34 ± 0.50 kJ mol−1); the two variants representing benign polymorphism or moderate risk factors have slightly higher values (2.17 ± 0.50 kJ mol−1 for E117G and 2.77 ± 0.50 kJ mol−1 for Q139L). The four pathogenic mutants analyzed here have the highest values (ranging from 3.62 ± 0.50 kJ mol−1 for M114T to 7.35 ± 0.50 kJ mol−1 for C71G).
The PF state is able to interact with aggregates
The observation that the aggregation prone mutations induce a destabilized F and a more stable PF relative to the WT counterpart raises the question of whether the PF state may play a role with respect to the aggregation propensity of profilin-1. We therefore investigated the propensity to aggregate of this conformational ensemble by testing its ability to interact with preformed amyloid-like aggregates, used in this case as seeds. In this experiment, we monitored in real time the emission of the amyloid-reporting dye thioflavin-T (ThT) during refolding of profilin-1 in the presence and absence of preformed seeds (27).
ThT emission during refolding of WT profilin-1 in the absence of seeds was identical to the signal of the blank, consisting of a ThT solution in the absence of protein (Fig. 5B). This finding reveals that neither the PF state nor the F state is inherently able to interact with the dye. Instead, we observed a significant emission of ThT relative to the blank in the presence of WT profilin-1 seeds but in the absence of WT profilin-1 undergoing refolding (Fig. 5B); this signal remains constant after injection of the aggregates into the cuvette. However, when we monitored refolding of WT profilin-1 in the presence of WT profilin-1 aggregates, a burst phase was observed, occurring within the dead time of the experiment, which consisted of an increase of ∼15% of the signal relative to that of seeds alone (Fig. 5B). After this initial jump, ThT emission decreased to the signal of the aggregates alone on a time scale that is slightly longer than the refolding slow phase (∼3 and 2 s in the presence and absence of aggregates, respectively). Consequently, this experiment revealed that WT profilin-1 is able to interact with WT profilin-1 aggregates while populating the PF state, as well as to interact with ThT and increase its fluorescence. It also indicates that, following conversion of this PF state bound to the aggregates into the folded state, the aggregates release the protein, which loses the ability to interact with ThT. The observed time scale is compatible with a transition from PF to F that is only marginally affected by the presence of ThT and aggregates.
As a control, we repeated the same experiment with WT profilin-1 undergoing refolding but in the presence of preformed aggregates of a control protein, namely a monomeric variant of human transthyretin (M-TTR), a protein whose aggregation has been reported to lead to the onset of several pathological conditions (28). Interestingly, we observed a behavior similar to that observed in the presence of preformed WT profilin-1 aggregates (Fig. 5B). Taken together, these experiments suggest that the ability to interact with aggregates exhibited by the PF state of profilin-1 is not linked to a specific structural template, which triggers self-assembly. Rather, hydrophobic moieties partially exposed to the solvent in the PF state make this conformational ensemble able to interact with and stick to any aggregated material.
The stability of PF correlates with amyloid propensity
Following the observation that the PF state is highly aggregation-prone and more stable in the pathogenic variants, we sought to establish a possible correlation between the stability of the PF state and the propensity to form amyloid-like aggregates in the group of profilin-1 variants studied here. A significant correlation was found between the conformational stability of the PF state relative to the U state (ΔGU–PFH2O) for each variant and two parameters reporting on the aggregation propensity of each variant, namely the maximum ThT signal observed following aggregation and the relative intensity of light scattered by the aggregates (Fig. 5C), with the latter values obtained previously (15, 16). The results of this analysis lead to the conclusion that a direct correlation exists between the stability of the PF state and the propensity to form ThT-positive assemblies observed within the set of profilin-1 variants investigated here (p < 0.01).
Discussion
In this work, we showed that refolding of profilin-1 proceeds through the transient accumulation of a PF state. Because this conformational state has a free energy, intrinsic fluorescence, and secondary structure content similar to that of U, it behaves as a “hidden” PF state and could only be detectable using ANS fluorescence in our previous work (19). In the present study, we obtained evidence for its existence using T-jump experiments, which allowed monitoring of the kinetics of its formation, as well as stopped-flow experiments at low pH and upon mutation, which stabilized it relative to U. The PF state is able to interact with preformed aggregates via nonspecific hydrophobic interactions, and its conformational stability correlates with the overall aggregation propensity exhibited within a set of ALS-linked protein variants.
Folding and misfolding have often been described as two opposite sides of the same coin. To reach the folded state, proteins transiently populate a set of intermediate species having increasing levels of structure, with the constant risk that these partially folded conformations undergo misfolding and initiate self-assembly. A general view is that, on the one hand, protein sequences are constantly subjected to an evolutionary pressure that makes them able to fold into the most stable conformation. On the other hand, the need to be functional leads to some amino acid substitutions, which introduce a certain degree of structural distortion into the folded state, usually referred to as protein frustration (29). The competition between folding and function sets the foundation for misfolding and, possibly, self-assembly. Indeed, residues important in the folding reaction may be prone to aggregate, but they fold at early times and are thus unable to trigger self-assembly. Vice versa, residues important for function are frustrated and not folded in the transition state. Thus, they are necessarily not prone to aggregate (30).
Profilin-1 follows this general trend, with no residues exceedingly frustrated and aggregation-prone at the same time (Fig. S4), when these two parameters are calculated with dedicated algorithms (31, 32). The ALS-linked mutations investigated here do not induce a dramatic increase in the inherent aggregation propensity (Fig. S4), suggesting that a different behavior may contribute to explain their aggregation propensity. Indeed, our data illustrate a scenario in which a hydrophobic PF state possibly initiating self-assembly is kept under control, at least in the case of the WT variant at physiological pH, by the high energy of this conformational state, which makes it poorly populated (Fig. 5D). However, ALS-linked mutations increase the population of this conformational state and, consequently, the risk of aggregation.
It was previously found that, whereas ALS-linked mutations severely destabilize the folded state of profilin-1 (13, 15, 16), the aggregation propensity of the protein does not correlate with destabilization of the folded state but, rather, with perturbations induced on the structure of the protein. This was observed by means of CD, intrinsic fluorescence spectroscopy, ANS binding, acrylamide quenching, and dynamic light scattering (15, 16), Accordingly, the M114T pathogenic variant induces a dramatic distortion of the protein core, whereas the E117G variant, occurring also in the control population, induces only minor perturbations (13). The coupling between a distorted folded state and a stabilized PF may significantly increase the equilibrium population of the PF state, thus triggering or enhancing aggregation. Interestingly, our data show that the entire set of chevron plots can be fitted with the same folding mechanism. This illustrates that the observed increase in aggregation propensity is not linked to a change in the compactness, and thus in the position along the folding reaction coordinate, of the PF and of the two transition states but, rather, to a change in the fraction of protein populating the PF conformation (Fig. 5D).
Interestingly, the G118V, C71G, and M114T, which show moderate to high aggregation propensities (Fig. 5C), exhibit a high degree of fALS penetrance and an age of onset of 44.8 ± 7.4 years, with limb onset (5). The A20T is highly prone to aggregate but was identified in only one patient, with a spinal onset of 63 years (8). The E117G and the Q139L show the lowest aggregation propensities (Fig. 5C) and represent moderate risk factors/benign polymorphisms (5, 8). Notwithstanding that, the correlation existing between conformational stability of the profilin-1 PF state, the aggregation propensity, and, possibly, disease severity/penetrance does not necessarily imply that the formation of this conformation is the event that triggers aggregation and disease. However, even if it is possible that the stabilization of PF is not a cause but rather a consequence of the increase in aggregation propensity, the present data point toward a major role played by alterations of the folding equilibrium and by structural perturbations of the F state in underlying the aggregation potential of profilin-1. Accordingly, relaxation dispersion NMR spectroscopy studies suggest that profilin-1 can form a sparsely populated tetrameric conformer in solution via a multistep process (33). Several cases of protein folding intermediates able to initiate self-assembly have been reported to date. A poorly populated (∼2%) on-pathway intermediate of the A39V/N53P/V55L variant of the Fyn SH3 domain was investigated via relaxation dispersion NMR spectroscopy (34). This analysis revealed that, whereas the β-sandwich topology is preserved in the intermediate state, the C-terminal segment of the protein is disordered, exposing an aggregation-prone β-strand that is buried and protected in the folded state, thus triggering self-assembly (34). The SH3 domain of α-spectrin populates a native-like intermediate during folding in which an unfolded β-strand underlies the ability to self-assemble and initiate aggregation (35). In the case of β2-microglobulin, a native-like intermediate, possessing a specific X-Pro peptide bond in the nonnative trans configuration, enhanced structural fluctuations, and highly flexible regions (36), is populated to ∼14% under physiological conditions and exhibits a 5-fold higher propensity to aggregate than the folded state (37). By comparing the folding energy landscape of human β2-microglobulin with that of the aggregation-resistant murine counterpart, NMR studies have shown that a decreased population of this aggregation-prone partially folded state leads to an increase of the energy barrier for amyloid formation (38). During folding of the mouse prion protein, two on-pathway folding intermediates form transiently (39). The intermediate that folds later along the reaction coordinate is a globally native-like state, possessing local disorder in specific regions. This conformation is able to initiate self-assembly (39). Recent single-molecule studies carried out on superoxide dismutase revealed a stable core of the protein, which refolds early (40). After this core has completed refolding, a set of intermediates form transiently during the process that leads to the folded state. Some of these intermediates branch off the refolding pathway, thus representing hubs between native and nonnative folding and possibly explaining the high propensity of this protein to misfold and aggregate (40). In the case of neuronal calcium sensor-1, force spectroscopy experiments identified two misfolding trajectories that originate from an on-pathway intermediate and compete with correct folding (41).
Conclusion
Our data illustrate that the mutation-induced stabilization of a partially folded state accumulating during folding can enhance the aggregation potential of profilin-1 and contribute to the pathogenicity of the mutations. Previous structural investigation of the four initially identified mutants of profilin-1 (5) has revealed a positive correlation between mutation-induced conformational destabilization of the folded state and aggregation propensity (13). Another study carried out on seven mutants has shown that the mutations induce structural perturbations of the folded state to an extent that correlates again with their aggregation propensity (15, 16). All such studies are consistent with the idea that all pathogenic mutations so far identified destabilize the folded state of profilin-1 and promote the formation of unfolded, partially folded, or alternative folded states, thus acting as misfolded states that have an aggregation propensity higher than that of the native, fully folded state. Such a “quantitative” cause–effect relationship between propensity to misfold and aggregate results in pathogenicity, as emerges from the many experimental observations that profilin-1 mutations induce formation of cytosolic inclusions of either profilin-1 itself, TDP-43, or both (5, 8, 9, 11, 12, 17).
Experimental procedures
Protein preparation
Proteins were expressed and purified starting from previously obtained DNA constructs and according to previously set up protocols (15, 16, 19).
T-jump experiments
We measured relaxation kinetics as a function of denaturant concentration by using a Hi-Tech PTJ-64 capacitor-discharge T-jump apparatus (Hi-Tech). Temperature was rapidly changed from 28 to 37 °C. 10–20 individual fluorescence traces were averaged for each value of denaturant concentration. Protein was typically 29.1 μm in a 50 mm phosphate buffer with 150 mm NaCl at pH 7.4. The excitation wavelength was 280 nm, and the fluorescence emission was measured using a 320-nm cut-off glass filter. The dead time was typically 110 μs. We performed these experiments in the presence of urea, guanidine hydrochloride, and thiocyanate ranging from 0 to 8, 6, and 3.6 m, respectively. We conducted control experiments under conditions in which we did not expect any change in fluorescence emission to occur: 1) experiments were carried out with N-acetyl-l-tryptophanamide (Sigma) in 50 mm phosphate buffer with 150 mm NaCl, pH 7.4, to rule out the possibility that the observed change in signal was due to nonspecific solvent effects, and 2) T-jump relaxation kinetics were recorded under conditions in which we did not expect the PF state to be populated (i.e. with 29.1 μm WT profilin-1 in 10 mm formate buffer with 100 mm NaCl at pH 3.5 and with 29.1 μm G118V profilin-1 in 10 mm acetate buffer with 100 mm NaCl at pH 4.0). In the latter case, the temperature jump was induced from 16 to 25 °C.
Acid-induced denaturation
We investigated acid-mediated denaturation of WT and G118V profilin-1 at a concentration of 2.65 μm. We prepared 33 samples containing 10 mm buffers at different pH, with a total ionic strength of 30 mm (using NaCl). Buffers employed were citrate between pH 2.2 and 2.8, formate between pH 2.9 and 3.9, acetate between pH 3.9 and 5.6, MES between pH 5.6 and 6.5, phosphate between pH 6.5 and 7.5, Tris between pH 7.5 and 8.8, and borate between pH 8.8 and 10.0. Chemicals were purchased from Sigma. After incubation for 1 h at 25 °C, we acquired fluorescence spectra between 300 and 450 nm with a PerkinElmer LS-55 spectrofluorometer (Waltham, MA), using a 10 × 2-mm cuvette (Hellma). Excitation wavelength was 280 nm. For each spectrum, we calculated the wavelength corresponding to the center of mass COM as ((ΣiviFi)/(ΣiFi))−1, where Fi is fluorescence emitted at a wavenumber of vi.
Equilibrium unfolding
We performed equilibrium unfolding experiments on WT profilin-1 and on the G118V variant at 37 °C, under a set of different experimental conditions. First, we investigated conformational stability of WT profilin-1 at a concentration of 2.65 μm in a 50 mm phosphate buffer with 150 mm NaCl at pH 7.4, exploiting three different denaturants: urea, GdnHCl, and GdnSCN (Sigma-Aldrich). 25–30 samples were prepared at final denaturant concentrations ranging from 0 to 3 m (GdnSCN), 6 m (GdnHCl), and 8 m (urea). After incubation for 1 h, we acquired fluorescence spectra with the PerkinElmer spectrofluorometer using the same parameters reported above. We processed the recorded spectra, calculating the ratio between the emissions at 369 and 319 nm (19). We then analyzed the obtained plots with a two-state transition (42) to yield the difference in free energy between folded and unfolded states in the absence of denaturant (ΔGU–FH2O), the dependence of ΔGU–F on denaturant concentration (m), and the concentration of middle denaturation (Cm). We normalized data to the fraction of folded protein and plotted results (Fig. 2).
In a second set of experiments, we performed the same equilibrium experiments at a concentration of 2.65 μm in 10 mm buffers at different pH, with a total ionic strength of 30 mm, achieved by adding NaCl and using urea as a denaturant at 25 °C. We performed experiments at pH 7.4 (Tris), 6.5 (MES), 5.5 (acetate), 4.5 (acetate), 4.0 (acetate), 3.5 (formate), and 3.0 (formate). In brief, we prepared 25–30 samples containing urea at concentrations ranging from 0 to 8 m at each pH value. After incubation for 1 h at 25 °C, we recorded fluorescence spectra of protein samples from 306 to 450 nm with a Synergy H1 hybrid multimode reader (BioTek, Winooski, VT). Excitation wavelength was 280 nm. Data were processed and analyzed as mentioned above (19, 42).
Folding and unfolding kinetics
In this work, we followed in real time refolding and unfolding of WT, A20T, and Q139L profilin-1 under different experimental conditions. For these experiments, we exploited a Bio-Logic (Claix, France) SFM-3 stopped-flow device equipped with an FC-08 cuvette and coupled to a fluorescence detection system. Unless otherwise specified, we used an excitation wavelength of 280 nm and a band-pass filter for cutting emitted fluorescence below 320 nm. The dead time was generally 6.1 ms. In all cases, traces were fitted to a single exponential function, as reported previously (15, 19), to gauge the rate constants of unfolding and folding under the conditions tested.
In a first set of experiments, we studied refolding and unfolding kinetics of WT profilin-1 at 37 °C in a 50 mm phosphate buffer with 150 mm NaCl, exploiting three different denaturants, urea, GdnHCl, and GdnSCN, which had been solubilized at concentrations of 8, 6, and 3 m, respectively. For the unfolding experiments, we diluted 10-fold native profilin-1 with denaturant to reach final concentrations ranging from 0.6 to 2 m (GdnSCN), from 1.1 to 4.5 m (GdnHCl), and from 3.5 to 8 m (urea). For refolding experiments, unfolded protein was diluted 10-fold to reach final denaturant concentrations ranging from 0.03 to 0.40 m (GdnSCN), from 0.04 to 0.9 m (GdnHCl), and from 0.23 to 2.4 m (urea). Final profilin-1 concentration was 2.65 μm in all cases.
In a second set of experiments, we followed folding/unfolding kinetics of WT and G118V profilin-1 to reconstruct the chevron plot of the two protein variants as a function of pH. We performed these experiments at pH 7.4 (Tris), 6.5 (MES), 5.5 (acetate), 4.5 (acetate), 4.0 (acetate), and 3.5 (formate). In all cases, final conditions were 10 mm buffers with an ionic strength of 30 mm achieved using NaCl, 25 °C, and urea concentrations ranging from 0 to 8 m. We analyzed the traces recorded as mentioned above and plotted data versus urea concentration. Final profilin-1 concentration was 2.65 μm in all cases.
In a third set of experiments, we reconstructed the chevron plot of two profilin-1 variants, namely A20T and Q139L. In this case, we performed folding/unfolding kinetics experiments in G-buffer (20 mm Tris, 2 mm DTT, 0.1 mm CaCl2, 0.2 mm NaN3, pH 7.3) at 25 °C and urea concentrations ranging from 0 to 8 m. Injection and acquisition parameters, as well as the analysis procedure, were identical to those reported above.
Characterization of PF
WT profilin-1 was acid-unfolded at a concentration of 26.6 μm in a 20 mm HCl solution (pH 1.7). We then induced refolding of the protein with the stopped-flow apparatus, mixing 1 volume of the protein solution with 9 volumes of a 55.5 mm phosphate buffer with 167 mm NaCl and 27.8 μm ThT at pH 7.4, 25 °C. Final conditions were 2.7 μm WT profilin-1, 50 mm phosphate, 150 mm NaCl, and 25 μm ThT, pH 7.4, 25 °C. ThT was excited at 440 nm, and the dye emission was monitored in real time with a 475-nm cut-off glass filter. Dead time in this case was 12.2 ms. We then repeated the same experiment in the presence of preformed aggregates of WT profilin-1 and of a variant of transthyretin (M-TTR), both at a final monomer concentration of 18 μm (added in the 9-volume syringe), both in the presence and absence of the acid-unfolded WT profilin-1 (in the 1-volume syringe). In all cases, we subtracted the ThT emission recorded in the absence of profilin-1 and preformed seeds, and we normalized the signal to the ThT emission recorded in the presence of preformed aggregates without profilin-1 undergoing refolding.
Data analysis
The three chevron plots obtained for WT profilin-1 in the presence of urea, GdnHCl, and GdnSCN were fitted globally with shared folding and unfolding rate constants in the absence of denaturants (kF1H2O, kF2H2O, kU1H2O, and kU2H2O) and unshared m values. Global fitting was performed with Matlab (43). We showed the results of this fitting procedure in Fig. 2B and Table S1.
The chevron plots obtained at different pH values were analyzed as follows. In a first step, we fitted equilibrium denaturation experiments as described (42) to obtain the conformational stability of the F state in the absence of denaturant (ΔGU–FH2O)eq and the m value (meq). In a second step, we employed the values obtained from this fitting procedure as constraints when kinetic data were fitted to the equation of a chevron plot with polynomial functions in the refolding/unfolding limbs (44),
| (1) |
where kobs is the experimentally observed kinetic rate constant; kF2H2O and kU2H2O are the refolding and unfolding rate constants for the slow phase; mF2 is the slope of the refolding limb; b and c account for the curvature in the refolding and unfolding limbs, respectively; and meq and (ΔGU–FH2O)eq were constrained from equilibrium experiments. We reported the results of this fitting procedure in Fig. 4A and Table S2. For the analysis of the chevron plots of the different profilin-1 variants, we exploited a global fitting procedure in which the two β-Tanford values (βT1 and βT2, which correspond to the first and second transition state, respectively) were shared. We fitted experimental data sets to the following equation (26, 45),
| (2) |
in which meq did not vary and was constrained to the value obtained previously from equilibrium denaturation experiments carried out under the same experimental conditions (15, 16, 19). Instead, βT1 and βT2 were allowed to vary but were shared among the different data sets. We present the results of this fitting procedure in Fig. 5A and Table S3.
Author contributions
E. D. P., A. T., C. A., F. D. P., L. G., S. G., and F. B. performed experiments; F. C. and F. B. provided material; S. G., F. B., F. C., and F. M. interpreted results; F. B. wrote the manuscript.
Supplementary Material
This work was supported in part by grants from the Italian Ministero dell'Istruzione, dell'Università e della Ricerca, Progetto di Interesse “Invecchiamento” (to S. G.) and Programma per Giovani Ricercatori “Rita Levi Montalcini” 2010 (to F. B.) and Sapienza University of Rome, Grants C26A155S48, B52F16003410005, and RP11715C34AEAC9B (to S. G.). The authors declare that they have no conflicts of interest with the contents of this article.
This article contains Tables S1–S3 and Figs. S1–S4.
- sALS
- sporadic ALS
- fALS
- familial ALS
- ANS
- 8-anilinonaphthalene-1-sulfonic acid
- F
- folded
- GdnHCl
- guanidinium hydrochloride
- GdnSCN
- guanidinium thiocyanate
- PF
- partially folded
- TDP-43
- TAR DNA-binding protein
- U
- unfolded
- COM
- center of mass.
References
- 1. Finsterer J., and Burgunder J. M. (2014) Recent progress in the genetics of motor neuron disease. Eur. J. Med. Genet. 57, 103–112 10.1016/j.ejmg.2014.01.002 [DOI] [PubMed] [Google Scholar]
- 2. Wijesekera L. C., and Leigh P. N. (2009) Amyotrophic lateral sclerosis. Orphanet J. Rare Dis. 4, 3 10.1186/1750-1172-4-3 [DOI] [PMC free article] [PubMed] [Google Scholar]
- 3. Rowland L. P., and Shneider N. A. (2001) Amyotrophic lateral sclerosis. N. Engl. J. Med. 344, 1688–1700 10.1056/NEJM200105313442207 [DOI] [PubMed] [Google Scholar]
- 4. Renton A. E., Chiò A., and Traynor B. J. (2014) State of play in amyotrophic lateral sclerosis genetics. Nat. Neurosci. 17, 17–23 10.1038/nn.3584 [DOI] [PMC free article] [PubMed] [Google Scholar]
- 5. Wu C. H., Fallini C., Ticozzi N., Keagle P. J., Sapp P. C., Piotrowska K., Lowe P., Koppers M., McKenna-Yasek D., Baron D. M., Kost J. E., Gonzalez-Perez P., Fox A. D., Adams J., Taroni F., et al. (2012) Mutations in the profilin 1 gene cause familial amyotrophic lateral sclerosis. Nature 488, 499–503 10.1038/nature11280 [DOI] [PMC free article] [PubMed] [Google Scholar]
- 6. Chen Y., Zheng Z. Z., Huang R., Chen K., Song W., Zhao B., Chen X., Yang Y., Yuan L., and Shang H. F. (2013) PFN1 mutations are rare in Han Chinese populations with amyotrophic lateral sclerosis. Neurobiol. Aging 34, 1922.e1–5 [DOI] [PubMed] [Google Scholar]
- 7. Ingre C., Landers J. E., Rizik N., Volk A. E., Akimoto C., Birve A., Hubers A., Keagle P. J., Piotrowska K., Press R., Andersen P. M., Ludolph A. C., and Weishaupt J. H. (2013) A novel phosphorylation site mutation in profilin 1 revealed in a large screen of US, Nordic, and German amyotrophic lateral sclerosis/frontotemporal dementia cohorts. Neurobiol. Aging 34, 1708.e1–6 [DOI] [PMC free article] [PubMed] [Google Scholar]
- 8. Smith B. N., Vance C., Scotter E. L., Troakes C., Wong C. H., Topp S., Maekawa S., King A., Mitchell J. C., Lund K., Al-Chalabi A., Ticozzi N., Silani V., Sapp P., Brown R. H. Jr., et al. (2015) Novel mutations support a role for Profilin 1 in the pathogenesis of ALS. Neurobiol. Aging 36, 1602.e17–27 [DOI] [PMC free article] [PubMed] [Google Scholar]
- 9. Alkam D., Feldman E. Z., Singh A., and Kiaei M. (2017) Profilin1 biology and its mutation, actin(g) in disease. Cell Mol. Life Sci. 74, 967–981 10.1007/s00018-016-2372-1 [DOI] [PMC free article] [PubMed] [Google Scholar]
- 10. Kullmann J. A., Neumeyer A., Wickertsheim I., Böttcher R. T., Costell M., Deitmer J. W., Witke W., Friauf E., and Rust M. B. (2012) Purkinje cell loss and motor coordination defects in profilin1 mutant mice. Neuroscience 223, 355–364 10.1016/j.neuroscience.2012.07.055 [DOI] [PubMed] [Google Scholar]
- 11. Yang C., Danielson E. W., Qiao T., Metterville J., Brown R. H. Jr, Landers J. E., and Xu Z. (2016) Mutant PFN1 causes ALS phenotypes and progressive motor neuron degeneration in mice by a gain of toxicity. Proc. Natl. Acad. Sci. U.S.A. 113, E6209–E6218 10.1073/pnas.1605964113 [DOI] [PMC free article] [PubMed] [Google Scholar]
- 12. Brettle M., Suchowerska A. K., Chua S. W., Ittner L. M., and Fath T. (2015) Amyotrophic lateral sclerosis-associated mutant profilin 1 increases dendritic arborisation and spine formation in primary hippocampal neurons. Neurosci. Lett. 609, 223–228 10.1016/j.neulet.2015.09.034 [DOI] [PubMed] [Google Scholar]
- 13. Boopathy S., Silvas T. V., Tischbein M., Jansen S., Shandilya S. M., Zitzewitz J. A., Landers J. E., Goode B. L., Schiffer C. A., and Bosco D. A. (2015) Structural basis for mutation-induced destabilization of profilin 1 in ALS. Proc. Natl. Acad. Sci. U.S.A. 112, 7984–7989 10.1073/pnas.1424108112 [DOI] [PMC free article] [PubMed] [Google Scholar]
- 14. Freischmidt A., Schöpflin M., Feiler M. S., Fleck A. K., Ludolph A. C., and Weishaupt J. H. (2015) Profilin 1 with the amyotrophic lateral sclerosis associated mutation T109M displays unaltered actin binding and does not affect the actin cytoskeleton. BMC Neurosci. 16, 77 10.1186/s12868-015-0214-y [DOI] [PMC free article] [PubMed] [Google Scholar]
- 15. Del Poggetto E., Bemporad F., Tatini F., and Chiti F. (2015) Mutations of profilin-1 associated with amyotrophic lateral sclerosis promote aggregation due to structural changes of its native state. ACS Chem. Biol. 10, 2553–2563 10.1021/acschembio.5b00598 [DOI] [PubMed] [Google Scholar]
- 16. Del Poggetto E., Gori L., and Chiti F. (2016) Biophysical analysis of three novel profilin-1 variants associated with amyotrophic lateral sclerosis indicates a correlation between their aggregation propensity and the structural features of their globular state. Biol. Chem. 397, 927–937 [DOI] [PubMed] [Google Scholar]
- 17. Matsukawa K., Hashimoto T., Matsumoto T., Ihara R., Chihara T., Miura M., Wakabayashi T., and Iwatsubo T. (2016) Familial amyotrophic lateral sclerosis-linked mutations in profilin 1 exacerbate TDP-43-induced degeneration in the retina of Drosophila melanogaster through an increase in the cytoplasmic localization of TDP-43. J. Biol. Chem. 291, 23464–23476 10.1074/jbc.M116.729152 [DOI] [PMC free article] [PubMed] [Google Scholar]
- 18. Tanaka Y., and Hasegawa M. (2016) Profilin 1 mutants form aggregates that induce accumulation of prion-like TDP-43. Prion 10, 283–289 10.1080/19336896.2016.1207033 [DOI] [PMC free article] [PubMed] [Google Scholar]
- 19. Del Poggetto E., Chiti F., and Bemporad F. (2015) The folding process of human profilin-1, a novel protein associated with familial amyotrophic lateral sclerosis. Sci. Rep. 5, 12332 10.1038/srep12332 [DOI] [PMC free article] [PubMed] [Google Scholar]
- 20. Goldberg R. N., Kishore N., and Lennen R. M. (2002) Thermodynamic quantities for the ionization reactions of buffers. J. Phys. Chem. Ref. Data 31, 231–370 10.1063/1.1416902 [DOI] [Google Scholar]
- 21. Gianni S., Ivarsson Y., Jemth P., Brunori M., and Travaglini-Allocatelli C. (2007) Identification and characterization of protein folding intermediates. Biophys. Chem. 128, 105–113 10.1016/j.bpc.2007.04.008 [DOI] [PubMed] [Google Scholar]
- 22. Lambrechts A., Jonckheere V., Dewitte D., Vandekerckhove J., and Ampe C. (2002) Mutational analysis of human profilin I reveals a second PI(4,5)-P2 binding site neighbouring the poly(l-proline) binding site. BMC Biochem. 3, 12 10.1186/1471-2091-3-12 [DOI] [PMC free article] [PubMed] [Google Scholar]
- 23. Myers J. K., Pace C. N., and Scholtz J. M. (1995) Denaturant m values and heat capacity changes: relation to changes in accessible surface areas of protein unfolding. Protein Sci. 4, 2138–2148 10.1002/pro.5560041020 [DOI] [PMC free article] [PubMed] [Google Scholar]
- 24. Geierhaas C. D., Salvatella X., Clarke J., and Vendruscolo M. (2008) Characterisation of transition state structures for protein folding using “high”, “medium” and “low” Φ-values. Protein Eng. Des. Sel. 21, 215–222 10.1093/protein/gzm092 [DOI] [PMC free article] [PubMed] [Google Scholar]
- 25. Tanford C. (1970) Protein denaturation. C. Theoretical models for the mechanism of denaturation. Adv. Protein Chem. 24, 1–95 10.1016/S0065-3233(08)60241-7 [DOI] [PubMed] [Google Scholar]
- 26. Chi C. N., Gianni S., Calosci N., Travaglini-Allocatelli C., Engström K., and Jemth P. (2007) A conserved folding mechanism for PDZ domains. FEBS Lett. 581, 1109–1113 10.1016/j.febslet.2007.02.011 [DOI] [PubMed] [Google Scholar]
- 27. Biancalana M., and Koide S. (2010) Molecular mechanism of Thioflavin-T binding to amyloid fibrils. Biochim. Biophys. Acta 1804, 1405–1412 10.1016/j.bbapap.2010.04.001 [DOI] [PMC free article] [PubMed] [Google Scholar]
- 28. Johnson S. M., Connelly S., Fearns C., Powers E. T., and Kelly J. W. (2012) The transthyretin amyloidoses: from delineating the molecular mechanism of aggregation linked to pathology to a regulatory-agency-approved drug. J. Mol. Biol. 421, 185–203 10.1016/j.jmb.2011.12.060 [DOI] [PMC free article] [PubMed] [Google Scholar]
- 29. Ferreiro D. U., Komives E. A., and Wolynes P. G. (2018) Frustration, function and folding. Curr. Opin. Struct. Biol. 48, 68–73 [DOI] [PMC free article] [PubMed] [Google Scholar]
- 30. Gianni S., Camilloni C., Giri R., Toto A., Bonetti D., Morrone A., Sormanni P., Brunori M., and Vendruscolo M. (2014) Understanding the frustration arising from the competition between function, misfolding, and aggregation in a globular protein. Proc. Natl. Acad. Sci. U.S.A. 111, 14141–14146 10.1073/pnas.1405233111 [DOI] [PMC free article] [PubMed] [Google Scholar]
- 31. Parra R. G., Schafer N. P., Radusky L. G., Tsai M. Y., Guzovsky A. B., Wolynes P. G., and Ferreiro D. U. (2016) Protein Frustratometer 2: a tool to localize energetic frustration in protein molecules, now with electrostatics. Nucleic Acids Res. 44, W356–W360 10.1093/nar/gkw304 [DOI] [PMC free article] [PubMed] [Google Scholar]
- 32. Tartaglia G. G., and Vendruscolo M. (2008) The Zyggregator method for predicting protein aggregation propensities. Chem. Soc. Rev. 37, 1395–1401 10.1039/b706784b [DOI] [PubMed] [Google Scholar]
- 33. Rennella E., Sekhar A., and Kay L. E. (2017) Self-assembly of human profilin-1 detected by Carr-Purcell-Meiboom-Gill nuclear magnetic resonance (CPMG NMR) spectroscopy. Biochemistry 56, 692–703 10.1021/acs.biochem.6b01263 [DOI] [PubMed] [Google Scholar]
- 34. Neudecker P., Robustelli P., Cavalli A., Walsh P., Lundström P., Zarrine-Afsar A., Sharpe S., Vendruscolo M., and Kay L. E. (2012) Structure of an intermediate state in protein folding and aggregation. Science 336, 362–366 10.1126/science.1214203 [DOI] [PubMed] [Google Scholar]
- 35. Krobath H., Estácio S. G., Faísca P. F., and Shakhnovich E. I. (2012) Identification of a conserved aggregation-prone intermediate state in the folding pathways of Spc-SH3 amyloidogenic variants. J. Mol. Biol. 422, 705–722 10.1016/j.jmb.2012.06.020 [DOI] [PubMed] [Google Scholar]
- 36. Stoppini M., and Bellotti V. (2015) Systemic amyloidosis: lessons from β2-microglobulin. J. Biol. Chem. 290, 9951–9958 10.1074/jbc.R115.639799 [DOI] [PMC free article] [PubMed] [Google Scholar]
- 37. Chiti F., De Lorenzi E., Grossi S., Mangione P., Giorgetti S., Caccialanza G., Dobson C. M., Merlini G., Ramponi G., and Bellotti V. (2001) A partially structured species of β2-microglobulin is significantly populated under physiological conditions and involved in fibrillogenesis. J. Biol. Chem. 276, 46714–46721 10.1074/jbc.M107040200 [DOI] [PubMed] [Google Scholar]
- 38. Karamanos T. K., Pashley C. L., Kalverda A. P., Thompson G. S., Mayzel M., Orekhov V. Y., and Radford S. E. (2016) A population shift between sparsely populated folding intermediates determines amyloidogenicity. J. Am. Chem. Soc. 138, 6271–6280 10.1021/jacs.6b02464 [DOI] [PMC free article] [PubMed] [Google Scholar]
- 39. Honda R. P., Xu M., Yamaguchi K. I., Roder H., and Kuwata K. (2015) A native-like intermediate serves as a branching point between the folding and aggregation pathways of the mouse prion protein. Structure 23, 1735–1742 10.1016/j.str.2015.07.001 [DOI] [PMC free article] [PubMed] [Google Scholar]
- 40. Sen Mojumdar S., N Scholl Z., Dee D. R., Rouleau L., Anand U., Garen C., and Woodside M. T. (2017) Partially native intermediates mediate misfolding of SOD1 in single-molecule folding trajectories. Nat. Commun. 8, 1881 10.1038/s41467-017-01996-1 [DOI] [PMC free article] [PubMed] [Google Scholar]
- 41. Heidarsson P. O., Naqvi M. M., Otazo M. R., Mossa A., Kragelund B. B., and Cecconi C. (2014) Direct single-molecule observation of calcium-dependent misfolding in human neuronal calcium sensor-1. Proc. Natl. Acad. Sci. U.S.A. 111, 13069–13074 10.1073/pnas.1401065111 [DOI] [PMC free article] [PubMed] [Google Scholar]
- 42. Santoro M. M., and Bolen D. W. (1988) Unfolding free energy changes determined by the linear extrapolation method. 1. Unfolding of phenylmethanesulfonyl α-chymotrypsin using different denaturants. Biochemistry 27, 8063–8068 10.1021/bi00421a014 [DOI] [PubMed] [Google Scholar]
- 43. Jemth P., Gianni S., Day R., Li B., Johnson C. M., Daggett V., and Fersht A. R. (2004) Demonstration of a low-energy on-pathway intermediate in a fast-folding protein by kinetics, protein engineering, and simulation. Proc. Natl. Acad. Sci. U.S.A. 101, 6450–6455 10.1073/pnas.0401732101 [DOI] [PMC free article] [PubMed] [Google Scholar]
- 44. Ternström T., Mayor U., Akke M., and Oliveberg M. (1999) From snapshot to movie: φ analysis of protein folding transition states taken one step further. Proc. Natl. Acad. Sci. U.S.A. 96, 14854–14859 10.1073/pnas.96.26.14854 [DOI] [PMC free article] [PubMed] [Google Scholar]
- 45. Parker M. J., Spencer J., and Clarke A. R. (1995) An integrated kinetic analysis of intermediates and transition states in protein folding reactions. J. Mol. Biol. 253, 771–786 10.1006/jmbi.1995.0590 [DOI] [PubMed] [Google Scholar]
Associated Data
This section collects any data citations, data availability statements, or supplementary materials included in this article.