

Abstract
Background:
Very limited information is available regarding the accuracy and applicability of various ultrasonography parameters [abdominal circumference (AC), biparietal diameter (BPD), femur length (FL), and head circumference (HC)]-based fetal weight estimation models for Indian population. The objective of this study was to systematically evaluate commonly used fetal weight estimation models to determine their appropriateness for an Indian population.
Methods:
Retrospective data of 300 pregnant women was collected from a tertiary care center in Bengaluru, India. The inclusion criteria were a live singleton pregnancy, gestational age ≥ 34 weeks, and last ultrasound scan to delivery duration ≤ 7 days. Cases with suspected fetal growth restriction or malformation were excluded. For each case, fetal weight was estimated using 34 different models. The models specifically designed for low birth weight, small for gestation age, or macrosomic babies were excluded. The models were ranked based on their mean percentage error (MPE) and its standard deviation (random error). A model with the least MPE and random error ranking was considered as the best model.
Results:
In total, 149 cases were found suitable for the study. Out of 34, only 12 models had MPE within ± 10% and only seven models had random error < 10%. Most of the Western population-based models had a tendency to overestimate the fetal weight. Based on MPE and random error ranking, the Woo’s (AC-BPD) model was found to be the best, followed by Jordaan (AC), Combs (AC-HC-FL), Hadlock (AC-HC), and Hadlock-3 (AC-HC-FL) models. It was observed that the models based on just AC and AC-BPD combinations had statistically significant lesser MPE than the models based on all other combinations (p < 0.05).
Conclusion:
It was observed that the existing models have higher errors on Indian population than on their native populations. This points toward limitations in direct application of these models on Indian population without due consideration. Therefore, it is recommended that clinicians should exert caution in interpretation of fetal weight estimations based on these models. Moreover, this study highlights a need of models based on native Indian population.
KEYWORDS: biological models, fetal ultrasonography, fetal weight, India
Introduction
Intrauterine well-being and survival of a fetus is very closely linked with intrauterine weight gain as fetuses outside the normal weight range are shown to be at an increased risk of perinatal morbidity, mortality, and poor growth and development in the long term [1,2]. This makes it very important to have an accurate estimation of fetal weight. In the last few decades, researchers across the globe have published a number of models based on ultrasonography parameters for fetal weight estimation, albeit with a varying degree of success. Most of these models are based on the Western population, with recent additions of Asian population-based models [3,4,5]. Although it is possible to use a model developed on one population for another population [6], differences in nutritional, socioeconomic, and genetic factors of populations are likely to impact the accuracy of the model [7,8]. Therefore, so far, no model has shown to be consistently superior across different populations [9].
Inaccurate estimation of fetal weight may result in unnecessary or delayed interventions, resulting in morbidity for patients and making clinicians more susceptible for medicolegal issues. Therefore, it is very important to systematically validate existing models prior to their application on any new population. Unfortunately, for the Indian population, very limited information is available in this regard, which puts clinicians and patients at a disadvantage. This study is an attempt to provide systematic information to clinicians regarding ultrasonography-based fetal weight estimation, which they can use in their practice.
The aim of this study was to systematically evaluate commonly used ultrasonography-based fetal weight estimation models to determine their accuracy and appropriateness for an Indian population.
Material and methods
Study population
We used retrospectively collected records of 300 pregnant women who were delivered in a tertiary care hospital in Bengaluru (Bangalore), India, during 2013 for this study. The deidentified data was stored in Microsoft Office Excel 2010 (version 14.0.7166.5000, Microsoft Corporation, USA, 2010) software and was scrutinized for inclusion and exclusion criteria. The inclusion criteria for the study were a live birth singleton pregnancy, gestational age ≥ 34 weeks, and cases with the last ultrasound scan to delivery duration ≤ 7 days. All the cases with suspected fetal malformation, fetal growth restriction, large for gestational age fetuses or cases with pre gestational or gestational diabetes were excluded as these conditions are known to influence the fetal weight, possibly introducing a bias in the accuracy of a model.
For inclusion, gestational age was determined using the date of the last menstrual period; in case of ambiguity, gestational age by ultrasound examination was considered. All the ultrasound scans were performed by sonologists using standard protocols. Based on ultrasonography parameters, the fetal weight was estimated using the Hadlock-4 model. The fetuses with estimated weight less than the 10th percentile for gestational age were classified as having growth restriction, whereas the fetuses with estimated weight more than the 90th percentile were classified as large for gestational age. Weights of all newborn babies were measured immediately after birth. In total, 149 cases were found suitable for the study.
The study was approved by an ethical committee in writing. The study was conducted in accordance with local regulations and, where applicable, the Declaration of Helsinki.
Selection of fetal weight estimation models
To determine the existing ultrasonography-based fetal weight estimation models, online databases of MEDLINE and Google Scholar were searched; reference lists from the selected papers were also used to find further relevant studies. The selection was restricted to models based on combinations of four routinely used biometry parameters, such as abdominal circumference (AC), biparietal diameter (BPD), head circumference (HC), and femur length (FL). The models, which are specifically designed for low birth weight, small for gestation age, or macrosomic babies were excluded. In total, 34 models were found to be suitable for the study (Table 1). All these models were implemented in MATLAB (MATLAB 8.4, The MathWorks Inc., Natick, MA, 2015) and fetal weights were estimated based on ultrasonography parameters from the last week of pregnancy.
Table 1.
Details of the selected ultrasonography-based fetal weight estimation models.
| No. | Model (ultrasonography parameters) | Country of origin | Formula |
|---|---|---|---|
| 1 | Campbell (AC) [10] | UK | Ln EFW = −4.564 + 0.282 (AC) − 0.00331 (AC)2 |
| 2 | Hadlock (AC)[11] | USA | Ln EFW = 2.695 + 0.253(AC) − 0.00275(AC)2 |
| 3 | Higginbottom (AC) [12] | UK | EFW = 0.0816(AC)3 |
| 4 | Jordaan (AC) [13] | S. Africa | Log10 EFW = 0.6328 + 0.1881(AC) − 0.0043(AC)2 + 0.000036239(AC)3 |
| 5 | Warsof (AC)[14] | USA | Log10 EFW = −1.8367 + 0.092(AC) − 0.000019(AC)3 |
| 6 | Waseem-1 (AC) [5] | Pakistan | Log10 EFW = 0.708 + 0.136 (AC) − 0.002 (AC) 2 |
| 7 | Warsof (FL) [14] | USA | Ln EFW = 4.6914 + 0.151(FL)2 − 0.0119(FL)3 |
| 8 | Hadlock (AC-HC)[11] | USA | Log10 EFW = 1.182 + 0.0273(HC) + 0.07057(AC) − 0.00063(AC)2 − 0.0002184(HC)(AC) |
| 9 | Jordaan ( AC-HC) [13] | S. Africa | Log10 EFW = 0.9119 + 0.0488(HC) + 0.0824(AC) − 0.001599(HC)(AC) |
| 10 | Ferrero (AC-FL) [15] | Italy | Log10 EFW = 0.77125 + 0.13244(AC) − 0.12996(FL) − 1.73588(AC × AC)/1000 + 3.09212 (FL × AC)/1000 + 2.18984(FL/AC) |
| 11 | Hadlock-1 (AC-FL) [16] | USA | Log10 EFW = 1.304 + 0.05281(AC) + 0.1938(FL) −0.004(AC)(FL) |
| 12 | Warsof (AC-FL) [17] | USA | Ln EFW = 2.792 + 0.108(FL) + 0.0036(AC)2 − 0.0027(FL)(AC) |
| 13 | Waseem-3 (AC-FL) [5] | Pakistan | Log10 EFW = −3.548 + 0.204(AC) + 0.935(FL) −0.027(AC)(FL) |
| 14 | Woo (AC-FL) [3] | Hong Kong | Log10 EFW = 0.59 + 0.08(AC) + 0.28(FL) − 0.00716(AC)(FL) |
| 15 | Hadlock (AC-BPD) [11] | USA | Log10 EFW = 1.1134 + 0.05845(AC) − 0.000604(AC)2− 0.007365(BPD)2 + 0.000595(BPD)(AC) + 0.1694(BPD) |
| 16 | Hsieh (AC-BPD) [18] | Republic of China | Log10 EFW = 2.1315 + 0.0056541(AC)(BPD)− 0.00015515(BPD)(AC)2 + 0.000019782(AC)3 + 0.052594(BPD) |
| 17 | Jordaan (AC-BPD) [13] | S. Africa | Log10 EFW = −1.1683 + 0.0377(AC) + 0.0950(BPD) − 0.0015(BPD)(AC) |
| 18 | Merz (AC-BPD) [19] | Germany | EFW = −3200.40479 + 157.07186(AC) + 15.90391(BPD)2 |
| 19 | Shepard (AC-BPD) [20] | USA | Log10 EFW = −1.7492 + 0.166(BPD) + 0.046(AC) − 0.002546(AC)(BPD) |
| 20 | Vintzileos (AC-BPD) [21] | USA | Log10 EFW = 1.879 + 0.084(BPD) + 0.026(AC) |
| 21 | Warsof (AC-BPD) [14] | USA | Log10 EFW = −1.599 + 0.144(BPD) + 0.032(AC) −0.000111(BPD)2(AC) |
| 22 | Waseem-2 (AC-BPD) [5] | Pakistan | Log10 EFW = 0.949 + 0.099(AC) − 0.001(AC) 2 + 0.056(BPD) |
| 23 | Woo (AC-BPD) [3] | Hong Kong | Log10 EFW = 1.63 + 0.16(BPD) + 0.00111(AC)2 − 0.0000859(BPD)(AC)2 |
| 24 | Hadlock-2 (AC-BPD-FL) [16] | USA | Log10 EFW = 1.335 − 0.0034(AC)(FL) + 0.0316(BPD) + 0.0457(AC) + 0.1623(FL) |
| 25 | Hsieh (AC-BPD-FL) [18] | Republic of China | Log10 EFW = 2.7193 + 0.0094962(AC)(BPD) − 0.1432(FL) − 0.00076742(AC)(BPD)2 + 0.001745(FL)(BPD)2 |
| 26 | Shinozuka (AC-BPD-FL) [22] | Japan | EFW = 0.23966(AC)2(FL) + 1.6230 (BPD)3 |
| 27 | Waseem-4 (AC-BPD-FL) [5] | Pakistan | Log10 EFW = −2.213 + 0.147(AC ) + 0.088(BPD) + 0.652(FL)−0.020(AC)(FL) |
| 28 | Woo (AC-BPD-FL) [3] | Hong Kong | Log10 EFW = 1.54 + 0.15(BPD) + 0.00111(AC)2 − 0.0000764(BPD)(AC) 2 + 0.05(FL) −0.000992(FL)(AC) |
| 29 | Jordaan (AC-BPD-HC) [13] | S.Africa | Log10 EFW = 2.3231 + 0.02904(AC) + 0.0079(HC) −0.0058(BPD) |
| 30 | Combs (AC-HC-FL) [23] | USA | EFW = 0.23718(AC)2(FL) + 0.03312(HC)3 |
| 31 | Hadlock-3 (AC-HC-FL) [16] | USA | Log10 EFW = 1.326 − 0.00326(AC)(FL) + 0.0107(HC) + 0.0438(AC) + 0.158(FL) |
| 32 | Munim (AC-HC-FL) [4] | USA | Log(EFW) = 6.9044186 + 0.0000022(HC)2 − 0.0150359(AC) +0.0000291(AC) 2 + 0.0667425(FL) −0.0004164(FL)2 |
| 33 | Ott (AC-HC-FL) [24] | Pakistan | Log(EFW) = 0.04355(HC) + 0.05394(AC) − 0.0008582(HC) ×AC + 1.2594 (FL/AC) − 2.0661 |
| 34 | Hadlock-4 (AC-HC-BPD-FL) [16] | USA | Log10 EFW = 1.3596 + 0.0064(HC) + 0.0424(AC) + 0.174(FL) + 0.00061(BPD)(AC) − 0.00386(AC)(FL) |
AC = abdominal circumference; BPD = biparietal diameter;EFW = estimated fetal weights; FL = femur length; HC = head circumference; S. Africa = South Africa; UK = United Kingdom; USA = United States of America
Statistical analysis methodology
The estimated fetal weights (EFW) by different models were compared with actual birth weights (ABW) by means of: (1) mean of differences between EFW and ABW (EFW — ABW) for all individual cases; (2) standard deviation of differences; (3) mean of percentage errors (MPE), for an individual case, percentage error (PE) was calculated using the following equation:

based on individual percentage errors, MPE was calculated; (4) standard deviation of percentage errors (SD-PE); (5) analysis for proportions of EFW, which are within ±5%, ±10%, and ±15% of ABW; and (6) Pearson correlation coefficient between EFW and ABW.
The models were compared with each other using the one-way analysis of variance test; a p value < 0.05 was considered as a statistically significant difference. All statistical analyses were performed in MATLAB and Microsoft Office Excel 2010.
Selection of the best model
Most of the researchers have used MPE and SD-PE as primary measures to compare the accuracy of different models. MPE denotes a magnitude of systemic error between fetal weight estimates by an individual model and ABW. A positive value of MPE denotes degree of overestimation, whereas a negative value denotes degree of underestimation in fetal weight estimation. The SD-PE is an indicator of random error in a measurement.
For selection of the best model, we used the methodology proposed by Melamed et al [25] with a few modifications. The models were first ranked in an ascending order on the basis of their MPE and SD-PE independently, with rank 1 indicating the lowest error. For a model, the total score was calculated by adding its MPE and SD-PE ranks. Finally, the models were ranked based on their total scores; a model with the least score was ranked as the best model.
Results
A total of 149 cases were found suitable for the final analysis. The important characteristics of the study population are summarized in Table 2. Out of all selected cases, 21 cases had hypertensive disorder and 12 cases had thyroid disorders. About 60% cases had an ultrasound scan done within 3 days before delivery. Based on a literature review, 34 commonly used fetal weight estimation models were identified. Among these models, 19 models were based on the Western populations (UK, USA, and Europe), three on African populations, and the remaining 12 on Asian populations. Out of 34 models, seven models were based on just one biometry parameter; 16 models were based on combinations of two parameters; 10 models were based on combinations of three parameters, and one model was based on all four parameters.
Table 2.
Demographic characteristics of the study population.
| Parameter | Mean (± SD) |
|---|---|
| Maternal age (y) | 23.64 (± 3.36) |
| Mean gestational age (wk) | 38.36 (± 1.49) |
| Biparietal diameter (cm) | 8.98 (± 0.38) |
| Abdominal circumference (cm) | 32.84 (± 1.48) |
| Head circumference (cm) | 32.32 (± 1.01) |
| Femur length (cm) | 7.15 (± 0.27) |
| Mean actual birth weight (g) | 2763.63 (± 380.40) |
| Mean duration between ultrasound scan and delivery (d) | 2.87 |
SD = standard deviation.
Accuracy parameters of the models
For the models (model-1, 5, 17, 19, 21, and 33) those provide EFW in kg, it was converted in gram for comparison. We observed a very wide variation in mean difference among various models (–1799.8 g to 1478.5 g) with most of the models having a tendency to overestimate the weight. Only six models had a mean difference within ±200 g, with three models having it within ±100 g. The worst difference (more than ±1000 g) was observed with the Warsof (AC-FL), Waseem (AC), Munim (AC-HC-FL), and Waseem-2 (AC-BPD) models.
Systemic errors as measured by MPE also showed a wide variation (–65.5% to 54.1%), with only 12 models having MPE within ±10%. The least systemic error was observed with the model of Woo (AC-BPD), followed by Jordaan (AC); both of them had systemic error within ±5%. The lowest random error was observed with the model of Waseem-1 (AC), but it had a very high MPE. Random error showed lesser variation than systemic error, evident by the fact that 30 models had random error in a narrow range of 9% to 12%.
Most of the models had a correlation coefficient in a range of 0.650—0.725, with the highest correlation coefficient of 0.7296 with Hadlock-4 (AC-HC-BPD-FL) model.
Selection of the best model
Total score and ranks of all the models are summarized in Table 3. As per ranking method, the Woo’s (AC-BPD) model had the least score; thus, it was judged as the best model followed by the model of Jordan (AC).
Table 3.
Accuracy parameters of the selected models.
| No. | Model | Total score | Rank | Mean difference, g(±SD) | Mean percentage error, % (±SD) | Correlation coefficient |
|---|---|---|---|---|---|---|
| 1 | Campbell (AC) | 38 | 22 | 317.14 (265.81) | 12.46 (10.48) | 0.7120 |
| 2 | Hadlock (AC) | 41 | 23 | 333.17 (269.81) | 12.92 (10.56) | 0.7152 |
| 3 | Higginbottom (AC) | 23 | 8 | 145.59 (285.27) | 5.80 (10.52) | 0.7190 |
| 4 | Jordaan (AC) | 10 | 2 | 93.72 (267.16) | 4.48 (9.86) | 0.7145 |
| 5 | Warsof (AC) | 53 | 29 | 474.51 (273.77) | 18.10 (11.12) | 0.7105 |
| 6 | Waseem-1 (AC) | 34 | 17 | −1733.0 (363.30) | −62.09 (4.62) | 0.5440 |
| 7 | Warsof (FL) | 49 | 26 | 303.13 (294.15) | 12.18 (11.79) | 0.6291 |
| 8 | Hadlock (AC-HC) | 17 | 4 | 202.09 ( 270.77 ) | 8.06 (10.11) | 0.7159 |
| 9 | Jordaan (AC-HC) | 48 | 25 | 387.57 (266.21) | 15.01 (10.68) | 0.7145 |
| 10 | Ferrero (AC-FL) | 56 | 31 | 566.46 (273.04) | 21.4 (11.18) | 0.7250 |
| 11 | Hadlock-1 (AC-FL) | 34 | 18 | 302.39 (270.03) | 11.71 (10.37) | 0.7254 |
| 12 | Warsof (AC-FL) | 37 | 21 | −1799.86 (265.53) | −65.55 (8.08) | 0.7145 |
| 13 | Waseem-3 (AC-FL) | 52 | 27 | 324.32 (291.70) | 13.04 (11.63) | 0.6336 |
| 14 | Woo (AC-FL) | 63 | 33 | 697.20 (295.0) | 26.02 (11.91) | 0.7242 |
| 15 | Hadlock (AC-BPD) | 42 | 24 | 295.54 (290.58) | 11.50 (11.03) | 0.6851 |
| 16 | Hsieh (AC-BPD) | 30 | 16 | 208.1 (238.58) | 8.25 (10.58) | 0.6999 |
| 17 | Jordaan (AC-BPD) | 29 | 12 | 277.89 (269.78) | 10.91 (10.37 | 0.7131 |
| 18 | Merz (AC-BPD) | 52 | 28 | 482.06 (266.48) | 18.50 (11.02) | 0.7128 |
| 19 | Shepard (AC-BPD) | 58 | 32 | 435.02 (311.86) | 16.45 (11.91) | 0.6867 |
| 20 | Vintzileos (AC-BPD) | 53 | 30 | 342.05 (319.95) | 12.96 (11.90) | 0.6891 |
| 21 | Warsof (AC-BPD) | 24 | 10 | 82.04 (293.46) | 3.63 (10.59) | 0.6812 |
| 22 | Waseem-2 (AC-BPD) | 65 | 34 | 1478.54 (424.75) | 54.15 (16.17) | 0.7127 |
| 23 | Woo (AC-BPD) | 5 | 1 | −43.03 (272.63) | −0.85 (9.58) | 0.7006 |
| 24 | Hadlock-2 (AC-BPD-FL) | 29 | 13 | 283.74 (269.42) | 11.02 (10.31) | 0.7267 |
| 25 | Hsieh (AC-BPD-FL) | 36 | 20 | 206.53 (317.91) | 8.15 (11.60) | 0.6572 |
| 26 | Shinozuka (AC-BPD-FL) | 29 | 14 | 278.35 (269.48) | 10.93 (10.36) | 0.7138 |
| 27 | Waseem-4 (AC-BPD-FL) | 29 | 15 | −438.17 (325.81) | −14.84 (9.72) | 0.5028 |
| 28 | Woo (AC-BPD-FL) | 22 | 7 | 199.13 (279.96) | 7.93 (10.45) | 0.7046 |
| 29 | Jordaan (AC-BPD-HC) | 25 | 11 | 276.07 (267.73) | 10.81 (10.22) | 0.7203 |
| 30 | Combs (AC-HC-FL) | 12 | 3 | 196.75 (261.16) | 7.96 (9.80) | 0.7262 |
| 31 | Hadlock-3 (AC-HC-FL) | 19 | 5 | 232.83 (267.50) | 9.15 (10.06) | 0.7279 |
| 32 | Munim (AC-HC-FL) | 34 | 19 | −1727.79 (378.30) | −61.81 (5.39) | −0.1086 |
| 33 | Ott (AC-HC-FL) | 19 | 6 | 244.15 (264.50) | 9.63 (10.01) | 0.7260 |
| 34 | Hadlock-4 (AC-HC-BPD-FL) | 23 | 9 | 247.50 (266.64) | 9.69 (10.11) | 0.7296 |
AC = abdominal circumference; BPD = biparietal diameter; FL = femur length; HC = head circumference.
Most of the models with low systemic errors also had low random errors; however, there were a few models, which had low systemic error but marginally high random error. Due to the overall small variations in random error, such models had high total score even though the difference in their random error was very small compared with other models; this resulted in these models being placed at higher ranks. Therefore, rather than totally relying on the ranking method, we selected those models where systemic error was within ±10% for further detailed analysis. We selected 10% as the threshold because any model with more than ±10% variations in EFW is likely to be of limited use in clinical practice. In total, 12 models fulfilled this criterion (models with the rank 1 to 10, rank 16, and rank 20). The comparative analysis of these 12 models on the basis of their MPE is illustrated in Figure 1. It was observed that the MPE of these models had an asymmetric distribution around their mean values.
Figure 1.

Box plot showing the mean percentage error of the selected 12 models along with outliers (observations beyond ± 2 random error) indicated by small circles. The y-axis indicates the rank of a particular model.
Regarding analysis for proportions of EFW, which are within a certain limit of ABW, we observed that out of the 12, only four models had EFW within ±10% of ABW for more than 60% cases (Table 4).
Table 4.
Percentage of EFW within a certain range of ABW for various models.
| Rank | Model | % EFW within ± 5% of ABW | % EFW within ± 10% of ABW | % EFW within ± 15% of ABW |
|---|---|---|---|---|
| 1 | Woo (AC-BPD) | 44.97 | 74.50 | 87.25 |
| 2 | Jordaan (AC) | 37.58 | 66.44 | 83.22 |
| 3 | Combs (AC-HC-FL) | 29.53 | 59.06 | 79.19 |
| 4 | Hadlock (AC-HC) | 32.21 | 58.39 | 77.18 |
| 5 | Hadlock -3 (AC-HC-FL) | 26.17 | 52.35 | 73.83 |
| 6 | Ott (AC-HC-FL) | 24.83 | 48.99 | 71.14 |
| 7 | Woo (AC-BPD-FL) | 27.52 | 55.70 | 77.18 |
| 8 | Higginbottom (AC) | 38.26 | 63.09 | 78.52 |
| 9 | Hadlock-4 (AC-HC BPD -FL) | 25.50 | 50.34 | 71.81 |
| 10 | Warsof (AC-BPD) | 39.60 | 66.44 | 82.55 |
| 16 | Hsieh (AC-BPD) | 25.50 | 53.62 | 74.45 |
| 20 | Hsieh (AC-BPD-FL) | 25.50 | 52.35 | 73.15 |
ABW = actual birth weight; AC = abdominal circumference; BPD = biparietal diameter; EFW = estimated fetal weight; FL = femur length; HC = head circumference.
Figure 2 shows the detailed proportional distribution of EFW of the selected 12 models. It was observed that the models had considerable variations in the distribution of proportion of cases with most of the models having a tendency to overestimate the fetal weight.
Figure 2.

Distribution of proportions of estimated fetal weight (EFW) within certain limits of actual birth weight (ABW) for a particular model. The values above “0%” horizontal line indicate proportions of cases with overestimation of fetal weight (positive error), whereas values below “0%” indicate cases with underestimation of fetal weight (negative error).
Model accuracy as per country of origin
Out of the selected 12 models, six models were based on the USA population, 2 models each on Hong Kong and Republic of China (Taiwan) population, and 1 model each on South Africa and the United Kingdom population. We observed that there were considerable variations in the accuracy of models from different counties as well as models from the same country. However, models based on similar populations showed more coherence with a tendency to cluster around each other (Figure 3). For the USA models, using one-way analysis of variance test, we observed that the Warsof’s (AC-BPD) model had statistically significant less MPE, whereas the remaining models were comparable with each other. Similarly, we observed that the Woo’s (AC-BPD) model had statistically significant less MPE compared with the other model based on the Hong Kong population. No such difference was observed between the two models based on a Taiwanese population.
Figure 3.

Systemic and random error for the 12 selected models (country of origin is indicated by an eclipse). Co = Combs (ACHC-FL); Ha = Hadlock (AC-HC); Ha-3 = Hadlock-3 (AC-HC-FL); Ha-4 = Hadlock-4 (AC-HC BPD-FL); Hi = Higginbottom (AC); Hs-1 = Hsieh (AC-BPD); Hs-2 = Hsieh (AC-BPD-FL); Jo = Jordaan (AC); Ot = Ott (AC-HC-FL); S. = South; W-1 = Woo (AC-BPD); W-2 = Woo (AC-BPD-FL); Wa = Warsof (AC-BPD).
Model accuracy based on combinations of ultrasonography parameters
In our study, among the 12 models, the models based on AC-BPD combinations had the least average systemic error, followed by the models based on just AC (Figure 4). When both AC based models were compared independently with all other combinations (except AC-BPD), we observed that these models had statistically significant less MPE. Similarly, except the Hsieh’s (AC-BPD) model, other two AC-BPD models had statistically significant less MPE compared with all other combinations of parameters.
Figure 4.
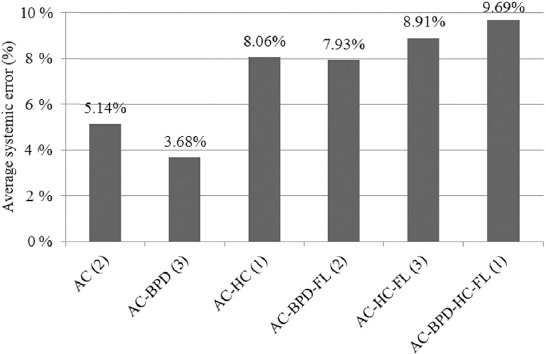
Average of systemic errors of the models based on different combinations of ultrasonography parameters (analysis for selected 12 models). The numbers in bracket indicate a total number of models based on a particular combination. AC = abdominal circumference; BPD = biparietal diameter; FL = femur length; HC = head circumference.
Discussion
The purpose of this study was to systematically evaluate the accuracy and appropriateness of existing ultrasonography-based fetal weight estimation models for an Indian population as very limited information is available in this regard. We could find only one study by Hebbar [26] where seven different ultrasonography models were evaluated on an Indian population. However, this study evaluated a limited number of models, and none of the Asian models were studied. The other limiting factor was the use of mean absolute difference rather than MPE for accuracy measurement, which makes it inappropriate to compare results of this study with other studies [9].
In the present study, the Woo’s (AC-BPD) model was found to be the most appropriate model for Indian population as it had the least total score. However, we observed wide variations in systemic errors of different models in our study population compared with earlier studies [9], with less than one-third of the models having MPE within ±10%. We also observed a weak correlation between EFW of different Western models and ABW. Most of the other studies form the South East Asian countries have also reported similar observations [4,5,27,28,29].
Although a random error <7% has been rarely reported in the literature [9], we observed overall high random error (mean = 10.41%) in our study. Random error denotes the contribution of local factors, such as variation in the measurement due to intraobserver and interobserver differences, training and experience of an operator, image quality, and instrument calibration, in the overall error of a model. These factors need a proper attention from clinicians and call for well-defined protocols, consistent equipment calibration, and adequate training of professionals involved. Better image processing tools and automated measurement of ultrasonography parameters could be other possible solutions. Many authors have proposed different methodologies to minimize these errors during examination, including taking multiple measurements of each parameters or by averaging the measurements taken by different sonologists [30,31]. However, practical difficulties in implementation of these methodologies are limiting factors in their widespread use.
We observed that the models developed on similar populations show a tendency to cluster around each other, indicating potential impact of population characteristics on the behavior of a model. Except the Warsof’s (AC-BPD) model, for all other models, the MPE on our study population was of higher magnitudes than the MPE of the same model on the Western population [9]. For commonly used Hadlock-4 (AC-HC BPD-FL) model, most of the Western studies have reported MPE within ±2.5% [9], whereas we reported MPE of 9.69% in our study. The Woo’s (AC-BPD) model, which is developed on Hong Kong population was found to be more appropriate for our study population than the other models; however, even there, the mean difference in our study (–43.03 g) was significantly higher than the mean difference (0.2 g) reported on the native population [32]. This could be due to the underlying difference in anthropometric and genetic characteristics of the study population, which are known to affect the accuracy of a model [7,8]. It reiterates a fact that a model developed on a particular population is most likely to work better for that population. This points toward limitations in direct application of these models on Indian population without due consideration; this also highlights a need of a model based on native Indian population.
There is no consensus in the literature regarding the best combination of ultrasonography parameters for fetal weight estimation. In the earlier studies, Campbell and Wilkin [10] and Higginbottom et al [12] have demonstrated good results with just the AC parameter, whereas many later studies have suggested that the combinations of two or more parameters work better [9,16]. In our study, we found that the models based on just AC and AC-BPD combinations were much superior to models based on all other combinations. This suggests that having multiple parameters does not necessarily result in a better accuracy of estimation. A study with a bigger dataset is needed to elucidate the importance of parameters; a bigger dataset could help in developing models using modern techniques like Lasso, which automatically reduces the contribution of the unimportant parameters [33].
To overcome the limitations of existing ultrasonography-based models, a few authors have developed new models by incorporating parameters like fetal mid-thigh soft tissue thickness or by combining ultrasonography parameters with maternal characteristics [34,35]. These approaches need further evaluation before their utility is firmly established. Considering limitations of conventional ultrasonography, researchers have also proposed different modalities like three-dimensional ultrasound scan and magnetic resonance imaging to estimate fetal weight based on various volumetric equations. The early studies have shown positive results with these modalities [9]; however, these modalities are currently not widely available in developing countries. In a view of these factors, routine ultrasonography parameter-based fetal weight estimation method, which is already a well-established method, is likely to continue as a preferred method for the foreseeable future. This makes it important to study and minimize all potential sources of biases from this method.
The limitations of our study are that the data was collected from a single center involving a small number of samples, which makes it difficult to generalize these results for the entire country due to prevailing geographical and ethnicity differences. Due to the retrospective study design, we could not study other fetal weight estimation models, which combine ultrasonography parameters with certain maternal characteristics. However, at the same time, the retrospective design provided us an opportunity to evaluate the performance of existing models on unse-lected population without any forced standardization.
To conclude, there are numerous factors known to influence the accuracy of fetal weight estimation models. This warrants extensive evaluations of such models before their widespread use. Unfortunately, very limited information is available from India concerning the accuracy and applicability of various existing models; this study is one of the early systematic attempts in this direction. We observed that the existing models have higher errors on the Indian population than on their native populations. This points toward limitations in the direct application of these models on Indian population without due consideration. We also observed that the models based on AC and AC-BPD combination were much better in accuracy than the models based on other combinations. Obstetricians also need to keep these factors in mind when taking important management decision based on estimated fetal weight. The findings of this study suggest that there is a need for further evaluation of existing ultrasonography-based fetal weight estimation models with well-designed prospective studies across the country. At a time where “personalized medicine” makes headlines, the study results further recommend the development of models based on native Indian populations for better accuracy of ultrasonography-based fetal weight estimation.
Acknowledgments
We duly acknowledge Sri Krishna Sevashrama Hospital, Bengaluru, and its staff for their help and support during the data collection phase of the study.
Footnotes
Conflicts of interest: Sujitkumar Hiwale, Hemant Misra, and Shrutin Ulman declare that they have no conflicts of interest.
References
- [1].Vik T, Markestad T, Ahlsten G, et al. Body proportions and early neonatal morbidity in small-for-gestational-age infants of successive births. Acta Obstet Gynecol Scand Suppl. 1997;165:76–81. [PubMed] [Google Scholar]
- [2].Spellacy WN, Miller S, Winegar A, et al. Macrosomiaematernal characteristics and infant complications. Obstet Gynecol. 1985;66:158–61. [PubMed] [Google Scholar]
- [3].Woo JS, Wan CW, Cho KM. Computer-assisted evaluation of ultrasonic fetal weight prediction using multiple regression equations with and without the fetal femur length. J Ultrasound Med. 1985;4:65–7. doi: 10.7863/jum.1985.4.2.65. [DOI] [PubMed] [Google Scholar]
- [4].Munim S, Figueras F, Shah SM, et al. Ultrasound estimation of fetal weight: a formula for a Pakistani population. J Obstet Gynaecol Res. 2010;36:479–83. doi: 10.1111/j.1447-0756.2010.01169.x. [DOI] [PubMed] [Google Scholar]
- [5].Akhtar W, Ali A, Aslam M, et al. Birth weight estimationea sonographic model for Pakistani population. J Pak Med Assoc. 2010;60:517–20. [PubMed] [Google Scholar]
- [6].Venkat A, Chinnaiya A, Gopal M, et al. Sonographic fetal weight estimation in a South-East Asian Population. J Obstet Gynaecol Res. 2001;27:275–9. doi: 10.1111/j.1447-0756.2001.tb01269.x. [DOI] [PubMed] [Google Scholar]
- [7].Meire HB, Farrant P. Ultrasound demonstration of an unusual fetal growth pattern in Indians. Br J Obstet Gynaecol. 1981;88:260–3. doi: 10.1111/j.1471-0528.1981.tb00979.x. [DOI] [PubMed] [Google Scholar]
- [8].Leon DA, Moser KA. Low birth weight persists in South Asian babies born in England and Wales regardless of maternal country of birth. Slow pace of acculturation, physiological constraint or both? Analysis of routine data. J Epidemiol Community Health. 2012;66:544–51. doi: 10.1136/jech.2010.112516. [DOI] [PubMed] [Google Scholar]
- [9].Dudley NJ. A systematic review of the ultrasound estimation of fetal weight. Ultrasound Obstet Gynecol. 2005;25:80–9. doi: 10.1002/uog.1751. [DOI] [PubMed] [Google Scholar]
- [10].Campbell S, Wilkin D. Ultrasonic measurement of fetal abdomen circumference in the estimation of fetal weight. Br J Obstet Gynaecol. 1975;82:689–97. doi: 10.1111/j.1471-0528.1975.tb00708.x. [DOI] [PubMed] [Google Scholar]
- [11].Hadlock FP, Harrist RB, Carpenter RJ, et al. Sonographic estimation of fetal weight. The value of femur length in addition to head and abdomen measurements. Radiology. 1984;150:535–40. doi: 10.1148/radiology.150.2.6691115. [DOI] [PubMed] [Google Scholar]
- [12].Higginbottom J, Slater J, Porter G, et al. Estimation of fetal weight from ultrasonic measurement of trunk circumference. Br J Obstet Gynaecol. 1975;82:698–701. doi: 10.1111/j.1471-0528.1975.tb00709.x. [DOI] [PubMed] [Google Scholar]
- [13].Jordaan HV. Estimation of fetal weight by ultrasound. J Clin Ultrasound. 1983;11:59–66. doi: 10.1002/jcu.1870110202. [DOI] [PubMed] [Google Scholar]
- [14].Warsof SL, Gohari P, Berkowitz RL, et al. The estimation of fetal weight by computer-assisted analysis. Am J Obstet Gynecol. 1977;128:881–92. doi: 10.1016/0002-9378(77)90058-8. [DOI] [PubMed] [Google Scholar]
- [15].Ferrero A, Maggi E, Giancotti A, et al. Regression formula for estimation of fetal weight with use of abdominal circumference and femur length: a prospective study. J Ultrasound Med. 1994;13:823–33. doi: 10.7863/jum.1994.13.11.823. [DOI] [PubMed] [Google Scholar]
- [16].Hadlock FP, Harrist RB, Sharman RS, et al. Estimation of fetal weight with the use of head, body, and femur measurementsea prospective study. Am J Obstet Gynecol. 1985;151:333–7. doi: 10.1016/0002-9378(85)90298-4. [DOI] [PubMed] [Google Scholar]
- [17].Warsof SL, Wolf P, Coulehan J, et al. Comparison of fetal weight estimation formulas with and without head measurements. Obstet Gynecol. 1986;67:569–73. [PubMed] [Google Scholar]
- [18].Hsieh FJ, Chang FM, Huang HC, et al. Computer-assisted analysis for prediction of fetal weight by ultrasoundcomparison of biparietal diameter (BPD), abdominal circumference (AC) and femur length (FL) Taiwan Yi Xue Hui Za Zhi. 1987;86:957–64. [PubMed] [Google Scholar]
- [19].Merz E, Lieser H, Schicketanz KH, et al. Intrauterine fetal weight assessment using ultrasound. A comparison of several weight assessment methods and development of a new formula for the determination of fetal weight. Ultraschall Med. 1988;9:15–24. doi: 10.1055/s-2007-1011588. [DOI] [PubMed] [Google Scholar]
- [20].Shepard MJ, Richards VA, Berkowitz RL, et al. An evaluation of two equations for predicting fetal weight by ultrasound. Am J Obstet Gynecol. 1982;142:47–54. doi: 10.1016/s0002-9378(16)32283-9. [DOI] [PubMed] [Google Scholar]
- [21].Vintzileos AM, Campbell WA, Rodis JF, et al. Fetal weight estimation formulas with head, abdominal, femur, and thigh circumference measurements. Am J Obstet Gynecol. 1987;157:410–4. doi: 10.1016/s0002-9378(87)80182-5. [DOI] [PubMed] [Google Scholar]
- [22].Shinozuka N, Okai T, Kohzuma S, et al. Formulas for fetal weight estimation by ultrasound measurements based on neonatal specific gravities and volumes. Am J Obstet Gynecol. 1987;157:1140–5. doi: 10.1016/s0002-9378(87)80278-8. [DOI] [PubMed] [Google Scholar]
- [23].Combs CA, Jaekle RK, Rosenn B, et al. Sonographic estimation of fetal weight based on a model of fetal volume. Obstet Gynecol. 1993;82:365–70. [PubMed] [Google Scholar]
- [24].Ott WJ, Doyle S, Flamm S, et al. Accurate ultrasonic estimation of fetal weight. Prospective analysis of new ultrasonic formulas. Am J Perinatol. 1986;3:307–10. doi: 10.1055/s-2007-999885. [DOI] [PubMed] [Google Scholar]
- [25].Melamed N, Yogev Y, Meizner I, et al. Sonographic fetal weight estimation which model should be used? J Ultrasound Med. 2009;28:617–29. doi: 10.7863/jum.2009.28.5.617. [DOI] [PubMed] [Google Scholar]
- [26].Hebbar S. Critical evaluation of various methods of estimating foetal weight by ultrasound. J Obstet Gynaecol India. 2003;53:131–3. [Google Scholar]
- [27].Kumarasiri S, Wanigasekara R, Wahalawatta L, et al. Accuracy of ultrasound estimated fetal weight formulae to predict actual birthweight after 34 weeks: prospective validation study. Ceylon Med J. 2013;58:116–21. doi: 10.4038/cmj.v58i3.6104. [DOI] [PubMed] [Google Scholar]
- [28].Mazhur SI, Hossain A, Afroz L, et al. Ultrasonic foetal weight estimation at term in Bangladeshi women-a comparative study of eight formulae. Ibrahim Card Med J. 2013;1:29–34. [Google Scholar]
- [29].Kumara DMA, Perera H. Evaluation of six commonly used formulae for sonographic estimation of fetal weight in a Sri Lankan population. Sri Lanka J Obstet Gynaecol. 2009;31:20–33. [Google Scholar]
- [30].Stetzer BP, Thomas A, Amini SB, et al. Neonatal anthropometric measurements to predict birth weight by ultrasound. J Perinatol. 2002;22:397–402. doi: 10.1038/sj.jp.7210754. [DOI] [PubMed] [Google Scholar]
- [31].Gull I, Fait G, Har-Toov J, et al. Prediction of fetal weight by ultrasound: the contribution of additional examiners. Ultrasound Obstet Gynecol. 2002;20:57–60. doi: 10.1046/j.1469-0705.2002.00742.x. [DOI] [PubMed] [Google Scholar]
- [32].Pang MW, Leung TN, Lau TK. A validation study of ultrasonic foetal weight estimation models for Hong Kong Chinese singleton pregnancies. Hong Kong Med J. 2004;10:384–8. [PubMed] [Google Scholar]
- [33].Tibshirani R. Regression shrinkage and selection via the lasso. J R Stat Soc Series B Stat Methodol. 1996:267–88. [Google Scholar]
- [34].Scioscia M, Scioscia F, Vimercati A, et al. Estimation of fetal weight by measurement of fetal thigh soft-tissue thickness in the late third trimester. Ultrasound Obstet Gynecol. 2008;31:314–20. doi: 10.1002/uog.5253. [DOI] [PubMed] [Google Scholar]
- [35].Nahum GG, Pham KQ, Stanislaw H. Prediction of term birth weight in Hispanic women using an equation based on maternal characteristics. Eur J Obstet Gynecol Reprod Biol. 2004;112:145–50. doi: 10.1016/s0301-2115(03)00325-7. [DOI] [PubMed] [Google Scholar]