

Summary
Identifying molecular cancer drivers is critical for precision oncology. Multiple advanced algorithms to identify drivers now exist, but systematic attempts to combine and optimize them on large datasets are few. We report a PanCancer and PanSoftware analysis spanning 9,423 tumor exomes (comprising all 33 The Cancer Genome Atlas projects) and using 26 computational tools to catalogue driver genes and mutations. We identify 299 driver genes with implications regarding their anatomical sites and cancer/cell types. Sequence- and structure-based analyses identified >3,400 putative missense driver mutations supported by multiple lines of evidence. Experimental validation confirmed 60–85% of predicted mutations as likely drivers. We found that >300 MSI tumors are associated with high PD-1/PD-L1 and 57% of tumors analyzed harbor putative clinically actionable events. Our study represents the most comprehensive discovery of cancer genes and mutations to date and will serve as a blueprint for future biological and clinical endeavors.
Keywords: Oncology, driver discovery, structure analysis, mutations of clinical relevance
ITI
A comprehensive analysis of oncogenic driver genes and mutations in >9,000 tumors across 33 cancer types highlights the prevalence of clinically actionable cancer driver events in TCGA tumor samples.
Introduction
Over the past decade, The Cancer Genome Atlas (TCGA) has coordinated a monumental enterprise of data generation and genomic investigation across 33 cancer types. Numerous notable findings have emerged from this project (https://cancergenome.nih.gov/publications). The individual TCGA projects motivated the development of many bioinformatic algorithms oriented toward discovery, characterization, and prioritization of cellular processes driving cancer based on pathways (Creixell et al., 2015), genes (Ding et al., 2014), or individual variations (Pathways and Group, 2013) (Key Resources Table and Methods). Despite this remarkable progress, algorithms do not entirely agree on certain candidate cancer driver genes and mutations, necessitating expert curation to filter likely false positive findings. Previous PanCancer analyses(Tamborero et al., 2013b) have been limited to fewer cancer types and have largely avoided nominating rare driver mutations.
KEY RESOURCES TABLE.
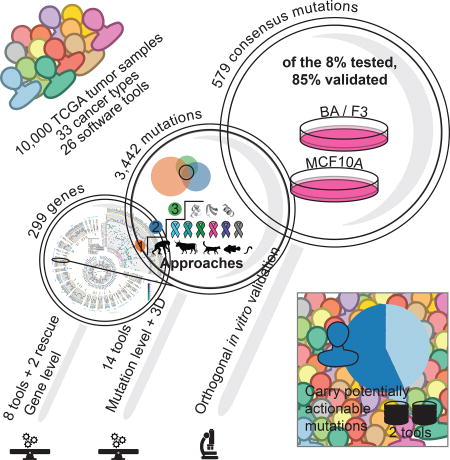
TCGA is now concluding the most sweeping cross-cancer analysis yet undertaken, namely the “PanCanAtlas project”. This project includes the uniform analysis of all TCGA exome data by the Multi-Center Mutation-Calling in Multiple Cancers (MC3) network, yielding unbiased interpretation of the entire 10,437 tumor samples dataset. Here, we describe our analysis of the MC3 somatic mutation set using 26 diverse bioinformatics tools (Figure S1A). Merging results from these tools and manual curation ultimately identified 299 cancer genes. In parallel with functional validation in cell lines, 8 other tools and 1 novel aggregating algorithm characterized mutations having the strongest phenotypic consequences. Four additional tools leveraged protein structural data to elucidate clusters of mutations in 3-dimensional space. Finally, the 5 remaining tools expounded on copy-number, RNA-abundance, and clinical association using networks, machine learning, and database mining algorithms to further corroborate mutation level findings. The systematic and deep nature of these findings will serve cancer research far into the future.
Results
Mutational dataset and driver gene identification power
Mutation calls were produced by the Multi-Center Mutation Calling in Multiple Cancers (MC3) working group that harmonized results of 7 algorithms (Ellrott et al.) (Methods). To reduce the false positive rate for driver gene discovery, we implemented three strategies to optimize driver detection and data quality (Figure S1B and Methods). Briefly, we excluded 344 hypermutator samples because of artifactual sensitivity to high background mutation rates (Figure 1A). All mutations that passed the MC3 filter criteria were included. In addition, a less stringent filter was applied to samples from the OV and LAML projects, as exome data for these two cancer types have distinct characteristics not amenable to our standard filtering. Finally, samples marked with inconsistent pathology were excluded. Our driver detection dataset ultimately consisted of 9,079 samples having 1,457,702 total mutations (Figure S1B), where the number of mutations per sample was widely distributed across cancer types, as previously noted (Figures 1B and 1C).(Kandoth et al., 2013; Lawrence et al., 2013; Tamborero et al., 2013b)
Figure 1. Cancer driver gene discovery strategy, power, and mutations.

(A) We identified 6 main steps to identify and discover driver genes in cancer: data curation, tool development, outlier adjustment, manual curation, downstream tool analysis, and functional validation. (B) Somatic mutations per sample are plotted for each sample and cancer type. Mutations are separated into SNVs (blue) and indels (green). The selected hypermutator cut-off for each cancer is shown in red. (C) Transition and transversion proportions are shown for 6 nucleotide changes. The stacked proportion bar chart is sorted by increasing transition/transversion fraction. (D) Statistical power for detection of cancer driver genes at defined fractions of tumor samples above the background mutation rate (effect size with 90% power) is depicted. Circles indicate each of 33 cancer types placed according to the study sample size and median background mutation rate. See also Figures S1 and S2, and Table S6.
For individual cancer types, analyses were sufficiently powered to detect genes mutated at a median of 6.1% above background mutation rates (Figure 1D). Power largely correlated with cohort size, with lower values observed for DLBC (25.5%, n=37), CHOL (20.5%, n=34), and UCS (14.9%, n=55), and the highest statistical power for BRCA (2.3%, n=779), LGG (2.8%, n=510), and THCA (2.3%, n=491). We saw modest increase in statistical power for 12 individual cancer types previously analyzed by the TCGA PanCancer effort (Kandoth et al., 2013), but the addition of 21 individual cancer types to our current PanCancer analysis increased power to <1% prevalence (Figure S1C).
The landscape of cancer driver genes
The final consensus list consists of 299 unique genes: 258 genes obtained from a systematic approach and 41 additional genes recovered after manual curation of previous TCGA marker papers with the majority (26 out of 41, 63%) supported by additional -omic network tools not used in original significantly mutated gene (SMG) detection studies (Methods, Figure 1A, Figure S2 and Table S1). We focus here on the 258 genes set, but acknowledge the limitations of a systematic approach by including the 41 manually rescued genes in our final list.
The list recovers most of the previously described driver genes for the majority of cancer types. In fact, in 20 out the 31 cancer types included in our study that had either been previously published or for which we had an internal list of known cancer driver genes, the recovery rate is 80% or higher (Figures S2D and S2E). The most significant outliers are STAD and the previous PanCancer study, for which we only recovered around 70% of the previously described genes (Figure S2D). The consensus list also includes 59 novel genes that had not been described previously and other known drivers not previously associated with a given tissue (Methods, Table S1). Predictions of known cancer driver genes in new cancer types include ATRX in ACC, KMT2C, CTNNB1 and PTEN in BLCA, and ARID1A and KRAS in BRCA. Entirely novel predictions include GNA13 in BLCA (a homologue of the known drivers GNAQ and GNA11), RRAS2 in UCEC (with shared homology in KRAS and HRAS), and KIF1A in HNSC (a kinesin of the same family of the cancer driver KIF5B).
The number of detected cancer driver genes varies among cancer types, with KICH having the fewest (2 genes) and UCEC having the most (55 genes). Furthermore, the ratio of predicted tumor suppressor genes to oncogenes vary widely by tissue (Figure S4B). We observed a significant positive correlation (Pearson R=0.66, P value=4.1e-5) between average mutation burden in a cancer type and the number of identified consensus genes (Figure S3B). Study-based calculations for powered effect size in each cancer type did not entirely explain this phenomenon (Pearson R=−0.31, P value=0.09) (Figure S3C). Regarding the associations of driver genes with different cancer types, many genes (142 out of 258) are associated with a single cancer, whereas 87 genes have driver roles in two or more cancer types, with an additional 29 genes uniquely identified using PanCancer approaches on all samples combined. As expected, TP53 is the most extreme case (27 cancer types), followed by PIK3CA, KRAS, PTEN and ARID1A, each of which is associated with 15 or more cancer types (Figure 2A and Figure S4A).
Figure 2. Cancer driver gene discovery workflow.

(A) Circos(Krzywinski et al., 2009) plot displays 299 cancer genes. Each sector indicates a unique cancer type (text in blue) with predicted drivers unique to that cancer type listed (gene name in black). Only tissues having at least one unique driver gene are shown. The top right sector shows all genes found significant in multiple cancer types. Next, a categorical score of gold, silver, or bronze is assigned to each gene based on the highest consensus score. If a gene was not scored and required rescue, then the field is empty. The next ring illustrates the mutation frequency of a gene. For the top right wedge the PanCancer frequency is used, while cancer-type-specific frequencies are used in the remaining sectors. Where frequencies exceed the y-axis limit of 10%, the innermost label indicates the frequency. The final ring uses a 5-point scale from orange to teal for representing each gene from likely tumor suppressor to likely oncogene, respectively, according to the 20/20+ algorithm. Finally, in the top right slice, we show hierarchical clustering of the gene consensus scores for genes that were found in more than one cancer type (note: CRC refers to the COADREAD cancer type). Additionally, significant gene clusters (permutation test) identified Pan-Gastrointestinal (red), Pan-Squamous (purple), and Pan-Gynecological tissues (green). The middle ring illustrates all genes that were found only using PanCancer results, or were otherwise rescued. (B) Heatmap showing clustering of different cancer types by pathway / biological process affected by associated consensus driver genes. Cell of origin for pan-gynecological, pan-gastrointestinal, and pan-squamous are colored as above. See also Figures S2, S3 and S4, and Tables S1, S2, and S7.
We clustered cancer types according to the consensus scores of their associated genes. Remarkably, some cancer types grouped by tissue of origin, such as LGG and GBM; others by cell of origin. The most significant of the cell origin clusters spans all squamous cancer types (BLCA, CESC, ESCA, HNSC and LUSC, (permutation test, adjusted p < 0.01) and includes several transcription factors (ZNF750, NFE2L2 or KLF5), chromatin and histone modifiers (KMT2D, EP300, or NSD1), and various PI3K pathway genes (PIK3CA, PTEN or MAPK1). We found two additional significant clusters (permutation test, adjusted p < 0.05) that group gynecological (UCS, CESC, UCEC, OV, and BRCA), as well as gastrointestinal cancers (COADREAD, PAAD, ESCA and STAD) (Figure 2A, Figure S4A and Methods).
Finally, we classified the consensus driver genes according to cancer-related biological processes and associated pathways (Figure 2B and Table S2). For most genes, the categories (excluding “other” and “other signaling”) clearly reflect known processes involved in carcinogenesis, namely “transcription factor” (39 genes), “RTK signaling” (16) and “RNA abundance” (15), “protein homeostasis/ubiquitination” (15), “chromatin histone modifiers” (15), “genome integrity” (14), “chromatin other” (14) and “immune signaling” (10). The last group is of particular interest, given the connection between driver genes and immune response(Thorsson et al.). In terms of cancer types, most have at least one cancer driver that belongs to either genome integrity (28 out of 33 cancer types) or the MAPK or PI3K signaling pathways (24 and 22 cancer types, respectively). Notably, squamous cancer types have higher proportions of chromatin histone modification genes, as well as receptor-tyrosine kinase and immune signaling.
Approaches to Driver Mutation Discovery
Not all mutations in a cancer driver gene have equal impact (Torkamani and Schork, 2008), with consequences frequently depending on position within the protein and amino acid change (Carter et al., 2009). We explored this issue across the entire PanCancer dataset, classifying 751,876 unique missense mutations by examining the 299 identified cancer driver genes, according to their predicted oncogenic effect. We combined the output of three different categories of tools into consensuses approaches (Methods): (I) tools distinguishing benign versus pathogenic mutations using sequence (CTAT-population); (II) tools distinguishing driver versus passenger mutations using sequence (CTAT-cancer); and (III) tools discovering statistically significant three-dimensional clusters of missense mutations (Structure-based). These tool groups identified 10,098 (1.3% of total missense mutations), 4,595 (0.6%), and 1,469 (0.2%) unique amino acid substitutions, respectively (Figure 3A). Differences in the number of predicted driver mutations for each approach are likely due to tool design and requirements, i.e., dependence of structural clustering tools on available three-dimensional protein structures (either experimental or homology-based) yields fewer predicted driver mutations.
Figure 3. Driver mutation discovery approaches, overview, overlap, and contrasts.

(A) Venn diagram indicates total number of mutations overlapping among three consensus approaches: CTAT-population, CTAT-cancer, and structural clustering. Adjacent bar chart indicates the top 20 genes sorted by 3-set intersecting mutation counts. (B) Driver gene discovery identified gene-tissue pairs (canonical genes) in tumor suppressors and oncogenes. However, some gene-tissue pairs were not identified in driver discovery (non-canonical). Mutation frequency from canonical and non-canonical cancer genes are displayed and divided among 4 mutation classes: truncation/frameshift mutations (grey); missense mutations uniquely identified by only one approach (yellow, see Panel A); missense mutations identified by multiple approaches (red, see Panel A); and missense passenger mutations not identified by any approach (off white). (C) Mutation percentage out of all missense and truncating/frameshift mutations within a gene is shown on the y-axis (log scale). Point size is log scaled and represents amino acid position frequency. The top 23 genes ordered by increasing mutational diversity (normalized entropy) and only the 9 most frequently mutated amino acid positions for each gene are shown. See also Figure S5 and Table S4.
When benchmarked against OncoKB (Chakravarty et al., 2017), a manually curated dataset of cancer mutations annotated according to likely oncogenic effect, cancer-focused algorithms had superior predictive value than algorithms distinguishing benign and pathogenic mutations (Figure S5). The CTAT-cancer score outperformed all individual sequence-based approaches.
Overall, 9,919 predicted cancer driver mutations in our cohort (3,437 unique mutations) were identified by ≥2 approaches from CTAT-population, CTAT-cancer, or structural clustering. These mutations affect 5,782 tumor samples. These missense driver mutations represent a greater fraction of the total mutations in oncogenes than in tumor suppressors (Figure 3B). In this latter group, most mutations seem to be truncations or frameshifts, consistent with previous observations (Vogelstein and Kinzler, 2004). Nevertheless, there are also tumor suppressor genes having high numbers of missense driver mutations, such as EP300, CREBBP, CASP8, PIK3R1, and TP53 (Figure 3B). An interesting example is CDH1, which is primarily affected by truncating or frameshift mutations in BRCA (75 out of 85 mutations), but mostly targeted by missense driver mutations in STAD (21 out of 25 mutations). This suggests differing roles for CDH1 in these two cancer types.
We were intrigued by missense driver mutations detected in cancer types where the gene was not predicted to be a driver. This subset is particularly important for genotype-driven clinical trials (Gagan and Van Allen, 2015). Overall, there are 1,719 tissue-unmatched likely driver mutations (19% of the total) in 1,431 patients (16%) and 502 patients whose only predicted missense driver mutations affect genes not yet known to play a role in that cancer type. For example, we identified 28 patients with predicted EGFR driver mutations in cancer types where EGFR is not yet identified as a common driver gene, such as HNSC, STAD, LUSC, UCEC, ESCA, and LIHC. In extreme cases, such as ERBB4 or GNAS, these mutations actually represent the majority of predicted driver missense mutations in the gene (Figure 3B). Additionally, we found that 2% (10/457) of IDH1 missense events that occur at position R132 are found in cancers not typically known to carry such mutations, i.e. BLCA (n=2), BRCA (2), COADREAD (2), LUAD (2), PCPG (1), and THYM (1) (Figure 3C). Furthermore, we observed that RRAS2Q72, a predicted oncogene in UCEC (n=5 samples) with strong homology to KRASQ61 and HRASQ61, was exceptionally mutated in cancer types where it was not previously recognized: UCS (n=1), LUSC (1), LUAD (1), PRAD (1), HNSC (1), and TCGT (1). Any analysis focusing only on driver genes and mutations known in that cancer type would very likely miss presumed driver mutations for those patients.
Functionally Validated Mutations Confirm Structure-based Analysis
We used an independent dataset of 1,049 experimentally tested somatic mutations to validate our driver mutation prediction (Ng et al., 2018). Briefly, mutations were introduced in two cancer cell lines, Ba/F3 and MCF10A, and were evaluated for oncogenicity based on survival and growth (Methods). In total, 160 mutations from 19 genes were validated in this dataset. The percentage of functionally validated mutations increased from 60% predicted with CTAT-population, to 61% for those found by CTAT-cancer, and 78% for Structure-based analysis (Figure 4A). Among the 579 mutations predicted by all three approaches (Table S4), 39 of the 46 tested (85%) were validated. Further, the sensitivity and specificity of identifying driver mutations annotated by OncoKB suggests performance is generalizable to larger gene sets. (Figure S5E). These results support the value of the prediction algorithms used in our study and the advantage of combining multiple tools. Also, we would like to note that this approach only addresses true positive findings and represents a floor estimate for computational predictions.
Figure 4. Driver mutation discovery and validation.

(A) Steps taken to assess consensus among mutation-level predictions using sequence-based and structural clustering tools and comparing them to an orthogonal set of functionally validated mutations. From left to right: grey box represents missense mutations that were processed by 12 tools from 3 categories (population-based, cancer-focused, and structural clustering tools) and combined into three consensus approaches (CTAT-population, CTAT-cancer, and structural clustering). Total number and percentage of functionally validated/tested mutations is also shown. (B) Number of mutations (y-axis) found by structural tools for each gene (x-axis) are shaded according to support by structural tools (green). Those mutations without support are distinguished by two categories, with (grey) and without (white) available protein structure. Heatmaps (D, F, H) coupled with protein structure (C, E, G) are shown in panels for proteins PIK3CA/PIK3R1 (PDB ID: 4OVU), BRAF (4MBJ), and KEAP1/NFE2L2 (3ZGC), respectively, and display whether a particular mutation was detected by sequence-based (CTAT-population or CTAT-cancer) or structure-based approaches (at least two structural tools). Purple/teal colors distinguish proteins (PIK3CA/PIK3R1 and KEAP1/NFE2L2 pairs) for mutations found by structure-based approaches, while pink boxes indicate mutations found only by sequence-based approach. Additionally, for each mutation, frequency (blue gradient), OncoKB status (red gradient), testing status (tan), and validation status (grey) are provided. All mutations found by structure-based approaches in each of the 3 genes are shown with a few additional mutations that are only found by sequence-based approaches. Key mutations are highlighted from heatmaps and labeled with white, grey, and tan labels referring to novel, validated, and tested (not validated) mutations, respectively. See also Table S4.
Structural-based mutations clustered on 66 proteins, including one cluster on KLF5, a gene not previously identified in PanCancer studies and ranked among the top 30 clusters by PanCancer mutation frequency (Figure 4B). We sought to further examine predictions of the three approaches in various well-established cancer driver genes, such as PIK3CA/PIK3R1, BRAF, and KEAP1/NFE2L2 (Figures 4C–4H). The interface between PIK3CA and PIK3R1 contains a cluster of mutations found by at least 2 of the approaches and includes both validated mutations and some not tested. D560G, N564D, and K567E are validated mutations that cluster closely to non-tested mutations R577P/Q, S565R, and P568T in PIK3R1. Similarly, PIK3CA contains validated mutations C378Y, V344G/M, N345T/I/K, P471L, C420R, and E418K clustering with non-tested mutations S379T, N380S, and E418K. These non-tested mutations are excellent candidates for further experimental validation due both to their close proximity to known validated driver mutations and support from sequence-based approaches (Figures 4C and 4D). BRAF also contains clusters similar to this PIK3CA/PIK3R1 cluster, with a mixture of validated and novel mutations (Figures 4E and 4F).
Additionally, there are many genes that contain mutations found by all three approaches, but that were not tested experimentally, including KEAP1, NFE2L2, RHOA, MTOR, MAP2K1, and VHL. Nevertheless, many of these driver mutations have orthogonal evidence from OncoKB. For example, G333D/S mutations in KEAP1 have an OncoKB status of likely oncogenic and oncogenic, respectively (Figures 4G and 4H). There are also NFE2L2 mutations that cluster closely with KEAP1 mutations along the protein-protein interface (D77, E82, G81, E79). While they were not experimentally validated, all have an OncoKB status of either likely-oncogenic or oncogenic. Other KEAP1 mutations in the same cluster found by all three approaches are R483C, Y525C, G524C, G571D, and R413H. However, none of these mutations were tested in our dataset, nor have evidence from OncoKB. Given their proximity to the validated KEAP1 sites and the bioinformatic evidence that we found, these mutations are ideal candidates for follow-up validation experiments.
Overall, this analysis demonstrates the complementarity of sequence-based and structure-based approaches. For example, E365V, C604R, and C901F in PIK3CA, F646S in PIK3R1, and H725Y and P731S in BRAF were found only by the former and were experimentally validated (Figures 4D and 4F). Conversely, R462T in BRAF was only found by the latter and is annotated as likely oncogenic in OncoKB (Figures 4F and 4H).
Hypermutated phenotypes and immune infiltrates
Environmental and biological factors such as tobacco exposure, ultraviolet radiation (UV), and microsatellite instability (MSI), contribute to the tumorigenic hypermutator phenotype (Roberts and Gordenin, 2014). Because many hypermutated samples were excluded in the driver-discovery dataset, we performed additional analyses to explore genes associated with this phenotype. Using mutation signature analysis, we found that 90% (309/344) of the samples that we labeled as hypermutated have MSI, UV, POLE, APOBEC, or smoking as their primary signature (Figure 5A). MSI and POLE, are particularly prevalent, accounting for 56% of the hypermutated samples. As expected, many cancer genes involved in MSI and mismatch repair (MMR), i.e. POLE, MLH1, MSH3, and MSH2 (Alexandrov et al., 2013; Kim et al., 2013), are frequently mutated in these samples (Table S5, and Methods).
Figure 5. Hypermutators exhibit multiple signatures, microsatellite instability, and immune infiltration expression.

(A) UpSetR(Conway et al., 2017) plot highlights the intersection of multiple signatures and phenotypes with hypermutated samples. (B) MSI scores segregated by cancer types. MSI-score threshold is displayed with a vertical line. The percentage of samples with high MSI is displayed to the right of each cancer type. (C, D) RNA-Seq abundance of different immune biomarkers across signatures and MSI phenotypes defined by MSIsensor. Stars indicate significance levels using a two-sided t-test to calculate p-values (* < 0.05, ** < 0.01, *** < 0.001). See also Figure S6 and Table S5.
We expanded our analysis on mutation signatures by estimating MSI status using MSIsensor (Niu et al., 2013) across all samples (n=9,423). 338 tumors have a score >4 (indicative of an MSI-High phenotype). MSIsensor scores were correlated with validated gel assays in a subset of hypermuated samples (n=180, multiple regression model, p-value < 2×10⁻¹⁶, r2=0.504, Methods). We identified canonical MSI cancer types (UCEC, COAD, and STAD) as having the highest average MSI scores across all samples (Figure 5B). We also observed 73 tumors with high MSI-scores from non-canonical cancers i.e., 2% of OV (n=7), and 2% of CESC (n=5). We observed that OV tumors have a higher mean MSIsensor score when compared to other tissues, which is consistent with previous findings (Cortes-Ciriano et al., 2017). 4 of 5 CESC MSI samples harbored mutations in genes known to be involved in MSI, including 1 sample with 2,644 somatic mutations that carried frameshift deletions in both MLH3 and MSH3.
MSI cases show improved response to immune checkpoint therapy, independent of histology(Brahmer et al., 2012; Gryfe et al., 2000; Le et al., 2015). Thus, we tested whether the samples with high MSIsensor scores exhibited similar patterns of immune infiltration between environmental and biological mechanisms. Using RNA-Seq abundance data, we calculated PD-L1, PD-L2, PD-1, CD8A, and CD8B expression in MSI-High and microsatellite stable (MSS) samples to identify via association those samples that would likely benefit from immunotherapy (Figure 5C, Methods). We observed a significant difference between immune infiltrates when comparing samples with high MSIsensor scores (≥4) to others with low MSIsensor scores (<4) from COADREAD, STAD, and UCEC (Figures 5C), in agreement with previous findings about these cancer types. We then tested whether the other 3 most prevalent signatures in hypermutators, i.e. smoking, UV, and APOBEC, have similar patterns of immune infiltrate expression. However, only suggestive evidence (t-test, p-value < 0.05) was found for PD-1 overexpression in hypermutated bladder cancer (BLCA) samples with the APOBEC signature (Figure 5D). Together, these findings corroborate the known relationship between total mutational burden and expression of immune modulators, but suggest that MSI may be particularly immunogenic. Additionally, an examination of BRCA samples revealed that 11 of 12 hypermutated samples harbor at least one mutation in MSI associated genes (1 with hypermethylated MLH1) and had increased expression in PD-L1, PD-L2, and CD8A when compared to non-hypermutated cases (t-test p-values <0.01, <0.01 and <0.05 respectively, Figure S7A). Similar findings in CESC and LUSC illustrate potential driver mechanisms in a subset of cases often overlooked in driver gene discovery analysis (Figures S7B and S7C).
Therapeutic implications of molecular events
We used two different databases to assess therapeutic implications of molecular events in our dataset: Precision Heuristics for Interpreting the Alteration Landscape (PHIAL) (Van Allen et al., 2014) and Database of Evidence for Precision Oncology (DEPO, http://depo-dinglab.ddns.net). Both databases cast therapeutic projections based on FDA-approved therapies, clinical trials, published clinical evidence and, in the case of PHIAL, the TARGET database. PHIAL works at the gene level, whereas DEPO focuses on specific mutations (Methods). We emphasize that, while the implications and results of this section have been curated based on the literature, many of these results are still undergoing rigorous scientific/clinical testing. However, eligibility for clinical trials based on demonstration a particular driver mutation still falls within the rubric of a clinically actionable mutation.
We observed that both the fraction of samples and proportion of alteration types varied across tissue types. By PHIAL heuristics, 52% of all samples contained at least one putatively actionable alteration (Figure 6A), while 65% of samples had at least one putatively actionable or biologically relevant alteration from TARGET. Using DEPO, we found that 30% of samples in our dataset had at least one clinically actionable mutation (Figure 6B).
Figure 6. Putative actionability across TCGA studies.

(A) Percentage of samples (y-axis) with at least 1 putatively actionable SNV/indel/CNV (orange), SNV/indel (blue), and CNV only (green) for each cancer type (x-axis) from the TARGET database. Sample size is also given for each cancer type in x-axis labels. Only 8,775 samples are represented due to limitations of copy number data. (B) Percentage of samples (y-axis) with a druggable mutation (missense, indel, frameshift, and nonsense) from DEPO in each cancer type (x-axis) at various stages of approval: FDA approved (red), Clinical Trials (blue), Case Reports (green), and Preclinical (orange). 9079 samples are represented. See also Figure S7.
Using PHIAL, the most common putatively actionable alterations across the entire dataset were CDKN2A deletions (13%), PIK3CA mutations (12%), MYC amplifications (8%), BRAF mutations and amplifications (8%), and KRAS mutations (7%). CDKN2A loss may predict sensitivity to CDK4/6 inhibitors and affects over 40% of GBM, MESO, and ESCA patients. PIK3CA mutations, which may predict sensitivity to PIK3CA inhibitors, affected 45% of patients with UCEC; MYC amplifications, prognostic in glioma and pancreatic cancer, were also present in 33% of OV samples. BRAF mutant samples made up over half of THCA and SKCM patients, suggesting sensitivity to RAF inhibitors. Finally, we also found high fractions of patients with pancreatic, colon, rectum, and lung adenocarcinomas with KRAS mutations (between 70% and 30% in all cases). While these mutations are currently of limited utility in untreated pancreatic and lung adenocarcinomas, they predict resistance to anti-EGFR therapies in colorectal adenocarcinoma.
Similar to PHIAL, PIK3CA, BRAF, and KRAS contributed to the most number of samples with potentially actionable alterations from DEPO. SKCM, UVM, LGG, PAAD, COAD, and THCA have higher prevalence of clinically actionable alterations. When looking at the most common clinically actionable alterations by cancer type (Figure S7D), some of the same genes as PHIAL are key avenues for potential targeting, such as BRAF (V600E) for SKCM. Some key differences occur for uveal melanoma (UVM), in which GNAQ (Q209P) and GNA11 (Q209P/L) mutations are present in 34% and 43% of cases, respectively. These mutations may be sensitive to MEK inhibitors in SKCM undergoing clinical trials. Additionally, MEK inhibitors are being deployed for UVM to target the GNAQ/GNA11 mutations, but may require additional agents to show clinical benefit (Carvajal et al., 2014). For THCA, in addition to BRAF, NRAS mutations (Q61R/K) are present in 8% of samples and could be sensitive to MEK inhibitors via repurposing; some NRAS mutations are sensitive in SKCM to MEK inhibition in clinical trials, particularly when combined with CDK4 inhibition (Adjei et al., 2008; Ascierto et al., 2013; Dummer et al., 2017; Iams et al., 2017). PIK3CA mutations (H1047R/E545K/E542K) are also prevalent in BRCA, CESC, and COAD at 24%, 20%, and 16%, respectively, in addition to UCEC, and each of these cancer types could also benefit from PI3K inhibition. Due to clinical realities and context specific pathogenesis, these percentages likely represent a ceiling of current molecular intervention potential.
Discussion
We performed a PanCancer and PanSoftware analysis on one of the largest available cancer genomics datasets, identifying 299 cancer driver genes. The gene list is limited by focus on point mutations and small indels without consideration of copy-number variations(Zack et al., 2013), genomic fusions(Yoshihara et al., 2014), or methylation events(De Carvalho et al., 2012). Nevertheless, it represents the most comprehensive effort thus far to identify cancer driver genes and will serve as an important research asset.
Many important issues in the field remain unresolved, for example the similarity of driver gene sets across cancer types(Hoadley et al., 2014), mutation order and timing (founder versus progression mutations) (Ding et al., 2012; McGranahan et al., 2015), interactions among mutations (Raimondi et al., 2016), the consequences of different mutations affecting the same gene (Torkamani and Schork, 2008), reliable tools for distinguishing driver mutations from passengers (Greenman et al., 2007), relationships between mutational signatures and driver genes (Alexandrov et al., 2013), differences between mutation burden and neoantigen load(Rizvi et al., 2015), and the implications for therapeutics(Van Allen et al., 2014). Using the consensus genes and the functional mutations found in this study, we provided partial answers to these important questions. For example, we identified a series of clusters grouping various cancer types according to their cellular origin, highlighting the importance of the Pan-squamous, Pan-gynecological, and Pan-gastrointestinal studies of the PanCanAtlas.
Another important result is the dataset of 3,442 predicted driver mutations from both sequence-based and three-dimensional structure-based approaches. Because not all mutations in driver genes are actually drivers themselves, identifying the true-driver mutation subset remains a key challenge. We also used an external, independent experimental dataset to successfully validate predictions from three different approaches that predict cancer driver mutations. Our results suggest that cancer-specific sequence-based approaches outperform those aimed at detecting pathogenic variants in general. Structure-based approaches are more specific than sequence-based approaches at predicting driver mutations, but with reduced sensitivity. While functional validation confirmed true positive predictions, it gives no information regarding false negatives. Thus, what is reported here represents a lower bound. Our assay was unable to capture other factors relevant to positive selection, such as tumor microenvironment, metastasis, interactions with treatment, or the immune system. While caution must be taken when extrapolating, these observations are consistent with other functional studies on individual proteins or a subset of the proteome that have shown that mutations affecting the same three-dimensional functional regions are likely to have similar phenotypes(Brenan et al., 2016). However, we also found several instances in which sequence-based approaches captured driver mutations overlooked by structure-based approaches. Considering both approaches as complementary can improve prediction sensitivity.
We estimate that approximately half of the 10,000 TCGA samples studied here harbor a clinically relevant mutation, by predicting either sensitivity or resistance to certain treatments or clinical trial eligibility. For instance, the finding of GNAQ or GNA11 mutation in uveal melanoma does not have a standard of care treatment, but a canonical activating mutation in one of these genes does allow consideration of a suite of rationally designed clinical trials (such MEK ± PI3K inhibitors and other approaches). Under these broader considerations, we estimate that 57% (std=26.7%) of the TCGA cases harbor at least one potentially clinically actionable target.
The findings reported here and by the larger TCGA enterprise represent early steps toward a new era in cancer research and ultimately in cancer treatment. Studies will move beyond focusing on individual genes toward systematically integrating the myriad aspects of the cancer genome, including the interrelationships among its somatic and germline variations(Carter et al., 2017) and the tumor microenvironment and the immune system(Thorsson et al.). Although this study represents the largest cancer gene and mutation study to date, we are mindful that the corpus of cancer driver genes and mutations may still be incomplete. However, it is likely that the community is nearing the beginning of the end of this phase of research, as larger cohorts continue to be examined with longer-range and longer-read sequencing technologies.
STAR Methods
CONTACT FOR REAGENT AND RESOURCE SHARING
Further information and requests for resources and reagents should be directed to and will be fulfilled by the Lead Contact Li Ding: lding@wustl.edu.
EXPERIMENTAL MODEL AND SUBJECT DETAILS
The Cancer Genome Atlas (TCGA) collected both tumor and non-tumor biospecimens from 10,224 human samples with informed consent under authorization of local institutional review boards (https://cancergenome.nih.gov/abouttcga/policies/informedconsent). Here we used variants recently uniformly re-annotated that are publically available in mutation annotation file (MAF) format at the GDC (will provide link).
METHOD DETAILS
DATA PREPARATION
A publicly available MAF file (syn7824274, GDC LINK) was recently compiled by the MC3 Working Group and is annotated with filter flags to highlight potential artifacts or discrepancies. This dataset represents the most uniform attempt to systematically provide mutation calls for TCGA tumors. The MC3 effort provided consensus calls from 7 software packages(Ellrott et al.). Flagged artifacts include: non-exonic regions, whole-genome amplified (WGA) samples, exclusion lists, blood/tumor derived pairs, strand-bias, contamination estimations, oxo-guanine artifacts, low normal read depth, polymorphisms common in EXAC(Lek et al., 2016), mutations present in a panel of normal samples, non preferred tumor normal pairs, and mutations outside the regions of interest for any caller. If a mutation was not assigned any flag and was called by 2 or more variant calling software packages, it received a ‘PASS’ identifier. We restricted our analysis to PASS calls with the exception of samples from OV and LAML, which were some of the earliest sequenced by TCGA. Preparations for these samples utilized whole genome amplified (WGA) DNA, an important factor in that the WGA process can induce artefactual mutations. Of the 412 OV and 141 LAML samples present in our data 347 (84%) and 141 (100%), respectively, had variants derived from WGA DNA. In order to maintain sample sizes and uniformity in mutation calling, we did not filter mutations containing only ‘wga’ filter tags from these two cancer types. We recognize multiple limitations of this mutation call set, including the lack of structural variants and copy number alterations, as well as variability in sequencing depth and tumor purity. The above limitations may lead to variability in mutation detection; however, the MC3 dataset reflects the state-of-the-art in consensus mutation detection.
We also excluded highly mutated samples. These hypermutators were defined as samples with a mutation count exceeding Tukey’s outlier condition, i.e. greater than 1.5 times the interquartile range above the third quartile in their respective cancer types (3Q + 1.5*IQR). Designation as a hypermutator also required the number of mutations in a sample to exceed 1000, a heuristic that limited the number of discarded samples in low mutation rate cancer types (Figure S1). LUAD, SKCM, and UCEC had hypermutator thresholds greater than 1000 mutations (1047, 2122, and 2545 respectively, Figure 1B). We also excluded samples that were flagged by the analysis-working group based on pathology, but allowed “RNA degradation” samples to remain, as this factor is not particularly relevant for most driver prediction tools based on mutations (Table S6). The final driver-discovery dataset consisted of 9,079 samples having a total of 791,637 missense mutations, 323,884 silent mutations, 96,196 3’UTR mutations, 57,900 nonsense mutations, 42,251 intronic mutations, 42,251 Frame shift deletions, 34,266 5’ UTR, 21,804 splice site mutations, 19,856 RNA mutations, 11,305 frame shift insertions, 7,622 3’ flanking mutations, 6,419 5’ flanking mutations, 6,144 in-frame deletions, 1,362 translation start site mutations, 964 nonstop mutations, and 632 in-frame insertions.
DRIVER DISCOVERY APPROACH
Using multiple tools can overcome numerous technical issues that confound individual statistical analyses to find driver genes, such as heterogeneous mutation rate across the genome(Lawrence et al., 2013), inflated significance for long genes(Watson et al., 2013), and false positive calls in cancers with high mutation rates(Tokheim et al., 2016b). We used 26 computational tools, spanning 10 different institutions, to identify mutation-based driver genes and driver mutations (Figure S1A). We divided the analysis into two phases: (I) driver gene-discovery and (II) gene and in-silico mutation validation (Figure 1C and Methods). In the first phase, we applied 8 different tools comprising algorithms based on mutation frequency (MuSiC2(Dees et al., 2012) and MutSig2CV(Lawrence et al., 2014)), features (20/20+(Tokheim et al., 2016b), CompositeDriver(in preparation) and OncodriveFML(Mularoni et al., 2016)), clustering (OncodriveCLUST(Tamborero et al., 2013a)), and externally defined regions (e-Driver(Porta-Pardo and Godzik, 2014) and ActiveDriver(Reimand and Bader, 2013)). The second phase used an additional 16 tools to further characterize the consensus genes from phase one. The collection was comprised of 8 mutation-level algorithms (SIFT(Ng and Henikoff, 2002), PolyPhen2(Adzhubei et al., 2013), MutationAssessor(Reva et al., 2011), transFIC(Gonzalez-Perez et al., 2012), fathmm(Shihab et al., 2013), CHASM(Wong et al., 2011), CanDrA(Carter et al., 2013) and VEST(Carter et al., 2013)), 4 structure-based (HotSpot3D(Niu et al., 2016), HotMAPS(Tokheim et al., 2016a), 3DHotSpots.org(Gao et al., 2017) and e-Driver3D(Porta-Pardo et al., 2015)), 2 network and –omic integration tools (OncoIMPACT(Bertrand et al., 2015), DriverNet(Bashashati et al., 2012)), and 2 algorithms to identify clinically-actionable events (PHIAL(Van Allen et al., 2014) and DEPO (in review)). Each tool reported gene or mutation level scores and/or p-values along with a brief description of recommended cutoff thresholds or filters. Finally, the CTAT algorithm was applied separately to population based and cancer based tools. This accounts for the remaining 2 tools (this manuscript) for a total of 26 tools.
Tools integrating –omics data analyzed a smaller subset of TCGA, since we had to remove 75 samples that had problems regarding RNA-degradation. This issue did not affect the algorithms based only on somatic mutation data, so these 75 samples were included in their analyses (Table S6).
STANDARDIZED RESULT REPORTING
Despite the variety in available data within the TCGA cohort, each of the 26 tools supplied tissue and PanCancer level predictions and results. We defined a standardized file format to facilitate multi-tool comparison, so each tool supplied information on genes, transcripts, missense mutations, scores, p-values, q-values and additional information needed for tool specific requirements.
CREATION OF A HIGH CONFIDENCE GENE SET
We identified a preliminary total of 2,101 potential drivers by taking the union of genes predicted by the eight driver-gene discovery tools. As illustrated in Figure S2A, the increased number of false positive genes is likely due to any individual tool's capability to maintain sound statistical properties that handle a complex set of factors such as tumor heterogeneity, increased mutation rates, and variable sample sizes. We refined this list by calculating, for each gene predicted in each cancer type, a consensus score that compensated for outlier results and correlation among tools (Figure S2, GDC link to data). The consensus score was defined as a weighted sum of the number of tools that predicted the gene to be a driver in each cancer type (see Gene Discovery Weighting Strategy). We required a minimum of two tools to agree, where both could not be outliers (score≥1.5). Although it is difficult to distinguish the overall performance improvement on a small number of held out CGC genes (Figure S3A), the weighting strategy did have higher specificity (p=4.3e-8, McNemar test), which is preferable given concerns of false positives. Regardless, the consensus score performance on identifying CGC genes (Figure S3A) support previous reports that merging the results from different algorithms improve cancer driver discovery(Tamborero et al., 2013b).
To maximize the coverage of our analysis and ensure the accuracy of our final list, we reviewed previous findings in 31 individual cancer types and PanCancer-12 from TCGA. For cancer types not yet having a TCGA publication, we consulted with the relevant analysis working groups (LIHC, TGCT, UVM, SARC, PAAD, and THYM). We included in our final consensus list all those genes that were previously described as drivers by experts in the cancer-specific analysis of TCGA datasets and were also identified by at least one of the eight algorithms, even if they did not meet our consensus score threshold (≥1.5)(Figure 2A). This resulted in an additional 54 gene-cancer pairs, such as ATR, CHEK2, IDH2, and ERCC2 in the PanCancer dataset and FOXA1 in BLCA, HRAS in SKCM, and MET in LUAD (Figure S2B–F). The majority of this effort resulted in linking cancer genes identified by our strategy to additional cancer types based on previous literature (32/54).
The process of identifying genes in previous TCGA publications consisted in the following steps:
We manually reviewed all the official marker papers for each cancer type of The Cancer Genome Atlas. When no official paper was yet available, we contacted the lead analyst of the cancer type to access the official list of cancer driver genes.
We listed all the genes that were identified in the main text of one of the main figures of the corresponding paper as significantly more mutated than expected by chance.
Once we had the genes from each cancer type, we checked whether these genes had also been identified in our analyses by, at least, one algorithm. Note that both the mutation calls and the samples from the original TCGA paper and our analysis of each cancer type differ to some extent, so it is possible that genes which were previously identified by MutSigCV or MuSiC are not found by these algorithms in our analysis.
If a gene had been identified in the dedicated cancer type, deemed important enough to be highlighted in the main text/figure of the paper, and was also identified by at least one of our 8 gene-level discovery tools, we rescued it for our final list (Table S1).
To limit false positives in the expanded list, we applied linear discriminant analysis (Figure S2C) (see Likely False Positive Gene Filter). We identified and removed 45 genes from the consensus we detected as likely false positives. These included CACNA1E in PanCancer, COL11A1 in LUAD, DST in GBM, and TTN in SKCM. The consensus list from the above systematic approach consisted of 258 unique genes (Table S1). The average number of non-silent mutations per sample in our consensus gene list varied substantially by cancer type ranging from <1 in 12 cancer types (ACC, CHOL, KICH, KIRP, LAML, MESO, PCPG, PRAD, SARC, TGCT, THCA, and THYM) to 7.3 in UCEC. A median of 85% of tumors harbored non-silent mutations in consensus genes across cancer types (Figure S3F).
Given the limitations of a systematic approach, we additionally manually rescued 41 genes (Table S1). In the rescue attempt, we started with a list of genes identified from previous TCGA marker papers but not found from our systematic approach. We rescued genes with supportive evidence from the following sources: hypermutator phenotype related genes (since we excluded hypermutated samples in our systematic discovery; 6 genes), established cancer genes from LAML because of low quality variant calling originating from liquid tumor contamination of the normal samples (6 genes), genes supported by omic network tools (DriverNet and OncoIMPACT; 25 genes), and a gene supported by all three approaches from the driver mutation discovery (1 gene). Addition of genes to the final list was subjected to expert manual curation (3 genes).
The final consensus gene list consisted of 299 unique genes across 33 cancer types and the PanCancer dataset (Figure 2A and Table S1). The list captures most previously described driver genes for the majority of cancer types. We overlapped the cancer driver genes obtained from the consensus approach without manual curation with those from 5 independent studies in 4 cancer types (BRCA, PRAD, PAAD, and LIHC) of which one is whole-genome sequencing. The consensus approach always had a greater inter-study overlap, with an average increase of 26% over only using a single tool, either MuSiC2 or MutSig2CV (Barbieri et al., 2012; Biankin et al., 2012; Nik-Zainal et al., 2016; Schulze et al., 2015; Stephens et al., 2012) (Table S3). Among the 299 genes we identified 59 novel genes that were not previously identified in 6 previous PanCancer publications (Frampton et al., 2013; Kandoth et al., 2013; Lawrence et al., 2014; Pritchard et al., 2014; Tamborero et al., 2013b; Vogelstein et al., 2013) or the cancer gene census list (http://cancer.sanger.ac.uk/census/)(Futreal et al., 2004) (Table S1).
GENE DISCOVERY WEIGHTING STRATEGY
Tools predicting cancer genes were weighted according to their performance in each cancer type, receiving half the weight if a result was deemed an outlier, thereby obligating additional tool agreement (Figure S2A). Specifically, we examined quality metrics across tools and within the same tool, which allowed us to identify outlier results. We marked outliers based on the quasi-majority of three criteria: low concordance with known cancer genes, high divergence of p-value distribution from theoretical expectation, and abnormally high number of significant genes. The first criterion evaluated the fraction overlap of significant genes with a previously manually curated set of driver genes from (Vogelstein et al., 2013) compared with the median across all tools. The second criterion examined whether the divergence of observed p-values from those theoretically expected by the Mean Log Fold Change (MLFC)(Tokheim et al., 2016b) was greater than the median of all tools, which may indicate a tool’s statistical assumptions may not be well satisfied. The third criterion examined whether a tool’s prediction for particular cancer types appeared as an outlier in terms of the number of significant genes compared against all of the results for that tool (Tukey’s outlier criterion: number significant > 3Q + 1.5*IQR). We calculated a gene consensus score by summing the tools that declared the gene as being significant, with a weight of 1 for non-outlier results and 0.5 for outlier results.
We also provided a score that is more stringent, which could be used by others to create a somewhat smaller set of confident driver genes (Table S1). Here, due to similarities in algorithmic decisions, we adjusted these consensus gene scores to compensate for correlation between tools of the same class (i.e. frequency, feature, and domain based tools). The contribution of a tool whose inference is uncorrelated with other tools is recorded by simple addition of its score to the running total. However, some tools show correlation at sufficient levels that their contributions should properly be considered in aggregate. For example, MuSiC2 and MutSig2CV are highly correlated, as are CompositeDriver and OncodriveFML (Figure S2G). For such tool pairs, we actually add the union of their scores, S1 U S2, to the running total in the form of
| (Eq.1) |
where ρ is the Pearson’s coefficient between these two tools. We applied this procedure for pairs of tools whose variances exceeded 10%, i.e. for correlations greater than 0.32. Small changes of this threshold did not have any meaningful effect.
DRIVER MUTATION DISCOVERY
To maximize the coverage of our analysis we used 12 tools that look for three distinct hallmarks of “driverness”. We utilized four tools that distinguish pathogenic mutations from benign polymorphisms on a population level (SIFT(Ng and Henikoff, 2002), PolyPhen2(Adzhubei et al., 2013), VEST (version 3 scores)(Carter et al., 2013) and MutationAssessor(Reva et al., 2011)), four tools specifically designed to distinguish between driver and passenger somatic mutations (CHASM(Wong et al., 2011), CanDrA(Carter et al., 2013), fathmm(Shihab et al., 2013) and transFIC(Gonzalez-Perez et al., 2012)) and four tools that leverage information from protein structures (HotSpot3D(Niu et al., 2016), HotMAPS(Tokheim et al., 2016a), 3DHotSpot.org(Gao et al., 2017) and e-Driver3D(Porta-Pardo et al., 2015)). In order to combine the predictions from the sequence-based approaches we used principal component analysis to develop a Combined Tool Adjusted Total (CTAT) scores for both, population-based and cancer-specific scores (Methods). Principal component analysis has been previously shown successful in a similar task of prioritizing germline mutations(Ionita-Laza et al., 2016). We also combined the results from three-dimensional tools by adding the number of tools that predicted a specific position as belonging to a cancer-mutation cluster. Finally, to limit the number of false positives, we focused our analysis on the genes of our consensus driver list.
To define the CTAT score thresholds, we used the maximum balanced accuracy when predicting OncoKB mutations “oncogenic” or “likely oncogenic” (Figure S5C and S5D). This yielded a threshold of 1.2 for CTAT-population and 2.4 for CTAT-cancer. For the structural algorithms, we report a mutation as likely driver if at least 2 algorithms identify it within a cluster. Finally, we evaluated the performance of each CTAT score using mutations from OncoKB labeled as “likely oncogenic” or “oncogenic” as true-positives.
EXPERIMENTAL VALIDATION DATA
For experimental validation to assess tool performance, we utilized experimental data provided by Gordon Mills at MD Anderson Cancer Center (Ng et al., 2018). 1049 mutations were tested in 2 growth-factor dependent cell models, Ba/F3 and MCF10A. Both models depend on specific growth factors for survival, with which they cease proliferating. It is hypothesized that a mutation is a driver if it confers survival advantage to cells even in the absence of these growth factors. Mutations were introduced in the cells and the dependent growth factors were withdrawn; subsequently, cell viability was measured. Every experiment had 2 negative controls, 3 positive controls, and a corresponding wild type (WT) of the mutation tested. In general, we considered a mutation to be ‘validated’ if the cell viabilities of the mutations were higher than those of the wild type.
QUANTIFICATION AND STATISTICAL ANALYSIS
STATISTICAL POWER ANALYSIS OF DRIVER GENE IDENTIFICATION
We performed the statistical power analysis of driver gene identification at various prevalences (effect size=0.1, 0.05, 0.02, and 0.01, fraction of samples above background) with 90% power, based on a previously established approach of elevated mutation rate(Lawrence et al., 2014). We used a binomial model implementation (https://github.com/KarchinLab/cancerSeqStudy), previously described(Tokheim et al., 2016b). Default parameters were used. We placed each cancer type or PanCancer analysis according to the median mutation rate (per mega base) and number of samples (n shown in Figure 1C). Mutation rate per mega base was calculated through using sequencing coverage of samples obtained from the MuSiC2 analysis.
ANATOMICAL CLUSTERING OF CANCER DRIVER GENES
We performed hierarchical clustering of the gene consensus scores for the 87 genes that were found in more than one cancer type (Figure S3E), thereby clustering both genes and cancer types (n=32 cancer types, COAD and READ merged by maximum consensus gene score). The correlation distance metric and average linkage were used to avoid clustering purely based on the total number of consensus genes for a cancer type. Clusters of genes were defined based on cutting the dendrogram at a depth chosen by manual inspection. Each gene cluster was tested for enrichment in three groups of cancer types using a permutation test: Pan-squamous (BLCA, CESC, LUSC, HNSC, and ESCA), Pan-gynecological (BRCA, UCEC, UCS, CESC, and OV), and Pan-gastrointestinal (STAD, COADREAD, ESCA, and PAAD). This involved, for each cluster and group of cancer types, an initial calculation of the total gene consensus score from the observed data. Labels for the cancer types were then permuted 10,000 times and the total gene consensus score was subsequently recalculated based on the permuted cancer type labels. Lastly, P values were calculated as the fraction of permuted iterations that met or exceeded the observed total gene consensus score. P values were then multiple test corrected across all genes using the Benjamini-Hochberg FDR method.
LIKELY FALSE POSITIVE GENE FILTER
We attempted to harness the collective ability of the analysis tools in order to remove remaining genes that were likely false positives using Fisher’s linear discriminant analysis (LDA). This is a PanCancer filter in the sense that we selected features by manually examining 4 attributes for each of the tools. Specifically, for each gene, we compiled average P-value over all cancers and the Pearson correlation coefficient, regression slope, and y-intercept of a least-squares fit between the cancer background mutation rates and tool P-values. We then looked for the largest difference of means in units of standard deviations for these 4 attributes between a set of true positive list in the form of the 127 genes from Kandoth et al. 2013 versus an internally-curated list of 488 false positives (Table S7). We ultimately chose 4 features: the correlation coefficient from MuSiC2, the average P-values from OncodriveFML and 20/20+, and the y-intercept from 20/20+. To harness these features collectively, we then solved the LDA linear algebra problem using decomposition, where the coefficient matrix is comprised of the within-groups variances, the vector of unknowns contains the feature weights, and the right hand side is the vector of the difference of means of the features. We then chose a conservative cut-point such the true positives were unlikely to be caught in the filter, reflecting 90% sensitivity for keeping associations found in Cancer Gene Census genes. Using the 4 LDA weights and the cut-point, we then ran the candidate gene list through the filter, removing all genes that failed the cut-point. However, we omitted from this filtering any gene already established as being a cancer gene and any “out-of-context” gene, meaning ones that showed obvious specificities to a single cancer.
CTAT SCORE
We developed the Combined Tool Adjusted Total (CTAT) score to distinguish missense mutations that are cancer drivers from passenger mutations. The CTAT score combines multiple individual tools that prioritize missense mutations. To normalize each score, we calculated the z-score by subtracting the mean score and then dividing by the standard deviation. We then performed principal component analysis (PCA) using ScikitLearn v0.18.0 and used the score along the first principal component as our CTAT score, representing the scalar projection onto the first eigenvector. Only missense mutations that had no missing values for each of the combined tools were used in generating the principal component analysis. We performed this procedure on two distinct categories of tools, “population-based” tools that distinguish damaging/pathogenic germline missense variants from common polymorphisms (SIFT, PolyPhen2, VEST, and MutationAssessor), and “cancer-focused” tools designed to distinguish somatic missense mutations that are drivers from passengers (CHASM, CanDrA, fathmm, and transFIC). To score the remaining missense mutations that did have a missing score, we imputed missing scores of the individual tool with the mean for the method. Imputation was only performed for the cancer-focused tools as the population-based tools had too many missing values.
NORMALIZED ENTROPY SCORE
We calculated a score to characterize consensus genes on their diversity of amino acid positions that contain either missense, frameshift, or truncating mutations. Because genes may be of different length and have different background mutation rates, we used a normalized entropy score (E)(Tokheim et al., 2016b):
| (Eq. 2) |
where, for each gene, n is the total number of mutated positions and p(i) represents the fraction of mutations for the i-th mutated position. The normalized entropy score takes values between 0 and 1, with values closer to one indicating an even spread of mutations across all mutated positions.
HYPERMUTATORS AND IMMUNE INFILTRATES
Hypermutator samples were defined above as those tumors with mutation counts greater than 1.5 times the interquartile range above the third quartile in their respective cancer types (3Q + 1.5*IQR). Additionally, mutations in a sample needed to exceed 1000, a heuristic that limited the number of discarded samples in low mutation rate cancer types (Figure S1). Three cancer types, LUAD, SKCM, and UCEC, had hypermutator thresholds greater than 1000 mutations (1047, 2122, and 2545 respectively, Figure 1B).
18 global mutational signatures were originally calculated for each of the hypermutator samples according to Alexandrov et al., 2013 with a minimum cosine similarity ranging from 0.57 to 0.99. These signatures were then aggregated into the 9 representative signatures presented: POLE was comprised of "POLE” and "MSI - COSMIC14 (POLE+MSI)"; MSI combined "MSI - COSMIC15", "MSI - COSMIC20 (POLD+MSI)", "MSI - COSMIC21", "MSI - COSMIC26", and "MSI - COSMIC6"; COSMIC signature 5 combined "COSMIC5", and "ERCC2 - COSMIC5", unknown is comprised of "Unknown" (many of which were attributable to noise from WGA and 3 hypermutated samples were not performed in this analysis); UV, smoking, APOBEC, COSMIC1, and COSMIC5 signatures did not require aggregation; and other was comprised of "COSMIC17", "COSMIC22 - aristolochic acid signature" and "COSMIC3 – BRCA” (Figure 5A). A primary signature for each sample was calculated by identifying as the max score from each signature.
MSIsensor(Niu et al., 2013) was applied to all 9,423 samples in our dataset. We used the authors’ recommended cut-off of greater than or equal to 4 in order to indicate MSI-High status. Scores below 4 cannot reliably distinguish been MSI-Low and MSS. More information on this tool is found in DATA AND SOFTWARE. 357 scores were generated from BAM files other than those used for variant calling by the MC3 Working group. Of the 357 samples, 29 had MSIscores greater than or equal to 4. 16 of these 29 samples (55%) had at least one frameshift/nonsense, missense mutatiation in gene involved in MSI or MMR phenotype (POLE, MLH1, MLH3, MGMT, MSH6, MSH3, MSH2, PMS1, or PMS2) or had high MLH1 methylation. Results from 180 gel-assays were provided by The Broad Institute to assess MSIsensor scores. Using a multiple regression model, quantitative MSI scores correlated with qualitative results from the gel-assay (MSI-H, MSI-l, and MSS, p-value < 2×10⁻¹⁶, r2=0.504); thus, justifying the use of MSIsensor.
PD-L1, PD-L2, PD-1, CD8A, and CD8B RPPA expression data were collected from FIREHOSE (January 28, 2016). By cancer type, samples were stratified by MSIsensor score status (Figure 5C), hypermutatator and mutation signatures status (Figure 5D), and hypermutator status alone (Figures S7A–S7C). Significance was calculated using two-sided t-test statistics.
DRUGGABILITY AND CLINICAL ASSOCIATION
PHIAL is a heuristic clinical interpretation algorithm and database of tumor alterations relevant to genomics-driven therapy (TARGET) and was created in 2014 to identify putatively actionable or biologically relevant alterations in patient tumor sequence data. Although it was developed to study patients individually, PHIAL was applied to all 8775 samples that had both SNV/indel and thresholded copy number data available across TCGA MC3 and all 33 individual TCGA studies. PHIAL (1.2.0) using TARGET 1.4.2 and Cosmic v79 was applied to all 8775 samples that had both SNV/indel and thresholded copy number data available across TCGA MC3 and all 33 individual TCGA studies. TARGET contains 50 alteration-therapeutic assertions based on FDA-approved therapies, clinical trials, or published clinical evidence of genetic alteration-therapeutic action relationships which was leveraged by PHIAL to bin variants as putatively actionable, if both the gene and alteration type match an assertion, or biologically relevant, if only the gene matches.
DEPO version 1.0 (Sun et al., in review, http://depo-dinglab.ddns.net) is a manually curated database of single nucleotide polymorphisms or SNPs (missense, frameshift, and nonsense mutations), in-frame insertions and deletions (indels), copy number variations (CNVs), and expression changes that are paired with drug responses. For present purposes, we focused strictly on SNPs and indels. For each variant-drug pair, there is an associated tumor type, an effect (sensitive or resistant), and a level of evidence describing the quality of data supporting the pair at various stages of approval: FDA-approved, clinical trials, case reports, and preclinical. We queried our samples for presence of druggable alterations from DEPO regardless of cancer type. The cancer type that had the highest level of evidence for a drug-variant pair was considered the “on-label” cancer type and all other cancer types were deemed to be “off-label” (Figure S7D). Cancer types containing an off-label variant were still considered to be ‘druggable’ via repurposing.
DATA AND SOFTWARE AVAILABILITY
Algorithms used to create the consensus list
20/20+
20/20+ is a Random Forest machine learning algorithm for predicting oncogenes and tumor suppressor genes from somatic mutations. 20/20+ uses features capturing mutational clustering, evolutionary conservation, predicted functional impact of variants, mutation consequence types, gene interaction network connectivity, and other relevant covariates. 20/20+ version 1.1.0 was run using default parameters, as described previously(Tokheim et al., 2016b), except where the number of simulations was increased to 100,000. We applied gene hold-out cross-validation to perform predictions without over-fitting. Additionally, for cancer type specific predictions, we held out all mutations from the corresponding cancer type in our training set. P-value QQ-plots suggest well-calibrated predictions that are not inflated for false positives and results show substantial overlap with the cancer gene census(Futreal et al., 2004) and curated driver genes(Vogelstein et al., 2013). Genes were deemed significant if either the oncogene, tumor suppressor gene, or driver score had a q-value of less than or equal to 0.05. 20/20+ was also used to categorize the consensus genes as either a oncogene, tumor suppressor gene, or unknown. A “likely” oncogene or tumor suppressor gene was determined using q-value threshold of 0.05, while “possible” status was assigned to the remaining genes with a p-value less than or equal to 0.05.
MutSig2CV
MutSig2CV(Lawrence et al., 2014) analyzes somatic point mutations discovered in DNA sequencing, identifying genes mutated more often than expected by chance given inferred background mutation processes. Genes were deemed significant at a q-value threshold of 0.1. MutSig2CV consists of three independent statistical tests, described briefly below:
Abundance (CV)
The most important step for inferring genes' mutational significance is to properly classify whether the gene is highly mutated relative to some background mutation rate (BMR), which varies on a macroscopic level across patients and genes and on a microscopic level across sequence contexts. MutSig accounts for all three of these aspects, renormalizing BMR on a per-gene, -patient, and -context level.
Clustering (CL)
Genes often harbor mutational hotspots, specific sites that are frequently mutated. While abundance calculations bin mutations on the gene level, clustering bins mutations on the local site level, which allows MutSig to differentiate between genes with uniformly distributed mutations and genes with localized hotspots, assigning higher significance to the latter.
Conservation (FN)
MutSig uses evolutionary conservation as a proxy for determining the functional significance of a mutated site. It assumes that genetic sites highly conserved across vertebrates have greater functional significance than weakly conserved sites. MutSig assigns a higher significance to genes that experience frequent mutations in highly conserved sites.
MuSiC2
MuSiC2(Dees et al., 2012) version 0.2 is a frequency based tool used to identify significantly mutated genes. Significance is determined by comparing a calculated background mutation frequency to a convolution for specific transition, transversion, and CpG variants. Default parameters were used for initial SMG identification. A recent update to MuSiC2 provides a long gene filter, which seeks to remove false positives by virtue of finding genes whose elevated mutation tallies are due primarily to their larger size rather than their mutational significance. Briefly, it systematically tightens the p-value threshold for longer genes (>5000nt) based on a table test of uncoupling gene status (significant versus not significant) from gene size (long gene versus typical-size gene).
OncodriveCLUST
OncodriveCLUST(Tamborero et al., 2013a) identifies genes with non-silent mutations that cluster together in protein sequence more than expected based on a background distribution of synonymous mutations. OncodriveCLUST was run through a local installation of IntOGen pipeline (available at https://bitbucket.org/intogen/intogen-pipeline). Different minimum mutation thresholds were set manually, according to the mutation burden of the different cancer types: 3 (in ACC, CHOL, DLBC, ESCA, GBM, KICH, KIRC, KIRP, LGG, MESO, PAAD, PCPG, PRAD, READ, SARC and THYM), 5 (in BRCA, CESC, COAD, LAML, LIHC, OV, TGCT, THCA, UCS, UVM and the PANCANCER run), 7 (in HNSC, SKCM and STAD), 10 (in BLCA) and 12 (in LUAD, LUSC and UCEC). Next, we applied a custom expression filter in each cancer type by filtering out genes whose median expression level was lower than 6 log2 RSEM in that particular cancer type. Genes were found significant at a q-value threshold of 0.05.
OncodriveFML
OncodriveFML(Mularoni et al., 2016) identifies genes that have greater accumulation of mutations that have higher predicted function impact (functional impact bias). The predicted impacts of mutations were scored using CADD(Kircher et al., 2014). The mean CADD score for mutations was compared to permuted mutations within the same gene to calculate an empirical p-value. The results have been calculated considering all the observed mutations in CDS regions. CDS regions were extracted from Gencode release 19 (https://www.gencodegenes.org/releases/19.html). The annotations include all CDS where both the "gene_type" and the "transcript_type" were tagged as "protein_coding". The analysis was performed using OncodriveFML version 1.0.2-alpha with the coding indels option specified. The configuration file contained the default parameters with the following exceptions (https://bitbucket.org/bbglab/oncodrivefml/downloads/PanCanAtlas.conf). Genes were deemed significant at a q-value of 0.25.
ActiveDriver
ActiveDriver detects genes that are enriched in somatic mutations located in post-translationally modified sites, such as phosphorylation, acetylation, or ubiquitination sites. It identifies driver genes using a logistic regression that takes into account, among other factors, the position of the PTM sites and the distribution of the mutations(Reimand and Bader, 2013). ActiveDriver (v0.010, default parameter) was run using the database ActiveDriver_HG38. Due to high mean log fold change (MLFC) values, genes were deemed significant at a q-value of 0.0001.
e-Driver
This algorithm identifies protein regions that are enriched in somatic missense mutations using a binomial test and assuming mutations are distributed randomly across the protein. The protein regions can be linear(Porta-Pardo and Godzik, 2014) or three-dimensional(Porta-Pardo et al., 2015). The current analysis uses PFAM domains(Finn et al., 2016) and disordered regions predicted by Foldindex(Prilusky et al., 2005) for the linear analysis. We used the regions described in: https://github.com/eduardporta/e-Driver/bioinformatics_paper/features_human_genome.txt
CompositeDriver
We have developed CompositeDriver v0.1 (https://github.com/khuranalab/CompositeDriver), a novel computational method considering both mutation recurrence and functional impact of mutations to identify signals of positive selection. For all mutations within a gene’s protein coding region, a composite score was calculated through summation of mutation recurrence multiplied by the functional impact score(Jagadeesh et al., 2016). For each gene, a p-value was computed by testing whether the observed composite score is significantly higher than the null distribution. To build the null distribution from the background, the same numbers of mutated positions were repeatedly drawn (default is 105 times) from other protein coding regions of similar replication timing and similar mutation context(Alexandrov et al., 2013). The Benjamini-Hochberg method for multiple hypothesis correction and q value cut-off of 0.05 was used.
Population-based sequence algorithms
VEST
VEST (Variant Effect Scoring Tool) is a machine learning method that predicts the functional significance of missense mutations observed through genome sequencing, allowing mutations to be prioritized in subsequent functional studies based on the probability that they impair protein activity(Carter et al., 2013; Douville et al., 2016). VEST version 3.0 scores were retrieved from the CRAVAT web server (v4.3)(Douville et al., 2013).
MutationAssessor
MutationAssessor(Reva et al., 2011) uses residue conservation across species to identify the impact of non-synonymous mutations. Scores were obtained using the precompiled database ljb26_all from ANNOVAR v20150322 (Wang et al., 2010).
PolyPhen2
Polymorphism Phenotyping v2 (PolyPhen2)(Adzhubei et al., 2013) is a machine learning approach that computes the functional impact of missense mutations. The method uses sequence-based and structure-based features to train a naïve Bayes classifier. Scores were obtained using the precompiled database ljb26_all from ANNOVAR(Wang et al., 2010).
SIFT
Sorting Intolerant from Tolerant (SIFT) SIFT(Ng and Henikoff, 2002) predicts the functional impact of missense mutations using sequence homology. Scores were obtained using the precompiled database ljb26_all from ANNOVAR v20150322 (Wang et al., 2010).
Cancer-focused algorithms
CHASM
CHASM (Cancer-specific High-throughput Annotation of Somatic Mutations) is a machine learning method that predicts the functional significance of somatic missense mutations observed in the genomes of cancer cells, allowing mutations to be prioritized in subsequent functional studies, based on the probability that they give the cells a selective survival advantage(Carter et al., 2009). CHASM scores (precompute version 3.0) were retrieved from the CRAVAT web server (v4.3)(Douville et al., 2013).
CanDrA
CanDrA(Mao et al., 2013) is a machine learning program that predicts cancer-type specific driver missense mutations based on 96 structural, evolutionary and gene features computed by over 10 other functional prediction algorithms such as CHASM, SIFT, and MutationAssessor. CanDrA used COSMIC, TCGA, and CCLE data for training and is heavily optimized to perform cancer-type specific driver mutation analysis(Chen et al., 2016). If a mutation appeared more than once, the maximum CanDrA score was taken. In this work, the CanDra “plus” version was run under default parameters using the “general” cancer type database.
fathmm
Functional Analysis Through Hidden Markov Models (fathmm)(Shihab et al., 2013) uses Hidden Markov modeling to represent the protein domain shared across human proteins and to estimate the functional impact of mutations. Using cancer-associated polymorphisms from CanProVar and putative neutral polymorphisms from UniProt, fathmm prioritizes mutations that are associated with cancer versus those that simply impact the function of a protein. Scores were obtained using the precompiled database FATHMM cancer v2.3 (http://fathmm.biocompute.org.uk/database/fathmm.v2.3.SQL.gz).
transFIC
Transformed Functional Impact score for Cancer (transFIC)(Gonzalez-Perez et al., 2012) assesses the functional impact of tumor non-synonymous SNVs by accounting for baseline tolerance of functional variants in relation to genes. This is performed by grouping genes by ontologies and assessing the tolerance of gene sets using functional scores provided by SIFT, PolyPhen2, and MutationAssessor. By transforming scores based specific ontologies in cancer datasets, modified transFIC scores outperformed original scores generated by other cancer specific tools. transFIC (v1.0, default parameters) was run using the gosmf database and applied to MutationAssessor predictions.
Structure-based algorithms
HotMAPS
Hotspot Missense mutation Areas in Protein Structures (HotMAPS)(Tokheim et al., 2016a) detects somatic mutation hotspot regions in 3D protein structures residing within a single protein chain or spanning protein chains (https://github.com/KarchinLab/HotMAPS, v1.1.3). Protein structures were obtained from the Protein Data Bank (PDB) and homology models from the ModPipe human 2013 data set (ftp://salilab.org/databases/modbase/projects/genomes/H_sapiens/2013/), built with Modeller 9.11(Pieper et al., 2011). Missense mutations were mapped to each protein structure or homology model using the MySQL database of Mutation position imaging toolbox (MuPIT)(Niknafs et al., 2013). The preferred biological assembly from MuPIT was used when multiple biological assemblies were available for a protein structure. HotMAPS calculates a p-value for missense mutated residues containing a higher than expected density of missense mutations. Multiple hypothesis testing correction was performed using the Benjamini-Hochberg approach, and the significance threshold was set at a q-value of 0.01.
HotSpot3D
HotSpot3D(Niu et al., 2016) is a suite of algorithms (https://github.com/ding-lab/hotspot3d) that identifies spatial mutation clusters on 3D protein structures. For this manuscript, we used version 1.4.1. A pairwise distance measure is calculated for nearest-atoms/average-amino-acid on protein structure. Networks are then built by properly linking pairwise distances to corresponding mutations. Initialized by the distance matrix of the edges, clusters are constructed using the Floyd–Warshall shortest-paths algorithm to obtain the geodesics. We weighted this algorithm to bias centroid sections toward frequently mutated missense mutations. Finally, a closeness-centrality measure, or the sum of centralities over each mutation in a cluster, was used to describe features in the genes we identified here. For this study we used the following cutoffs: For intra-molecular clusters: 1) no linear amino-acid chain distance cutoff was enforced, 2) pairwise distances were calculated using the average amino-acid structure difference, 3) only mutation pairs with protein specific p-values less than 0.05, and 4) the maximum network radius was 10 Angstroms. For inter-molecular clusters: 1) no linear amino-acid chain distance cutoff was enforced, 2) pairwise distances were calculated using the average amino-acid structure difference, 3) only mutation pairs with protein specific p-values less than 0.05, and 4) the maximum network radius was 20 Angstroms.
3DHotSpots.org
The algorithm behind 3DHotspots.org identifies statistically significant clusters of missense cancer mutations in 3D structures(Gao et al., 2017). Missense mutations were mapped to 3D protein structures using G2S web services (http://g2s.genomenexus.org) (March 2017). Only alignments with a sequence identity of 90% or above were included. The contact map of each structure chain was then calculated. Two residues with any pair of atoms within 5 angstroms (Å) were considered in contact. A 3D cluster is defined by a central residue and at least one contact neighbor residue. A 3D cluster is identified as significantly mutated if its residues were more frequently mutated than expected by chance, as determined by a permutation-based test. Details of the methodology and the tool are available at https://github.com/knowledgesystems/mutationhotspots. Version 1.0.1 with default parameters was used in this analysis.
e-Driver3D
This algorithm identifies protein regions that are enriched in somatic missense mutations using a binomial test and assuming mutations are distributed randomly across the protein. The three-dimensional analysis is based on a library of protein interaction interfaces extracted from the Protein Data Bank30. The interaction interfaces are defined for each pair of protein chains in each PDB coordinates file as all the residues of a chain with a carbon atom within 5 angstroms of a carbon atom of the other chain. We used the interfaces described in https://github.com/eduardporta/e-Driver/interfaces_human_genome.txt
Additional algorithms
DriverNET
DriverNet(Bashashati et al., 2012) is a package to predict functional important driver genes in cancer by integrating genome data (non-synonymous SNVs, indels, and copy number alteration) and transcriptome data (gene expression data). The different data types are integrated using an influence graph(Wu et al., 2010). We ran DriverNet (v1.6.0, numberOfRandomTests=500, weight=FALSE, purturbGraph=FALSE, purturbData=TRUE) and genes with q-value of 0.05 were deemed significant.
OncoIMPACT
OncoIMPACT(Bertrand et al., 2015) is a model-driven approach to integrate omics profiles (genomics and transcriptomics) and provides patient-specific cancer driver gene predictions. It uses a gene interaction network to associate mutations (non-synonymous SNVs, indels and copy number alterations) with transcriptomic changes(Wu et al., 2010). We measured the transcriptomic change of each patient as the log2 fold change of the patient gene expression value with the cancer type median gene expression value. OncoIMPACT (v0.9.4) was ran using default parameters. The top 50 predicted genes were used for the consensus gene list building.
MSIsensor
Written in C++, MSIsensor (version 0.2) is an algorithm that distinguishes microsatellite instable (MSI) tumors from microsatellite stable (MSS) samples based on tumor/normal sequence data(Niu et al., 2013). Homopolymer regions of 5 or more nucleotides in length are aggregated separately in tumor/normal pairs and compared using a χ2 statistic. MSI-high was calculated as an MSI score ≥ 4. Parameters for running MSIsensor “msi” command are as follows: −l (minimal homopolymer size) = 1 and −q (minimal microsatellite size) = 1. These settings are not minimal number of repeats, but rather the minimal number of nucleotides to consider within the repeat.
Supplementary Material
Figure S1: MAF Filtering and Power comparison. Related to Figure 1. (A) Overall schema showing how we used the different algorithms and the input from the literature to identify our cancer driver gene consensus list and the driver mutations. (B) Fraction of samples filtered through three quality assurance filters: a mutation call filter, hypermutated samples, and samples excluded by pathology review. Numbers above bars indicate the number of samples completely dropped. N refers to the total samples before filtering. (C) Statistical power analysis for detection of driver genes at defined fraction of tumor samples above the background mutation rate (effect size). Circles indicate each of 12 cancer types or all cancer types together (“PANCAN”) from the original TCGA analysis of 12 cancer types (PanCan-12) placed according to the study sample size and median background mutation rate across samples.
Figure S2: Consensus Gene scores and SMG filtering. Related to Figure 1 and Figure 2. (A) Left, outlier detection was performed on a per analysis and method basis. Outliers were marked (red) based on the quasi-majority of three criteria: (1) low concordance with known cancer genes from Vogelstein et al (lower than median); (2) high divergence of p-value distribution from theoretical expectation (higher than median); and (3) abnormally high number of significant genes (>1.5× the interquartile range above the third quartile). The first two criteria were assessed based on the other tools within a single analysis, while the third criterion was assessed based on the same tool’s results over all the individual cancer types (excluding the PanCancer analysis). Right, example calculation of the gene consensus score for ARID1A in the cancer type LIHC. A result from an outlier is down weighted, receiving a weight of 0.5 instead of 1.0. The gene consensus score is the sum of weights for tools finding that gene as significant. (B) Overlap of consensus gene list with prior TCGA marker papers. (C) Likely false positives were detected with a high Linear Discriminant Analysis (LDA) score threshold representing 90% sensitivity for keeping associations found in Cancer Gene Census genes. LDA was trained to distinguish common false positives in exome sequencing from previous TCGA PanCancer marker papers. The LDA threshold was only applied to the potential source of false positive genes. (D) Fraction of marker paper genes highlighted in the main text that were also found in our consensus gene list. (E) Fraction of our consensus gene list found in previous TCGA marker papers. (F) Fraction of associations found in the Cancer Gene Census (CGC) that were either found only in the consensus gene list or TCGA marker paper. (G) Four heatmaps indicate the relationship between algorithms used in driver gene discovery for 4 cancer types GBM, LIHC, OV, UCEC (left to right). Pairwise Pearson 2-tailed correlation coefficients were calculated from driver prediction p-values generated by each tool and in each cancer type. Strength of the correlation coefficient (R) is displayed in colors ranging from yellow (strong) to blue (weak).
Figure S3: Characteristics of consensus genes. Related to Figure 2. (A) Predictive power of each individual driver gene detection method (in gray) and of the weighted and weighted scores (in orange). The predictive power was measured as prAUC, using all the genes in the Cancer Gene Census and a set that additionally excludes Cancer Genome Landscape genes used in outlier detection. Error bars, calculated by bootstrapping, indicate one standard deviation. (B) The number of consensus genes in each cancer type positively correlated with the average mutation burden. Shaded area indicates 95% bootstrapped confidence interval. (C) Given the variability in powered effect size (fraction of mutated samples above background with 90% power) in this study, there is a negative but not significant correlation with the number of consensus genes in each cancer type. COAD and READ were excluded because analysis was performed separately, but the final consensus genes were merged. (D) Pearson correlation between the number driver genes identified and median purity was calculated and plotted. (E) Pearson correlation between the number driver genes identified and mean purity was calculated and plotted. Summary statistics for p-value and r-squared value are reported in the top right corner of panels D and E. (F) Percent of samples containing a non-silent mutation stratified by cancer type. The red line indicates the median across cancer types (left) and average number of non-silent mutations in consensus genes per sample (right). (G) Pie chart showing percent of consensus genes which are found in the Cancer Gene Census with annotations for small somatic mutations (missense, splice site, indel, and nonsense) (H) Consensus genes showed a higher probability for loss-of-function intolerance and missense mutation constraint of germline mutations based on ExAC(Lek et al., 2016) and were expressed (RPKM>1) in a wider number of tissues from GTeX (version 6) (Consortium, 2015). Given the high correlation of gene expression in the 11 brain regions assessed from GTEx, we took the median of multiple brain tissues, as done in Lek et al., 2016.
Figure S4: Molecular properties of cancer driver genes. Related to Figure 2: (A) Hierarchical clustering of the gene consensus scores for genes that were found in more than one cancer type. The correlation distance metric and average linkage was used. Each gene cluster was tested for enrichment in three groups of cancer types, in order: Pan-squamous (BLCA, CESC, LUSC, HNSC, and ESCA), Pan-gynecological (UCEC, UCS, CESC, OV, and BRCA), and Pan-gastrointestinal (STAD, COADREAD, ESCA, and PAAD). Significant gene clusters are based on a permutation test assessing the total gene consensus score (10,000 iterations) and are progressively colored gray (not significant), blue (Adjusted P<0.05), green (Adjusted P < 0.01), and red (Adjusted P < 0.001). P values were multiple test corrected across all genes using the Benjamini-Hochberg FDR method. Gene clusters are shown as distinct colors in the first column of the row annotation bar. Clusters of genes were defined based on cutting the dendrogram at a depth chosen by manual inspection. (B) Percentage of consensus genes predicted as either oncogene (brown), tumor suppressor gene (green), or unknown (gray) by the 20/20+ algorithm, an improved version of the 20/20 rule(Vogelstein et al., 2013). The 20/20+ algorithm uses a supervised-learning approach (random forests) and bases predictions on the mutational patterns observed within a gene. “Likely” and “Possible” statuses were determined at a threshold of 0.05 for q-value (Benjamini-Hochberg method) and p-value, respectively. Consensus genes were designated as “Unknown” if they did not meet these thresholds. N represents the number of significant genes in each cancer type.
Figure S5: Characteristics and implementation of driver mutation analysis. Related to Figure 3. Eight sequence-based tools scored missense mutations to prioritize likely driver mutations over passenger mutations. (A) The absolute Spearman correlation between different sequence-based tools is shown, where tools are arranged in order by hierarchical clustering using a Euclidean distance metric. Tools that distinguish pathogenic missense mutations from neutral polymorphisms are labeled “population-based” (red), while tools focused on distinguishing passenger somatic missense mutations from cancer drivers are colored blue. A consensus score (named Combined Tool Adjusted Total—CTAT) for the “population-based” tools and “cancer-focused” tools was developed. (B) Receiver operator curves (ROC) compared CTAT-population and CTAT-cancer scores to 8 sequence-based tools. We used OncoKB annotation of “Oncogenic” and “Likely Oncogenic” vs. all other missense mutations in consensus genes as a benchmark. Area under the curve (AUC) calculations are presented for each of the individual 8 sequence-based tools and two sequence-based consensus approaches. We determined the optimal score threshold based on balanced accuracy (red dashed line) for (C) CTAT-population (left) and CTAT-cancer (right). Missense mutation hotspots were also detected based on four structural tools that utilize three-dimensional protein structures. (D) The percentage of missense mutations labeled as “Oncogenic” or “Likely Oncogenic” in OncoKB steadily increased with greater number of structural tools, indicating an amino acid residue was a hotspot. (E) Fraction of unique missense mutations in this study either in or not in the OncoKB, which is stratified by the number of mutation-level approaches in agreement (Population-based, Cancer-focused, and Structural clustering). The gray line separates where mutations were found in our consensus gene list (not found, manually rescued, or official).
Figure S6: Relationship between hypermutated samples and immune-system markers. Related to Figure 5. RNA-Seq abundance of different immune biomarkers for MSI phenotypes defined by MSIsensor. Stars indicate significance levels from a two-sided t-test to calculate p-values (* < 0.05, ** < 0.01, *** < 0.001) for BRCA (A), CESC (B) and LUSC (C).
Figure S7: On-label/off-label calculations for druggable mutations in cancer. Related to Figure 6: Missense mutations from consensus gene calling were annotated using the DEPO database. Here the proportion of samples in a cancer type (x-axis) with on-label (blue) or off-label (red) therapeutic options are provided for specific missense mutations (y-axis). Briefly, on-label refers to mutation specific treatments that have been clinically tested for a given cancer type. Off-label designations refer to potential drug therapies not heavily tested for said cancer types. Only druggable mutations present in the largest number of tumor samples across the TCGA cohort are displayed.
Table S1: Final gene consensus list. Related to Figure 2.
Table S2: Biological processes and pathways associated with each driver gene. Related to Figure 2.
Table S3: Overlap between our consensus driver gene list and recent publications. Related to Figure 2.
Table S4: Mutations shared by all three structural level tools. Related to Figure 3 and Figure 4.
Table S5: Hypermutator samples and MSI and MMR genes frequencies. Related to Figure 5.
Table S6: Samples removed by filtering criteria. Related to Figure 1.
Table S7: Genes used to train LDA. Related to Figure S2.
Highlights.
PanSoftware applied to PanCancer data identified 299 cancer driver genes
Driver genes and mutations are shared across anatomical origins and cell types
In-silico discovery of ~3,400 driver mutations coupled with experimental validation
57% of tumors harbor potentially actionable oncogenic events
Significance.
The Cancer Genome Atlas’ PanCancer Atlas Drivers/Essentiality group collectively analyzed mutation-level data from 9,423 tumor exomes across 33 cancer types. This represents one of the largest cancer genomic datasets to date. We carefully integrated results from 26 different software packages to describe both gene- and mutation-level findings (299 cancer driver genes and 3,442 driver mutations) and provide experimental evidence validating their functional relevance to tumorigenesis. We identified groups of cancer driver genes shared across pan-squamous, pan-gynecological, and pan-gastrointestinal tumors. Compared to the previous TCGA PanCancer study, we identified 59 novel driver genes across different cancers. Finally, based on our analysis, 57% of the tumor samples carry at least one potentially clinically actionable event.
Acknowledgments
Funding: U54 HG003273, U54 HG003067, U54 HG003079, U24 CA143799, U24 CA143835, U24 CA143840, U24 CA143843, U24 CA143845, U24 CA143848, U24 CA143858, U24 CA143866, U24 CA143867, U24 CA143882, U24 CA143883, U24 CA144025, P30 CA016672, BP 2016-00296 (AGAUR), U24 CA211006
Appendix
The members of The Cancer Genome Atlas Research Network for this project are:
NCI/NHGRI Project Team
Samantha J. Caesar-Johnson, John A. Demchok, Ina Felau, Melpomeni Kasapi, Martin L. Ferguson, Carolyn M. Hutter, Heidi J. Sofia, Roy Tarnuzzer, Zhining Wang, Liming Yang, Jean C. Zenklusen, Jiashan (Julia) Zhang
TCGA DCC
Sudha Chudamani, Jia Liu, Laxmi Lolla, Rashi Naresh, Todd Pihl, Qiang Sun, Yunhu Wan, Ye Wu
Genome Data Analysis Centers (GDACs)
The Broad Institute
Juok Cho, Timothy DeFreitas, Scott Frazer, Nils Gehlenborg, Gad Getz, David I. Heiman, Jaegil Kim, Michael S. Lawrence, Pei Lin, Sam Meier, Michael S. Noble, Gordon Saksena, Doug Voet, Hailei Zhang
Institute for Systems Biology
Brady Bernard, Nyasha Chambwe, Varsha Dhankani, Theo Knijnenburg, Roger Kramer, Kalle Leinonen, Yuexin Liu, Michael Miller, Sheila Reynolds, Ilya Shmulevich, Vesteinn Thorsson, Wei Zhang
MD Anderson Cancer Center
Rehan Akbani, Bradley M. Broom, Apurva M. Hegde, Zhenlin Ju, Rupa S. Kanchi, Anil Korkut, Jun Li, Han Liang, Shiyun Ling, Wenbin Liu, Yiling Lu, Gordon B. Mills, Kwok-Shing Ng, Arvind Rao, Michael Ryan, Jing Wang, John N. Weinstein, Jiexin Zhang
Memorial Sloan Kettering Cancer Center
Adam Abeshouse, Joshua Armenia, Debyani Chakravarty, Walid K. Chatila, Ino de Bruijn, Jianjiong Gao, Benjamin E. Gross, Zachary J. Heins, Ritika Kundra, Konnor La, Marc Ladanyi, Augustin Luna, Moriah G. Nissan, Angelica Ochoa, Sarah M. Phillips, Ed Reznik, Francisco Sanchez-Vega, Chris Sander, Nikolaus Schultz, Robert Sheridan, S. Onur Sumer, Yichao Sun, Yichao Sun, Barry S. Taylor, Jioajiao Wang, Hongxin Zhang
Oregon Health and Science University
Pavana Anur, Myron Peto, Paul Spellman
University of California Santa Cruz
Christopher Benz, Joshua M. Stuart, Christopher K. Wong, Christina Yau
University of North Carolina at Chapel Hill
D. Neil Hayes, Joel S. Parker, Matthew D. Wilkerson
Genome Characterization Centers (GCC)
BC Cancer Agency
Adrian Ally, Miruna Balasundaram, Reanne Bowlby, Denise Brooks, Rebecca Carlsen, Eric Chuah, Noreen Dhalla, Robert Holt, Steven J.M. Jones, Katayoon Kasaian, Darlene Lee, Yussanne Ma, Marco A. Marra, Michael Mayo, Richard A. Moore, Andrew J. Mungall, Karen Mungall, A. Gordon Robertson, Sara Sadeghi, Jacqueline E. Schein, Payal Sipahimalani, Angela Tam, Nina Thiessen, Kane Tse, Tina Wong
The Broad Institute
Ashton C. Berger, Rameen Beroukhim, Andrew D. Cherniack, Carrie Cibulskis, Stacey B. Gabriel, Galen F. Gao, Gavin Ha, Matthew Meyerson, Gordon Saksena, Steven E. Schumacher, Juliann Shih
Harvard
Melanie H. Kucherlapati, Raju S. Kucherlapati
Johns Hopkins
Stephen Baylin, Leslie Cope, Ludmila Danilova
University of Southern California
Moiz S. Bootwalla, Phillip H. Lai, Dennis T. Maglinte, David J. Van Den Berg, Daniel J. Weisenberger
University of North Carolina at Chapel Hill
J. Todd Auman, Saianand Balu, Tom Bodenheimer, Cheng Fan, D. Neil Hayes, Katherine A. Hoadley, Alan P. Hoyle, Stuart R. Jefferys, Corbin D. Jones, Shaowu Meng, Piotr A. Mieczkowski, Lisle E. Mose, Joel S. Parker, Amy H. Perou, Charles M. Perou, Jeffrey Roach, Yan Shi, Janae V. Simons, Tara Skelly, Matthew G. Soloway, Donghui Tan, Umadevi Veluvolu, Matthew D. Wilkerson
Van Andel Research Institute
Huihui Fan, Toshinori Hinoue, Peter W. Laird, Hui Shen, Wanding Zhou
Genome Sequencing Centers (GSC)
Baylor College of Medicine
Michelle Bellair, Kyle Chang, Kyle Covington, Chad J. Creighton, Huyen Dinh, HarshaVardhan Doddapaneni, Lawrence A. Donehower, Jennifer Drummond, Richard A. Gibbs, Robert Glenn, Walker Hale, Yi Han, Jianhong Hu, Viktoriya Korchina, Sandra Lee, Lora Lewis, Wei Li, Xiuping Liu, Margaret Morgan, Donna Morton, Donna Muzny, Jireh Santibanez, Margi Sheth, Eve Shinbrot, Linghua Wang, Min Wang, David A. Wheeler, Liu Xi, Fengmei Zhao
The Broad Institute
Carrie Cibulskis, Stacy B. Gabriel, Julian Hess
Washington University at St. Louis
Elizabeth L. Appelbaum, Matthew Bailey, Matthew G. Cordes, Li Ding, Catrina C. Fronick, Lucinda A. Fulton, Robert S. Fulton, Cyriac Kandoth, Elaine R. Mardis, Michael D. McLellan, Christopher A. Miller, Heather K. Schmidt, Richard K. Wilson
Bio specimen Core Resource
The International Genomics Consortium
Daniel Crain, Erin Curley, Johanna Gardner, Kevin Lau, David Mallery, Scott Morris, Joseph Paulauskis, Robert Penny, Candace Shelton, Troy Shelton, Mark Sherman, Eric Thompson, Peggy Yena
Nationwide Children’s Organization
Jay Bowen, Julie M. Gastier-Foster, Mark Gerken, Kristen M. Leraas, Tara M. Lichtenberg, Nilsa C. Ramirez, Lisa Wise, Erik Zmuda
Tissue Source Sites
Australian Prostate Cancer Research Center
Niall Corcoran, Tony Costello, Christopher Hovens
Barretos Cancer Hospital
Andre L. Carvalho, Ana C. de Carvalho, José H. Fregnani, Adhemar Longatto-Filho, Rui M. Reis, Cristovam Scapulatempo-Neto, Henrique C. S. Silveira, Daniel O. Vidal
Barrow Neurological Institute
Andrew Burnette, Jennifer Eschbacher, Beth Hermes, Ardene Noss, Rosy Singh
Baylor College of Medicine
Matthew L. Anderson, Patricia D. Castro, Michael Ittmann
BC Cancer Agency
David Huntsman
BioreclamationIVT
Bernard Kohl, Xuan Le, Richard Thorp
Boston Medical Center
Chris Andry, Elizabeth R. Duffy
Botkin Hospital
Vladimir Lyadov, Oxana Paklina, Galiya Setdikova, Alexey Shabunin, Mikhail Tavobilov
Brain Tumor Center at the University of Cincinnati Gardner Neuroscience Institute
Christopher McPherson, Ronald Warnick
Brigham and Women's Hospital
Ross Berkowitz, Daniel Cramer, Colleen Feltmate, Neil Horowitz, Adam Kibel, Michael Muto, Chandrajit P. Raut
Capital Biosciences, Inc
Andrei Malykh
Case Comprehensive Cancer Center
Jill S. Barnholtz-Sloan, Wendi Barrett, Karen Devine, Jordonna Fulop, Quinn T. Ostrom, Kristen Shimmel, Yingli Wolinsky
Case Western Reserve School of Medicine
Andrew E. Sloan
Catholic University of the Sacred Heart
Agostino De Rose, Felice Giuliante
Cedars-Sinai Medical Center
Marc Goodman, Beth Y. Karlan
Central Arkansas Veterans Healthcare System
Curt H. Hagedorn
Centura Health
John Eckman, Jodi Harr, Jerome Myers, Kelinda Tucker, Leigh Anne Zach
Chan Soon-Shiong Institute of Molecular Medicine at Windber
Brenda Deyarmin, Hai Hu, Leonid Kvecher, Caroline Larson, Richard J. Mural, Stella Somiari
Charles University
Ales Vicha, Tomas Zelinka
Christiana Care Health System
Joseph Bennett, Mary Iacocca, Brenda Rabeno, Patricia Swanson
CHU of Montreal
Mathieu Latour
CHU of Quebec
Louis Lacombe, Bernard Têtu
CHU of Quebec, Laval University Research Center of Chus
Alain Bergeron
Cleveland Clinic Foundation
Mary McGraw, Susan M. Staugaitis
Columbia University
John Chabot, Hanina Hibshoosh, Antonia Sepulveda, Tao Su, Timothy Wang
Cureline, Inc
Olga Potapova, Olga Voronina
Curie Institute
Laurence Desjardins, Odette Mariani, Sergio Roman-Roman, Xavier Sastre, Marc-Henri Stern
Dana-Farber Cancer Institute
Feixiong Cheng, Sabina Signoretti
Dignity Health Mercy Gilbert Medical Center
Jennifer Eschbacher
Duke University Medical Center
Andrew Berchuck, Darell Bigner, Eric Lipp, Jeffrey Marks, Shannon McCall, Roger McLendon, Angeles Secord, Alexis Sharp
Emory University
Madhusmita Behera, Daniel J. Brat, Amy Chen, Keith Delman, Seth Force, Fadlo Khuri, Fadlo Khuri, Kelly Magliocca, Shishir Maithel, Jeffrey J. Olson, Taofeek Owonikoko, Alan Pickens, Suresh Ramalingam, Dong M. Shin, Gabriel Sica, Gabriel Sica, Erwin G. Van Meir, Erwin G. Van Meir, Hongzheng Zhang
Erasmus Medical Center
Wil Eijckenboom, Ad Gillis, Esther Korpershoek, Leendert Looijenga, Wolter Oosterhuis, Hans Stoop, Kim E. van Kessel, Ellen C. Zwarthoff
Foundation of the Carlo Besta Neurological Institute, IRCCS
Chiara Calatozzolo, Lucia Cuppini, Stefania Cuzzubbo, Francesco DiMeco, Gaetano Finocchiaro, Luca Mattei, Alessandro Perin, Bianca Pollo
Fred Hutchinson Cancer Research Center
Chu Chen, John Houck, Pawadee Lohavanichbutr
Friedrich-Alexander-University
Arndt Hartmann, Christine Stoehr, Robert Stoehr, Helge Taubert, Sven Wach, Bernd Wullich
Greater Poland Cancer Center
Witold Kycler, Dawid Murawa, Maciej Wiznerowicz
Greenville Health System Institute for Translational Oncology Research
Ki Chung, W. Jeffrey Edenfield, Julie Martin
Gustave Roussy institute
Eric Baudin
Harvard University
Glenn Bubley, Raphael Bueno, Assunta De Rienzo, William G. Richards
Henry Ford Health System
Ana deCarvalho, Steven Kalkanis, Tom Mikkelsen, Tom Mikkelsen, Houtan Noushmehr, Lisa Scarpace
Hospices Civils de Lyon
Nicolas Girard
Hospital Clinic
Marta Aymerich, Elias Campo, Eva Giné, Armando López Guillermo
Hue Central Hospital
Nguyen Van Bang, Phan Thi Hanh, Bui Duc Phu
Human Tissue Resource Network
Yufang Tang
Huntsman Cancer Institute
Howard Colman, Kimberley Evason
Icahn School of Medicine at Mount Sinai
Peter R. Dottino, John A. Martignetti
Imperial College London
Hani Gabra
Indivumed GmbH
Hartmut Juhl
Institute of Human Virology Nigeria
Teniola Akeredolu
Institute of Urgent Medicine
Serghei Stepa
John Wayne Cancer Institute
Dave Hoon
Keimyung University
Keunsoo Ahn, Koo Jeong Kang
Ludwich Maximilians University Munich
Felix Beuschlein
Maine Medical Center
Anne Breggia
Massachusetts General Hospital
Michael Birrer
Mayo Clinic
Debra Bell, Mitesh Borad, Alan H. Bryce, Erik Castle, Vishal Chandan, John Cheville, John A. Copland, Michael Farnell, Thomas Flotte, Nasra Giama, Thai Ho, Michael Kendrick, Jean-Pierre Kocher, Karla Kopp, Catherine Moser, David Nagorney, Daniel O'Brien, Brian Patrick O'Neill, Tushar Patel, Gloria Petersen, Gloria Petersen, Florencia Que, Michael Rivera, Lewis Roberts, Robert Smallridge, Robert Smallridge, Thomas Smyrk, Thomas Smyrk, Melissa Stanton, R. Houston Thompson, Michael Torbenson, Ju Dong Yang, Lizhi Zhang, Lizhi Zhang
McGill University Health Center
Fadi Brimo
MD Anderson Cancer Center
Jaffer A. Ajani, Ana Maria Angulo Gonzalez, Carmen Behrens, Jolanta Bondaruk, Russell Broaddus, Bradley Broom, Bogdan Czerniak, Bita Esmaeli, Junya Fujimoto, Jeffrey Gershenwald, Charles Guo, Alexander J. Lazar, Christopher Logothetis, Funda Meric-Bernstam, Funda Meric-Bernstam, Cesar Moran, Lois Ramondetta, David Rice, Anil Sood, Pheroze Tamboli, Timothy Thompson, Patricia Troncoso, Patricia Troncoso, Anne Tsao, Ignacio Wistuba
Melanoma Institute Australia
Candace Carter, Lauren Haydu, Peter Hersey, Valerie Jakrot, Hojabr Kakavand, Richard Kefford, Kenneth Lee, Georgina Long, Graham Mann, Michael Quinn, Robyn Saw, Richard Scolyer, Kerwin Shannon, Andrew Spillane, Jonathan Stretch, Maria Synott, John Thompson, James Wilmott
Memorial Sloan Kettering Cancer Center
Hikmat Al-Ahmadie, Timothy A. Chan, Ronald Ghossein, Anuradha Gopalan, Douglas A. Levine, Victor Reuter, Samuel Singer, Bhuvanesh Singh
Ministry of Health of Vietnam
Nguyen Viet Tien
Molecular Response
Thomas Broudy, Cyrus Mirsaidi, Praveen Nair
Nancy N. and J.C. Lewis Cancer & Research Pavilion at St. Joseph's/Candler
Paul Drwiega, Judy Miller, Jennifer Smith, Howard Zaren
National Cancer Center Korea
Joong-Won Park
National Cancer Hospital of Vietnam
Nguyen Phi Hung
National Cancer Institute
Electron Kebebew, W. Marston Linehan, Adam R. Metwalli, Karel Pacak, Peter A. Pinto, Mark Schiffman, Laura S. Schmidt, Cathy D. Vocke, Nicolas Wentzensen, Robert Worrell, Hannah Yang
Norfolk & Norwich University Hospital
Marc Moncrieff
NYU Langone Medical Center
Chandra Goparaju, Jonathan Melamed, Harvey Pass
Oncology Institute
Natalia Botnariuc, Irina Caraman, Mircea Cernat, Inga Chemencedji, Adrian Clipca, Serghei Doruc, Ghenadie Gorincioi, Sergiu Mura, Maria Pirtac, Irina Stancul, Diana Tcaciuc
Ontario Tumour Bank
Monique Albert, Iakovina Alexopoulou, Angel Arnaout, John Bartlett, Jay Engel, Sebastien Gilbert, Jeremy Parfitt, Harman Sekhon
Oregon Health & Science University
George Thomas
Papworth Hospital NHS Foundation Trust
Doris M. Rassl, Robert C. Rintoul
Providence Health and Services
Carlo Bifulco, Raina Tamakawa, Walter Urba
QIMR Berghofer Medical Research Institute
Nicholas Hayward
Radboud Medical University Center
Henri Timmers
Regina Elena National Cancer Institute
Anna Antenucci, Francesco Facciolo, Gianluca Grazi, Mirella Marino, Roberta Merola
Reinier de Graaf Hospital
Ronald de Krijger
René Descartes University
Anne-Paule Gimenez-Roqueplo
Research Center of Chus Sherbrooke, Québec
Alain Piché
Research Institute of the McGill University Health Centre
Simone Chevalier, Ginette McKercher
Rockefeller University
Kivanc Birsoy
Rose Ella Burkhardt Brain Tumor and Neuro-Oncology Center
Gene Barnett, Cathy Brewer, Carol Farver, Theresa Naska, Nathan A. Pennell, Daniel Raymond, Cathy Schilero, Kathy Smolenski, Felicia Williams
Roswell Park Cancer Institute
Carl Morrison
Rush University
Jeffrey A. Borgia, Michael J. Liptay, Mark Pool, Christopher W. Seder
Saarland University
Kerstin Junker
Sage Bionetworks
Larsson Omberg
Saint-Petersburg City Clinical Oncology Hospital
Mikhail Dinkin, George Manikhas
Sapienza University of Rome
Domenico Alvaro, Maria Consiglia Bragazzi, Vincenzo Cardinale, Guido Carpino, Eugenio Gaudio
Spectrum Health
David Chesla, Sandra Cottingham
St. Petersburg Academic University RAS
Michael Dubina, Fedor Moiseenko
Stanford University
Renumathy Dhanasekaran
Technical University of Munich
Karl-Friedrich Becker, Klaus-Peter Janssen, Julia Slotta-Huspenina
The International Genomics Consortium
Daniel Crain, Erin Curley, Johanna Gardner, David Mallery, Scott Morris, Joseph Paulauskis, Robert Penny, Candace Shelton, Troy Shelton, Eric Thompson
The Ohio State University
Mohamed H. Abdel-Rahman, Dina Aziz, Sue Bell, Colleen M. Cebulla, Amy Davis, Rebecca Duell,
J. Bradley Elder, Joe Hilty, Bahavna Kumar, James Lang, Norman L. Lehman, Randy Mandt, Phuong Nguyen, Robert Pilarski, Karan Rai, Lynn Schoenfield, Kelly Senecal, Paul Wakely
The Oregon Clinic
Paul Hansen
The Research Institute at Nationwide Children's Hospital
Nilsa Ramirez
Tufts Medical Center
Ronald Lechan, James Powers, Arthur Tischler
University of Alabama at Birmingham Medical Center
William E. Grizzle, Katherine C. Sexton
UC Cancer Institute
Alison Kastl
UCSF-Helen Diller Family Comprehensive Cancer Center
Joel Henderson, Sima Porten
University Hospital of Giessen and Marburg
Jens Waldmann
University Hospital in Wurzburg, Germany
Martin Fassnacht
University Health Network
Sylvia L. Asa
University Hospital Essen
Dirk Schadendorf
University Hospitals Case Medical Center Hamburg-Eppendorf
Marta Couce, Markus Graefen, Hartwig Huland, Guido Sauter, Thorsten Schlomm, Ronald Simon, Pierre Tennstedt
University of Abuja Teaching Hospital
Oluwole Olabode
University of Arizona
Mark Nelson
University of Calgary
Oliver Bathe
University of California
Peter R. Carroll, June M. Chan, Philip Disaia, Pat Glenn, Robin K. Kelley, Charles N. Landen, Joanna Phillips, Michael Prados, Jeff Simko, Jeffry Simko, Karen Smith-McCune, Scott VandenBerg
University of Chicago Medicine
Kevin Roggin
University of Cincinnati
Ashley Fehrenbach, Ady Kendler
University of Cincinnati Cancer Institute
Suzanne Sifri, Ruth Steele
University of Colorado Cancer Center
Antonio Jimeno
University of Dundee
Francis Carey, Ian Forgie
University of Florence
Massimo Mannelli
University of Hawaii Cancer Center
Michael Carney, Brenda Hernandez
University of Heidelberg
Benito Campos, Christel Herold-Mende, Christin Jungk, Andreas Unterberg, Andreas von Deimling
University of Iowa Hospital & Clinics
Aaron Bossler, Joseph Galbraith, Laura Jacobus, Michael Knudson, Tina Knutson, Deqin Ma, Mohammed Milhem, Rita Sigmund
University of Kansas Medical Center
Andrew K. Godwin, Rashna Madan, Howard G. Rosenthal
University of Maryland School of Medicine
Clement Adebamowo, Sally N. Adebamowo
University of Melbourne
Alex Boussioutas
University of Michigan
David Beer, Thomas Giordano
University of Montreal
Anne-Marie Mes-Masson, Fred Saad
University of New Mexico
Therese Bocklage
University of Oklahoma
Lisa Landrum, Robert Mannel, Kathleen Moore, Katherine Moxley, Russel Postier, Joan Walker, Rosemary Zuna
University of Pennsylvania
Michael Feldman, Federico Valdivieso
University of Pittsburgh
Rajiv Dhir, James Luketich
University of Puerto Rico
Edna M. Mora Pinero, Mario Quintero-Aguilo
University of São Paulo
Carlos Gilberto Carlotti Junior, Jose Sebastião Dos Santos, Rafael Kemp, Ajith Sankarankuty, Daniela Tirapelli
University of Sheffield Western Bank
James Catto
University of Washington
Kathy Agnew, Elizabeth Swisher
University of Western Australia
Jenette Creaney, Bruce Robinson
University of Wisconsin School of Medicine and Public Health
Carl Simon Shelley
University of Kansas Cancer Center
Eryn M. Godwin, Sara Kendall, Cassaundra Shipman
University of Michigan
Carol Bradford, Thomas Carey, Andrea Haddad, Jeffey Moyer, Lisa Peterson, Mark Prince, Laura Rozek, Gregory Wolf
UQ Thoracic Research Centre
Rayleen Bowman, Kwun M. Fong, Ian Yang
Valley Health System
Robert Korst
Vanderbilt University Medical Center
W. Kimryn Rathmell
Walter Reed National Medical Center
J. Leigh Fantacone-Campbell, Jeffrey A. Hooke, Albert J. Kovatich, Craig D. Shriver
Washington University
John DiPersio, Bettina Drake, Ramaswamy Govindan, Sharon Heath, Timothy Ley, Brian Van Tine, Peter Westervelt
Weill Cornell Medical College
Mark A. Rubin
Yonsei University College of Medicine
Jung Il Lee
Institution Not Provided
Natália D. Aredes, Armaz Mariamidze
Analysis Working Group Analysts/Participants
Barcelona Supercomputing Centre (BSC)
Eduard Porta-Pardo
Baylor College of Medicine
David A. Wheeler
The Broad Institute
Eliezer Van Allen, Rameen Beroukhim, Gad Getz, Julian M. Hess, Jaegil Kim, Michael S. Lawrence, Brendan Reardon
University of California, Santa Cruz
Joshua M. Stuart
Dana-Farber Cancer Institute
Brendan Reardon
Genome Institute of Singapore
Denis Bertrand, Jia Yu Koh, Niranjan Nagarajan, Chayaporn Suphavilai
Harvard Medical School
Isidro Cortés-Ciriano, Peter J. Park
Johns Hopkins University
Rachel Karchin, Collin Tokheim
Université Libre de Bruxelles (ULB)
Gianluca Bontempi, Antonio Colaprico, Catharina Olsen
Memorial Sloan-Kettering Cancer Center
JianJiong Gao
MD Anderson Cancer Center
Ken Chen, Kang Jin Jeong, Alexander J. Lazar, Han Liang, Gordon B. Mills, Kwok-Shing Ng, Zixing Wang, Fang Wang
University of Miami Health System
Antonio Colaprico
Institute of Molecular Bioimaging and Physiology
Gloria Bertoli, Isabella Castiglioni, Claudia Cava
Institute for Research in Biomedicine (IRB Barcelona)
Abel Gonzalez-Perez, Nuria Lopez-Bigas, Loris Mularoni, Carlota Rubio-Perez, David Tamborero
Sanford Burnham Prebys Medical Discovery Institute
Adam Godzik, Eduard Porta-Pardo
Washington University in St Louis
Matthew H. Bailey, Song Cao, Li Ding, Qingsong Gao, Wen-Wei Liang, Sohini Sengupta, Venkata D. Yellapantula, Amila Weerasinghe, Michael C. Wendl, Daniel Cui Zhou
Weill Cornell Medicine
Ekta Khurana, Eric Minwei Liu
Institution Addresses
Australian Prostate Cancer Research Center, Epworth Hospital, VIC, Australia
Australian Prostate Cancer Research Center, Epworth Hospital, VIC, Australia
Barretos Cancer Hospital, Av: Antenor Duarte Villela, 1331, Barretos, São Paulo, Brazil
Barrow Neurological Institute, St. Joseph's Hospital and Medical Center, Phoenix, Arizona 85013
Barrow Neurological Institute, St. Joseph's Hospital and Medical Center, Phoenix, Arizona 85013,
Baylor College of Medicine One Baylor Plaza, Houston, TX 77030
BC Cancer Agency, 675 W 10th Ave, Vancouver, BC V5Z 1L3, Canada
Beth Israel Deaconess Medical Center Harvard University Medical School Boston Mass
BioreclamationIVT, 99 Talbot Blvd Chestertown, MD 21620
Boston Medical Center, Boston MA 02118
Botkin Hospital, 2-y Botkinskiy pr-d, 5, Moskva, Russia, 125284
Brain Tumor and Neuro-oncology Center, Department of Neurosurgery, University Hospitals Case Medical Center, Case Western Reserve School of Medicine, 11100 Euclid Ave, Cleveland, Ohio, 44106
Brain Tumor Center at the University of Cincinnati Gardner Neuroscience Institute, and Department of Neurosurgery, University of Cincinnati College of Medicine, and Mayfield Clinic, 260 Stetson Street, Suite 2200, Cincinnati, Ohio, 45219
Brain Tumor Center at the University of Cincinnati Neuroscience Institute, and Department of Neurosurgery, University of Cincinnati College of Medicine, and Mayfield Clinic, 234 Goodman Street, Cincinnati, Ohio, 45219
Brigham and Women's Hospital, 75 Francis St, Boston MA 02115
Capital Biosciences, Inc., 900 Clopper Rd, Suite 120, Gaithersburg, MD 20878
Case Comprehensive Cancer Center, 11100 Euclid Ave - Wearn 152, Cleveland, OH 44106-5065
Cedars-Sinai Medical Center, 8700 Beverly Boulevard, Suite 290 West MOT, Los Angeles, CA
Center for Liver Cancer, National Cancer Center Korea, 323 Ilsan-ro, Ilsan dong-gu, Goyang, Gyeonggi 10408, South Korea
Central Arkansas Veterans Healthcare System, Little Rock, AR 72205
CHU of Quebec, Laval University Research Center of Chus 2705, boul. Laurier Bureau TR72
QUÉBEC, Quebec G1V 4G2
Centura Health 9100 E Mineral Cir, Centennial, CO 80112
Chan Soon-Shiong Institute of Molecular Medicine at Windber, Windber, PA 15963
Charles University, Czech Republic
CHU of Quebec, Hôtel-Dieu de Quebec-University Laval, 11 cote du palais, Quebec City, G1R 2J6
CHUM, Montreal, Qc, Canada.
Clinic of Urology and Pediatric Urology, Saarland University, Homburg, Germany.
Clinical Breast Care Project, Murtha Cancer Center, Uniformed Services University / Walter Reed National Military Medical Center, Bethesda, MD 20889
Comprehensive Cancer Center Tissue Procurement Shared Resource, Cooperative Human Tissue Network Midwestern Division, Dept. of Pathology, Human Tissue Resource Network, The Ohio State University, 410 West 10th Ave, Doan Hall, Room E413A, Columbus, OH 43210
Cureline, Inc., 290 Utah Ave, Ste 300, South san Francisco, CA 94080, USA
Dana-Farber Cancer Institute, 450 Brookline Ave, Boston MA, 02215
Dardinger Neuro-Oncology Center, Department of Neurosurgery, James Comprehensive Cancer Center and The Ohio State University Medical Center, 320 W 10th Ave, Columbus, Ohio, 43210
Department of Cardiovascular and Thoracic Surgery. Suite 774 Professional Office Building. 1735 W. Harrison St., Chicago, IL 60612
Department of Epidemiology and Public Health, University of Maryland School of Medicine, Baltimore MD 21201
Department of Genetics & Genomic Sciences, Icahn School of Medicine at Mount Sinai, 1 Gustave L. Levy Place, New York, NY 10029
Department of Hematology and Medical Oncology, Mayo Clinic Arizona, 5779 E. Mayo Blvd, Phoenix AZ 85054
Department of Medicine, University of Wisconsin School of Medicine and Public Health, 1685 Highland Avenue, Madison, WI 53705
Department of Medicine, Washington University in St. Louis, 660 S. Euclid Ave., CB 8066, St. Louis, MO 63110
Department of Medicine, Yonsei University College of Medicine, Seoul, Republic of Korea
Department of Neurological Surgery
Department of Neurosurgery, Emory University School of Medicine, 1365 Clifton Road, NE, Atlanta, GA 30322
Department of Obstetrics and Gynecology, Baylor College of Medicine, One Baylor Plaza, Houston, Texas 77030
Department of Obstetrics/Gynecology and Reproductive Sciences, Icahn School of Medicine at Mount Sinai, 1 Gustave L. Levy Place, New York, NY 10029
Department of Orthopedic Surgery, University of Kansas Medical Center 3901 Rainbow Boulevard, Kansas City, KS 66160
Department of Pathology and Cell Biology, Columbia University, New York, NY10032
Department of Pathology and Immunology, Baylor College of Medicine, One Baylor Plaza, Houston, TX 77030
Department of Pathology and Laboratory Medicine, University of Kansas Medical Center, Kansas City, KS 66206
Department of Pathology, Department of Cell and Molecular Medicine. 570 Jelke South center, 1750 W. Harrison St., Chicago, IL 60612
Department of Pathology, Duke University School of Medicine, Durham, NC 27710
Department of Pathology, Spectrum Health, 35 Michigan NE, Grand Rapids, MI 49503
Department of Pathology, The Ohio State University School of Medicine, N308 Doan Hall, 410 W 10th Ave, Columbus, OH-43210-1267
Department of Pathology, The Ohio State University Wexner Medical Center (Doan Hall N337B, 410 West 10th Ave., Columbus, OH 43210)
Department of Pathology. 570 Jelke South center, 1750 W. Harrison St., Chicago, IL 60612
Department of Surgery and Anatomy, Ribeirão Preto Medical School - FMRP, University of São Paulo, Brazil, 14049-900
Department of Surgery and Cancer, Imperial College London, Du Cane Road London W12 0NN, UK
Department of Surgery, Brigham and Women's Hospital, Harvard Medical School, Boston, MA, USA
Department of Surgery, Columbia University, New York, NY 10032
Department of Surgery, University of Michigan, Ann Arbor MI 48109
Department of Urology and Pediatric Urology, University Hospital Erlangen, Friedrich-Alexander-University Erlangen-Nuremberg, 91054 Erlangen, Germany
Department of Urology, Mayo Clinic Arizona, 5779 E. Mayo Blvd, Phoenix AZ 85054
Departments of Neurosurgery and Hematology and Medical Oncology, School of Medicine and Winship Cancer Institute, 1365C Clifton Rd. N.E., Emory University, Atlanta, GA 30322
Departments of Pathology & Translational Molecular Pathology, The University of Texas MD Anderson Cancer Center, 1515 Holcombe Blvd--Unit 85, Houston, Texas, USA
Dept. of Pathology & Laboratory Medicine, University of Cincinnati, UC Health University Hospital, 234 Goodman Street, Cincinnati, OH 45219-0533
Dept. of Pathology, Robert J. Tomsich Pathology & Laboratory Medicine Institute, Lerner Research Inst, Cleveland Clinic Foundation, Cleveland, OH 44195
Dept. of Surgery, Klinikum rechts der Isar, Technical University of Munich, Ismaninger Str. 22, 81675 Munich, Germany
Dignity Health Mercy Gilbert Medical Center 3555 S Val Vista Dr, Gilbert, AZ 85297
Division Molecular Urology, Department of Urology and Pediatric Urology, University Hospital Erlangen,
Friedrich-Alexander-University Erlangen-Nuremberg, 91054 Erlangen, Germany
Division of Cancer Epidemiology and Genetics, National Cancer Institute, 9609 Medical Center Dr. Bethesda 20892 USA
Division of Neurosurgical Research, Dpt. Neurosurgery, University of Heidelberg, INF 400, 69120 Heidelberg, Germany
Division of Surgical Oncology, Department of Surgery, Brigham and Women's Hospital, 75 Francis Street, Boston, MA 02115
Dpt. Neuropathology, University of Heidelberg, INF 224, 69120 Heidelberg, Germany
Dpt. Neurosurgery, University of Heidelberg, INF 400, 69120 Heidelberg, Germany Duke University
Duke University Medical Center 177 MSRB Box 3156 Durham, NC 27710
Duke University Medical Center, Gynecologic Oncology, Box 3079, Durham, NC USA
Emory University, 1365 Clifton Road, NE Atlanta GA, 30322
Erasmus MC, Wytemaweg 80, 3015 CN, Rotterdam, The Netherlands
Erasmus Medical Center
Erasmus University Medical Center Rotterdam, Cancer Institute, Wytemaweg 80, 3015CN, Rotterdam, the Netherlands
The Foundation of the Carlo Besta Neurological Institute, IRCCS via Celoria 11, 20133
Fred Hutchinson Cancer Research Center, 1100 Fairview Ave N, Seattle, WA 98019
Greater Poland Cancer Center, Garbary 15, 61-866 Poznań Poland
Greenville Health System Institute for Translational Oncology Research 900 West Faris Road Greenville SC 29605
Harvard University Cambridge, MA 02138
Havener Eye Institute, The Ohio State University Wexner Medical Center 915 Olentangy River Rd, Columbus, OH 43212
Henry Ford Hospital 2799 West Grand Blvd Detroit MI USA 48202
Hepatobiliary Surgery Unit, A. Gemelli Hospital, Catholic University of the Sacred Heart, Largo Agostino Gemelli 8, 00168 Rome, Italy
Hermelin Brain Tumor Center, Henry Ford Health System, 2799 W Grand Blvd, Detroit, MI, 48202
Hospices Civils de Lyon, CARDIOBIOTEC, Lyon F-69677, France
Hospital Clinic, Villarroel 180, Barcelona, Spain, 08036
Hue Central Hospital, Hue, Vietnam
Human Tissue Resource Network, Dept. of Pathology, College of Medicine, 1615 Polaris Innovation Ctr, 2001 Polaris, Columbus 43240
Huntsman Cancer Institute, Univ. of Utah, 2000 Circle of Hope, Salt Lake City, UT 84112 Indivumed GmbH, 20251 Hamburg, Germany
René Descartes University, Hospital Européen Georges Pompidou, 20 rue Leblanc, 75015, Paris, France
Curie Institute, 26 rue Ulm, 75005 Paris, France
Gustave Roussy Institute of Oncology, 39 Rue Camille Desmoulins 94805, Villejuif, France
Institute of Human Virology Nigeria, Abuja, Nigeria
Institute of Molecular Bioimaging and Physiology, Via F.Cervi 93, 20090 Segrate-Mi Italy
Institute of Pathology, Technical University of Munich, Trogerstr. 18, 83675 Munich, Germany
Institute of Pathology, University Hospital Erlangen, Firedrich-Alexander-University Erlangen-Nuremberg, 91054 Erlangen, Germany
Institute of Urgent Medicine, Republic of Moldova
Regina Elena National Cancer Institute Irccs - Ifo, Via Elio Chianesi 53, 00144, Rome, Italy
John Wayne Cancer Institute, 2200 Santa Monica Blvd, Santa Monica, CA 90404
Keimyung University, Daegu, South Korea
Knight Comprehensive Cancer Institute, Oregon Health & Science University
Ludwich Maximilians University Munich, Ziemssenstrasse 1, D-80336, Munich, Germany
Maine Medical Center, 22 Bramhall St., Portland, ME 04102
Martini-Clinic, Prostate Cancer Center, University Medical Center Hamburg-Eppendorf, Martinistr. 52, D-20246 Hamburg, Germany
Massachusetts General Hospital 55 Fruit Street Boston Ma 02114
Mayo Clinic 5777 E Mayo Blvd, Phoenix, Arizona 85054
Mayo Clinic 4500 San Pablo Road Jacksonville, FL 32224
Mayo Clinic, 200 First St. SW, Rochester, MN 55905
Mayo Clinic, Rochester, MN 55905
McGill University Health Center. 1001 Decarie Blvd, Montreal, QC, Canada H4A 3J1
MD Anderson Cancer Center 1515 Holcombe Blvd. Unit 0085 Houston, TX 77030
MD Anderson Cancer Center, Department of Pathology, Unit 085; 1515
MD Anderson Cancer Center Life Science Plaza Building 2130 W. Holcombe Blvd, Unit 2951 Houston, TX 77030 Office: LSP9.4029
Melanoma Institute Australia, North Sydney, NSW, Australia 2060
Memorial Sloan Kettering Cancer Center Department of Pathology, 1275 York Avenue, New York, NY 10065
Memorial Sloan Kettering Cancer Center, 1275 York Avenue, New York, NY 10065
Memorial Sloan Kettering Cancer Center, Center for Molecular Oncology, 1275 York Avenue, New York, NY 10065
Ministry of Health of Vietnam, Hanoi, Vietnam
Molecular Pathology Shared Resource of Herbert Irving Comprehensive Cancer Center of Columbia University, New York, NY10032
Molecular Response 11011 Torreyana Road San Diego, CA 92121
Murtha Cancer Center, Uniformed Services University / Walter Reed National Military Medical Center, Bethesda, MD 20889
Nancy N. and J.C. Lewis Cancer & Research Pavilion at St. Joseph's/Candler, 225 Candler Drive, Savannah, GA 31405
National Cancer Hospital of Vietnam
National Cancer Institute, 31 Center Dr, Bethesda, MD 20892
National Cancer Institute, Bethesda, MD 20892
Norfolk & Norwich University Hospital, Norwich, UK. NR4 7UY
NYU Langone Medical Center, Cardiothoracic Surgery, 530 first Avenue, 9V, New York, NY Oncology Institute, Republic of Moldova
Ontario Tumor Bank - Hamilton site, St. Joseph's Healthcare Hamilton, Hamilton, Ontario L8N 3Z5, Canada
Ontario Tumor Bank - Kingston site, Kingston General Hospital, Kingston, Ontario K7L 5H6, Canada
Ontario Tumor Bank – Ottawa site, The Ottawa Hospital, Ottawa, Ontario K1H 8L6, Canada.
Ontario Tumor Bank, London Health Sciences Centre, London, Ontario N6A 5A5, Canada
Ontario Tumor Bank, Ontario Institute for Cancer Research, Toronto, Ontario M5G 0A3, Canada
Orbital Oncology & Ophthalmic Plastic Surgery Department of Plastic Surgery M.D. Anderson Cancer Center 1515 Holcombe Blvd, Unit 1488 Houston, Texas 77030
Papworth Hospital NHS Foundation Trust, UK
Pathology, St. Joseph's/Candler, 5353 Reynolds St., Savannah, GA 31405
Professor, Division of Neuropathology, Department of Pathology, University Hospitals Case Medical Center
Program in Epidemiology, Fred Hutchinson Cancer Research Center, Seattle, WA 98109
Providence Health and Services
QIMR Berghofer Medical Research Institute, Herston, QLD, Australia
Radboud Medical University Center, Geert Grooteplein-Zuid 10, Nijmegen, the Netherlands
Regina Elena National Cancer Institute, 00144 Rome, Italy
Reinier de Graaf Hospital, Reinier de Graafweg 5, 2625AD, Delft, the Netherlands
Research Institute of the McGill University Health Centre, McGill University, Montréal, Québec, Canada
Research Center Of Chus Sherbrooke, Québec aile 9, porte 6, 3001 12e Avenue Nord, Sherbrooke, QC J1H 5N4, Canada
Rockefeller University 1230 York Ave New York, NY
Rose Ella Burkhardt Brain Tumor and Neuro-Oncology Center ND4-52A, Cleveland Clinic Foundation, 9500 Euclid Ave, Cleveland, OH 44195
Rose Ella Burkhardt Brain Tumor and Neuro-Oncology Center, 9500 Euclid Avenue - CA51, Cleveland, OH 44195
Rose Ella Burkhardt Brain Tumor and Neuro-Oncology Center, Department of Neurosurgery, Neurological and Taussig Cancer Institute, Cleveland Clinic, 9500 Euclid Avenue, Cleveland, Ohio, 44195
Roswell Park Cancer Institute. Elm & Carlton Streets, Buffalo NY 14263
Sage Bionetworks, Seattle, WA 98109
Saint-Petersburg City Clinical Oncology Hospital, 56 Veteranov prospect, Saint-Petersburg, 198255, Russia
Sapienza University of Rome, Piazzale Aldo Moro 5, 00185 Rome, Italy
School of Medicine, National Center for Asbestos Related Research, University of Western Australia, Nedlands, WA, Australia 6009
Sir Peter MacCallum Department of Oncology, University of Melbourne, Parkville, 3050, Victoria, Australia
St. Petersburg Academic University RAS, 8/3 Khlopin Str., St. Petersburg, 194021, Russia Stanford University, Palo Alto, CA, USA
Stephenson Cancer Center, University of Oklahoma, Oklahoma City, OK USA
Tayside Tissue Bank, University of Dundee, Scotland UK DD1 9SY
The International Genomics Consortium, 445 N. 5th Street, Phoenix, Arizona 85004
The Ohio State University, Columbus, OH 43210
The Ohio State University Comprehensive Cancer Center, 320 W 10th Avenue, Columbus, OH 43210
The Ohio State University Wexner Medical Center (2012 Kenny Rd, Columbus, OH 43221)
The Oregon Clinic 1111 NE 99th Ave, Portland, OR 97220
The Prince Charles Hospital, UQ Thoracic Research Centre, Australia 4032
The Research Institute at Nationwide Children's Hospital 700 Children's Drive Columbus Ohio 43205
Tufts Medical center, 800 Washington St. Boston MA 02111
UABMC 401 Beacon Pkwy W Birmingham AL 35209
UC Cancer Institute, 200 Albert Sabin Way, Suite 1012, Cincinnati, OH 45267-0502
UCSF-Helen Diller Family Comprehensive Cancer Center, 550 16th St., Mission Hall WS 6532 Box 3211, San Francisco, CA 94143
Université Libre de Bruxelles, Département d'Informatique, Boulevard du Triomphe - CP212, 1050
Bruxelles, Belgium University Hospital of Giessen and Marburg, Badingerstrasse 3, 35044, Marburg, Germany
University Hospital in Wurzburg, Germany, Oberdürrbacher Strasse 6, 97080, Würzburg, Germany
University Health Network, 200 Elizabeth Street, Toronto ON M5G 2C4 Canada
University Hospital Essen, University Duisburg-Essen, German Cancer Consortium, Hufelandstr. 55; 45239 Essen, Germany
University Medical Center Hamburg-Eppendorf, Martinistr. 52, D-20246 Hamburg, Germany
University of Abuja Teaching Hospital, Gwagalada, FCT, Nigeria
University of Arizona
Tucson Arizona University of Calgary, Departments of Surgery and Oncology, 1331 - 29th St NW, Calgary, AB, T2N 4N2
University of California San Francisco, 2340 Sutter St Rm S 229, San Francisco CA 94143
University of California, Irvine 333 City Boulevard West Suite 1400 Orange CA 92868
University of Chicago Medicine 5841 S. Maryland Ave. Room G-216, MC 5094|Chicago, IL 60637
University of Cincinnati Cancer Institute, Brain Tumor Clinical Trials, 200 Albert Sabin Way Suite 1012, Cincinnati, OH 45267
University of Cincinnati Cancer Institute, Holmes Bldg., 200 Albert Sabin Way, Ste 1002, Cincinnati, OH 45267-0502
University of Colorado Cancer Center, Aurora, CO, 80111, USA
University of Dundee, Scotland UK DD1 9SY
University of Florence, Viale Pieraccini 6, 50139 Firenze, Italy
University of Hawaii Cancer Center
University of Iowa Hospital & Clinics, 200 Hawkins Drive, Clinical Trials-Data Management, 11510 PFP, Iowa City, IA 52242
University of Iowa Hospital & Clinics, 200 Hawkins Drive, Hematology/Oncology, C32 GH, Iowa City, IA 52242
University of Iowa Hospital & Clinics, 200 Hawkins Drive, ICTS-Informatics, 272 MRF, Iowa City, IA 52242
University of Iowa Hospital & Clinics, 200 Hawkins Drive, Medicine Administration, 380 MRC, Iowa City, IA 52242
University of Iowa Hospital & Clinics, 200 Hawkins Drive, Molecular Pathology, B606 GH, Iowa City, IA 52242
University of Iowa Hospital & Clinics, 200 Hawkins Drive, Pathology, SW247 GH, Iowa City, IA 52242
University of Kansas Cancer Center, 3901 Rainbow Blvd, Kansas City, KS. 66160
University of Kansas Medical Center Kansas City KS 66160
University of Miami Health System, Sylvester Comprehensive Cancer Center (SCCC), Department of Human Genetics, Miami, Florida, 33136, USA
University of Michigan 500 S State St, Ann Arbor, MI 48109
University of Montreal 2900 Edouard Mont petit Blvd, Montreal, QC H3T 1J4, Canada
University of New Mexico Albuquerque, New Mexico 87131
University of Pennsylvania Philadelphia, PA 19104
University of Pittsburgh, Department of Cardiothoracic Surgery,200 Lothrop St, Suite C-800, Pittsburgh, Pennsylvania 15213
University of Pittsburgh, Department of Pathology, Pittsburgh, Pennsylvania 15213
University of Sheffield Western Bank, Sheffield S10 2TN, UK
University of Washington Seattle, WA 98105
UPR Comprehensive Cancer Center Biobank; University of Puerto Rico Comprehensive Cancer Center, Celso Barbosa St. Medical Center Area, San Juan, PR 00936
Urologic Oncology Branch, Center for Cancer Research, National Cancer Institute, Building 10, Room 1-5940, Bethesda, MD 20892-1107
Valley Health System, 1 Valley Health Plaza, Paramus, NJ 07652
Vanderbilt University Medical Center 1211 Medical Center Dr, Nashville, TN 37232
Washington University School of Medicine, 600 S. Taylor Ave, St. Louis, MO 63110
Weill Cornell Medical College, New York, NY 10065
Amy Blum, Samantha J. Caesar-Johnson, John A. Demchok, Ina Felau, Melpomeni Kasapi, Martin L. Ferguson, Carolyn M. Hutter, Heidi J. Sofia, Roy Tarnuzzer, Peggy Wang, Zhining Wang, Liming Yang, Jean C. Zenklusen, Jiashan (Julia) Zhang, Sudha Chudamani, Jia Liu, Laxmi Lolla, Rashi Naresh, Todd Pihl, Qiang Sun, Yunhu Wan, Ye Wu, Juok Cho, Timothy DeFreitas, Scott Frazer, Nils Gehlenborg, Gad Getz, David I. Heiman, Jaegil Kim, Michael S. Lawrence, Pei Lin, Sam Meier, Michael S. Noble, Gordon Saksena, Doug Voet, Hailei Zhang, Brady Bernard, Nyasha Chambwe, Varsha Dhankani, Theo Knijnenburg, Roger Kramer, Kalle Leinonen, Yuexin Liu, Michael Miller, Sheila Reynolds, Ilya Shmulevich, Vesteinn Thorsson, Wei Zhang, Rehan Akbani, Bradley M. Broom, Apurva M. Hegde, Zhenlin Ju, Rupa S. Kanchi, Anil Korkut, Jun Li, Han Liang, Shiyun Ling, Wenbin Liu, Yiling Lu, Gordon B. Mills, Kwok-Shing Ng, Arvind Rao, Michael Ryan, Jing Wang, John N. Weinstein, Jiexin Zhang, Adam Abeshouse, Joshua Armenia, Debyani Chakravarty, Walid K. Chatila, Ino de Bruijn, Jianjiong Gao, Benjamin E. Gross, Zachary J. Heins, Ritika Kundra, Konnor La, Marc Ladanyi, Augustin Luna, Moriah G. Nissan, Angelica Ochoa, Sarah M. Phillips, Ed Reznik, Francisco Sanchez-Vega, Chris Sander, Nikolaus Schultz, Robert Sheridan, S. Onur Sumer, Yichao Sun, Barry S. Taylor, Jioajiao Wang, Hongxin Zhang, Pavana Anur, Myron Peto, Paul Spellman, Christopher Benz, Joshua M. Stuart, Christopher K. Wong, Christina Yau, D. Neil Hayes, Joel S. Parker, Matthew D. Wilkerson, Adrian Ally, Miruna Balasundaram, Reanne Bowlby, Denise Brooks, Rebecca Carlsen, Eric Chuah, Noreen Dhalla, Robert Holt, Steven J.M. Jones, Katayoon Kasaian, Darlene Lee, Yussanne Ma, Marco A. Marra, Michael Mayo, Richard A. Moore, Andrew J. Mungall, Karen Mungall, A. Gordon Robertson, Sara Sadeghi, Jacqueline E. Schein, Payal Sipahimalani, Angela Tam, Nina Thiessen, Kane Tse, Tina Wong, Ashton C. Berger, Rameen Beroukhim, Andrew D. Cherniack, Carrie Cibulskis, Stacey B. Gabriel, Galen F. Gao, Gavin Ha, Matthew Meyerson, Steven E. Schumacher, Juliann Shih, Melanie H. Kucherlapati, Raju S. Kucherlapati, Stephen Baylin, Leslie Cope, Ludmila Danilova, Moiz S. Bootwalla, Phillip H. Lai, Dennis T. Maglinte, David J. Van Den Berg, Daniel J. Weisenberger, J. Todd Auman, Saianand Balu, Tom Bodenheimer, Cheng Fan, Katherine A. Hoadley, Alan P. Hoyle, Stuart R. Jefferys, Corbin D. Jones, Shaowu Meng, Piotr A. Mieczkowski, Lisle E. Mose, Amy H. Perou, Charles M. Perou, Jeffrey Roach, Yan Shi, Janae V. Simons, Tara Skelly, Matthew G. Soloway, Donghui Tan, Umadevi Veluvolu, Huihui Fan, Toshinori Hinoue, Peter W. Laird, Hui Shen, Wanding Zhou, Michelle Bellair, Kyle Chang, Kyle Covington, Chad J. Creighton, Huyen Dinh, HarshaVardhan Doddapaneni, Lawrence A. Donehower, Jennifer Drummond, Richard A. Gibbs, Robert Glenn, Walker Hale, Yi Han, Jianhong Hu, Viktoriya Korchina, Sandra Lee, Lora Lewis, Wei Li, Xiuping Liu, Margaret Morgan, Donna Morton, Donna Muzny, Jireh Santibanez, Margi Sheth, Eve Shinbrot, Linghua Wang, Min Wang, David A. Wheeler, Liu Xi, Fengmei Zhao, Julian Hess, Elizabeth L. Appelbaum, Matthew Bailey, Matthew G. Cordes, Li Ding, Catrina C. Fronick, Lucinda A. Fulton, Robert S. Fulton, Cyriac Kandoth, Elaine R. Mardis, Michael D. McLellan, Christopher A. Miller, Heather K. Schmidt, Richard K. Wilson, Daniel Crain, Erin Curley, Johanna Gardner, Kevin Lau, David Mallery, Scott Morris, Joseph Paulauskis, Robert Penny, Candace Shelton, Troy Shelton, Mark Sherman, Eric Thompson, Peggy Yena, Jay Bowen, Julie M. Gastier-Foster, Mark Gerken, Kristen M. Leraas, Tara M. Lichtenberg, Nilsa C. Ramirez, Lisa Wise, Erik Zmuda, Niall Corcoran, Tony Costello, Christopher Hovens, Andre L. Carvalho, Ana C. de Carvalho, José H. Fregnani, Adhemar Longatto-Filho, Rui M. Reis, Cristovam Scapulatempo-Neto, Henrique C.S. Silveira, Daniel O. Vidal, Andrew Burnette, Jennifer Eschbacher, Beth Hermes, Ardene Noss, Rosy Singh, Matthew L. Anderson, Patricia D. Castro, Michael Ittmann, David Huntsman, Bernard Kohl, Xuan Le, Richard Thorp, Chris Andry, Elizabeth R. Duffy, Vladimir Lyadov, Oxana Paklina, Galiya Setdikova, Alexey Shabunin, Mikhail Tavobilov, Christopher McPherson, Ronald Warnick, Ross Berkowitz, Daniel Cramer, Colleen Feltmate, Neil Horowitz, Adam Kibel, Michael Muto, Chandrajit P. Raut, Andrei Malykh, Jill S. Barnholtz-Sloan, Wendi Barrett, Karen Devine, Jordonna Fulop, Quinn T. Ostrom, Kristen Shimmel, Yingli Wolinsky, Andrew E. Sloan, Agostino De Rose, Felice Giuliante, Marc Goodman, Beth Y. Karlan, Curt H. Hagedorn, John Eckman, Jodi Harr, Jerome Myers, Kelinda Tucker, Leigh Anne Zach, Brenda Deyarmin, Hai Hu, Leonid Kvecher, Caroline Larson, Richard J. Mural, Stella Somiari, Ales Vicha, Tomas Zelinka, Joseph Bennett, Mary Iacocca, Brenda Rabeno, Patricia Swanson, Mathieu Latour, Louis Lacombe, Bernard Têtu, Alain Bergeron, Mary McGraw, Susan M. Staugaitis, John Chabot, Hanina Hibshoosh, Antonia Sepulveda, Tao Su, Timothy Wang, Olga Potapova, Olga Voronina, Laurence Desjardins, Odette Mariani, Sergio Roman-Roman, Xavier Sastre, Marc-Henri Stern, Feixiong Cheng, Sabina Signoretti, Andrew Berchuck, Darell Bigner, Eric Lipp, Jeffrey Marks, Shannon McCall, Roger McLendon, Angeles Secord, Alexis Sharp, Madhusmita Behera, Daniel J. Brat, Amy Chen, Keith Delman, Seth Force, Fadlo Khuri, Kelly Magliocca, Shishir Maithel, Jeffrey J. Olson, Taofeek Owonikoko, Alan Pickens, Suresh Ramalingam, Dong M. Shin, Gabriel Sica, Erwin G. Van Meir, Hongzheng Zhang, Wil Eijckenboom, Ad Gillis, Esther Korpershoek, Leendert Looijenga, Wolter Oosterhuis, Hans Stoop, Kim E. van Kessel, Ellen C. Zwarthoff, Chiara Calatozzolo, Lucia Cuppini, Stefania Cuzzubbo, Francesco DiMeco, Gaetano Finocchiaro, Luca Mattei, Alessandro Perin, Bianca Pollo, Chu Chen, John Houck, Pawadee Lohavanichbutr, Arndt Hartmann, Christine Stoehr, Robert Stoehr, Helge Taubert, Sven Wach, Bernd Wullich, Witold Kycler, Dawid Murawa, Maciej Wiznerowicz, Ki Chung, W. Jeffrey Edenfield, Julie Martin, Eric Baudin, Glenn Bubley, Raphael Bueno, Assunta De Rienzo, William G. Richards, Steven Kalkanis, Tom Mikkelsen, Houtan Noushmehr, Lisa Scarpace, Nicolas Girard, Marta Aymerich, Elias Campo, Eva Giné, Armando López Guillermo, Nguyen Van Bang, Phan Thi Hanh, Bui Duc Phu, Yufang Tang, Howard Colman, Kimberley Evason, Peter R. Dottino, John A. Martignetti, Hani Gabra, Hartmut Juhl, Teniola Akeredolu, Serghei Stepa, Dave Hoon, Keunsoo Ahn, Koo Jeong Kang, Felix Beuschlein, Anne Breggia, Michael Birrer, Debra Bell, Mitesh Borad, Alan H. Bryce, Erik Castle, Vishal Chandan, John Cheville, John A. Copland, Michael Farnell, Thomas Flotte, Nasra Giama, Thai Ho, Michael Kendrick, Jean-Pierre Kocher, Karla Kopp, Catherine Moser, David Nagorney, Daniel O’Brien, Brian Patrick O’Neill, Tushar Patel, Gloria Petersen, Florencia Que, Michael Rivera, Lewis Roberts, Robert Smallridge, Thomas Smyrk, Melissa Stanton, R. Houston Thompson, Michael Torbenson, Ju Dong Yang, Lizhi Zhang, Fadi Brimo, Jaffer A. Ajani, Ana Maria Angulo Gonzalez, Carmen Behrens, Jolanta Bondaruk, Russell Broaddus, Bogdan Czerniak, Bita Esmaeli, Junya Fujimoto, Jeffrey Gershenwald, Charles Guo, Alexander J. Lazar, Christopher Logothetis, Funda Meric-Bernstam, Cesar Moran, Lois Ramondetta, David Rice, Anil Sood, Pheroze Tamboli, Timothy Thompson, Patricia Troncoso, Anne Tsao, Ignacio Wistuba, Candace Carter, Lauren Haydu, Peter Hersey, Valerie Jakrot, Hojabr Kakavand, Richard Kefford, Kenneth Lee, Georgina Long, Graham Mann, Michael Quinn, Robyn Saw, Richard Scolyer, Kerwin Shannon, Andrew Spillane, Jonathan Stretch, Maria Synott, John Thompson, James Wilmott, Hikmat Al-Ahmadie, Timothy A. Chan, Ronald Ghossein, Anuradha Gopalan, Douglas A. Levine, Victor Reuter, Samuel Singer, Bhuvanesh Singh, Nguyen Viet Tien, Thomas Broudy, Cyrus Mirsaidi, Praveen Nair, Paul Drwiega, Judy Miller, Jennifer Smith, Howard Zaren, Joong-Won Park, Nguyen Phi Hung, Electron Kebebew, W. Marston Linehan, Adam R. Metwalli, Karel Pacak, Peter A. Pinto, Mark Schiffman, Laura S. Schmidt, Cathy D. Vocke, Nicolas Wentzensen, Robert Worrell, Hannah Yang, Marc Moncrieff, Chandra Goparaju, Jonathan Melamed, Harvey Pass, Natalia Botnariuc, Irina Caraman, Mircea Cernat, Inga Chemencedji, Adrian Clipca, Serghei Doruc, Ghenadie Gorincioi, Sergiu Mura, Maria Pirtac, Irina Stancul, Diana Tcaciuc, Monique Albert, Iakovina Alexopoulou, Angel Arnaout, John Bartlett, Jay Engel, Sebastien Gilbert, Jeremy Parfitt, Harman Sekhon, George Thomas, Doris M. Rassl, Robert C. Rintoul, Carlo Bifulco, Raina Tamakawa, Walter Urba, Nicholas Hayward, Henri Timmers, Anna Antenucci, Francesco Facciolo, Gianluca Grazi, Mirella Marino, Roberta Merola, Ronald de Krijger, Anne-Paule Gimenez-Roqueplo, Alain Piché, Simone Chevalier, Ginette McKercher, Kivanc Birsoy, Gene Barnett, Cathy Brewer, Carol Farver, Theresa Naska, Nathan A. Pennell, Daniel Raymond, Cathy Schilero, Kathy Smolenski, Felicia Williams, Carl Morrison, Jeffrey A. Borgia, Michael J. Liptay, Mark Pool, Christopher W. Seder, Kerstin Junker, Larsson Omberg, Mikhail Dinkin, George Manikhas, Domenico Alvaro, Maria Consiglia Bragazzi, Vincenzo Cardinale, Guido Carpino, Eugenio Gaudio, David Chesla, Sandra Cottingham, Michael Dubina, Fedor Moiseenko, Renumathy Dhanasekaran, Karl-Friedrich Becker, Klaus-Peter Janssen, Julia Slotta-Huspenina, Mohamed H. Abdel-Rahman, Dina Aziz, Sue Bell, Colleen M. Cebulla, Amy Davis, Rebecca Duell, J. Bradley Elder, Joe Hilty, Bahavna Kumar, James Lang, Norman L. Lehman, Randy Mandt, Phuong Nguyen, Robert Pilarski, Karan Rai, Lynn Schoenfield, Kelly Senecal, Paul Wakely, Paul Hansen, Ronald Lechan, James Powers, Arthur Tischler, William E. Grizzle, Katherine C. Sexton, Alison Kastl, Joel Henderson, Sima Porten, Jens Waldmann, Martin Fassnacht, Sylvia L. Asa, Dirk Schadendorf, Marta Couce, Markus Graefen, Hartwig Huland, Guido Sauter, Thorsten Schlomm, Ronald Simon, Pierre Tennstedt, Oluwole Olabode, Mark Nelson, Oliver Bathe, Peter R. Carroll, June M. Chan, Philip Disaia, Pat Glenn, Robin K. Kelley, Charles N. Landen, Joanna Phillips, Michael Prados, Jeff Simko, Jeffry Simko, Karen Smith-McCune, Scott VandenBerg, Kevin Roggin, Ashley Fehrenbach, Ady Kendler, Suzanne Sifri, Ruth Steele, Antonio Jimeno, Francis Carey, Ian Forgie, Massimo Mannelli, Michael Carney, Brenda Hernandez, Benito Campos, Christel Herold-Mende, Christin Jungk, Andreas Unterberg, Andreas von Deimling, Aaron Bossler, Joseph Galbraith, Laura Jacobus, Michael Knudson, Tina Knutson, Deqin Ma, Mohammed Milhem, Rita Sigmund, Andrew K. Godwin, Rashna Madan, Howard G. Rosenthal, Clement Adebamowo, Sally N. Adebamowo, Alex Boussioutas, David Beer, Thomas Giordano, Anne-Marie Mes-Masson, Fred Saad, Therese Bocklage, Lisa Landrum, Robert Mannel, Kathleen Moore, Katherine Moxley, Russel Postier, Joan Walker, Rosemary Zuna, Michael Feldman, Federico Valdivieso, Rajiv Dhir, James Luketich, Edna M. Mora Pinero, Mario Quintero-Aguilo, Carlos Gilberto Carlotti, Jr., Jose Sebastião Dos Santos, Rafael Kemp, Ajith Sankarankuty, Daniela Tirapelli, James Catto, Kathy Agnew, Elizabeth Swisher, Jenette Creaney, Bruce Robinson, Carl Simon Shelley, Eryn M. Godwin, Sara Kendall, Cassaundra Shipman, Carol Bradford, Thomas Carey, Andrea Haddad, Jeffey Moyer, Lisa Peterson, Mark Prince, Laura Rozek, Gregory Wolf, Rayleen Bowman, Kwun M. Fong, Ian Yang, Robert Korst, W. Kimryn Rathmell, J. Leigh Fantacone-Campbell, Jeffrey A. Hooke, Albert J. Kovatich, Craig D. Shriver, John DiPersio, Bettina Drake, Ramaswamy Govindan, Sharon Heath, Timothy Ley, Brian Van Tine, Peter Westervelt, Mark A. Rubin, Jung Il Lee, Natália D. Aredes, Armaz Mariamidze, Anant Agrawal, Jaeil Ahn, Jordan Aissiou, Dimitris Anastassiou, Jesper B. Andersen, Jurandyr M. Andrade, Marco Antoniotti, Jon C. Aster, Donald Ayer, Matthew H. Bailey, Rohan Bareja, Adam J. Bass, Azfar Basunia, Oliver F. Bathe, Rebecca Batiste, Oliver Bear Don't Walk, Davide Bedognetti, Gloria Bertoli, Denis Bertrand, Bhavneet Bhinder, Gianluca Bontempi, Dante Bortone, Donald P. Bottaro, Paul Boutros, Kevin Brennan, Chaya Brodie, Scott Brown, Susan Bullman, Silvia Buonamici, Tomasz Burzykowski, Lauren Averett Byers, Fernando Camargo, Joshua D. Campbell, Francisco J. Candido dos Reis, Shaolong Cao, Maria Cardenas, Helio H.A. Carrara, Isabella Castiglioni, Anavaleria Castro, Claudia Cava, Michele Ceccarelli, Shengjie Chai, Kridsadakorn Chaichoompu, Matthew T. Chang, Han Chen, Haoran Chen, Hu Chen, Jian Chen, Jianhong Chen, Ken Chen, Ting-Wen Chen, Zhong Chen, Zhongyuan Chen, Hui Cheng, Hua-Sheng Chiu, Cai Chunhui, Giovanni Ciriello, Cristian Coarfa, Antonio Colaprico, Lee Cooper, Daniel Cui Zhou, Aedin C. Culhane, Christina Curtis, Patrycja Czerwińska, Aditya Deshpande, Lixia Diao, Michael Dill, Di Du, Charles G. Eberhart, James A. Eddy, Robert N. Eisenman, Mohammed Elanbari, Olivier Elemento, Kyle Ellrott, Manel Esteller, Farshad Farshidfar, Bin Feng, Camila Ferreira de Souza, Esla R. Flores, Steven Foltz, Mitchell T. Frederick, Qingsong Gao, Carl M. Gay, Zhongqi Ge, Andrew J. Gentles, Olivier Gevaert, David L. Gibbs, Adam Godzik, Abel Gonzalez-Perez, Marc T. Goodman, Dmitry A. Gordenin, Carla Grandori, Alex Graudenzi, Casey Greene, Justin Guinney, Margaret L. Gulley, Preethi H. Gunaratne, A. Ari Hakimi, Peter Hammerman, Leng Han, Holger Heyn, Le Hou, Donglei Hu, Kuan-lin Huang, Joerg Huelsken, Scott Huntsman, Peter Hurlin, Matthias Hüser, Antonio Iavarone, Marcin Imielinski, Mirazul Islam, Jacek Jassem, Peilin Jia, Cigall Kadoch, Andre Kahles, Benny Kaipparettu, Bozena Kaminska, Havish Kantheti, Rachel Karchin, Mostafa Karimi, Ekta Khurana, Pora Kim, Leszek J. Klimczak, Jia Yu Koh, Alexander Krasnitz, Nicole Kuderer, Tahsin Kurc, David J. Kwiatkowski, Teresa Laguna, Martin Lang, Anna Lasorella, Thuc D. Le, Adrian V. Lee, Ju-Seog Lee, Steve Lefever, Kjong Lehmann, Jake Leighton, Chunyan Li, Lei Li, Shulin Li, David Liu, Eric Minwei Liu, Jianfang Liu, Rongjie Liu, Yang Liu, William J.R. Longabaugh, Nuria Lopez-Bigas, Li Ma, Wencai Ma, Karen MacKenzie, Andrzej Mackiewicz, Dejan Maglic, Raunaq Malhotra, Tathiane M. Malta, Calena Marchand, R. Jay Mashl, Sylwia Mazurek, Pieter Mestdagh, Chase Miller, Marco Mina, Lopa Mishra, Younes Mokrab, Raymond Monnat, Jr., Nate Moore, Nathanael Moore, Loris Mularoni, Niranjan Nagarajan, Aaron M. Newman, Vu Nguyen, Michael L. Nickerson, Akinyemi I. Ojesina, Catharina Olsen, Sandra Orsulic, Tai-Hsien Ou Yang, James Palacino, Yinghong Pan, Elena Papaleo, Sagar Patil, Chandra Sekhar Pedamallu, Shouyong Peng, Xinxin Peng, Arjun Pennathur, Curtis R. Pickering, Christopher L. Plaisier, Laila Poisson, Eduard Porta-Pardo, Marcos Prunello, John L. Pulice, Charles Rabkin, Janet S. Rader, Kimal Rajapakshe, Aruna Ramachandran, Shuyun Rao, Xiayu Rao, Benjamin J. Raphael, Gunnar Rätsch, Brendan Reardon, Christopher J. Ricketts, Jason Roszik, Carlota Rubio-Perez, Ryan Russell, Anil Rustgi, Russell Ryan, Mohamad Saad, Thais Sabedot, Joel Saltz, Dimitris Samaras, Franz X. Schaub, Barbara G. Schneider, Adam Scott, Michael Seiler, Sara Selitsky, Sohini Sengupta, Jose A. Seoane, Jonathan S. Serody, Reid Shaw, Yang Shen, Tiago Silva, Pankaj Singh, I.K. Ashok Sivakumar, Christof Smith, Artem Sokolov, Junyan Song, Pavel Sumazin, Yutong Sun, Chayaporn Suphavilai, Najeeb Syed, David Tamborero, Alison M. Taylor, Teng Teng, Daniel G. Tiezzi, Collin Tokheim, Nora Toussaint, Mihir Trivedi, Kenneth T. Tsai, Aaron D. Tward, Eliezer Van Allen, John S. Van Arnam, Kristel Van Steen, Carter Van Waes, Christopher P. Vellano, Benjamin Vincent, Nam S. Vo, Vonn Walter, Chen Wang, Fang Wang, Jiayin Wang, Sophia Wang, Wenyi Wang, Yue Wang, Yumeng Wang, Zehua Wang, Zeya Wang, Zixing Wang, Gregory Way, Amila Weerasinghe, Michael Wells, Michael C. Wendl, Cecilia Williams, Joseph Willis, Denise Wolf, Karen Wong, Yonghong Xiao, Lu Xinghua, Bo Yang, Da Yang, Liuqing Yang, Kai Ye, Hiroyuki Yoshida, Lihua Yu, Sobia Zaidi, Huiwen Zhang, Min Zhang, Xiaoyang Zhang, Tianhao Zhao, Wei Zhao, Zhongming Zhao, Tian Zheng, Jane Zhou, Zhicheng Zhou, Hongtu
Footnotes
Publisher's Disclaimer: This is a PDF file of an unedited manuscript that has been accepted for publication. As a service to our customers we are providing this early version of the manuscript. The manuscript will undergo copyediting, typesetting, and review of the resulting proof before it is published in its final citable form. Please note that during the production process errors may be discovered which could affect the content, and all legal disclaimers that apply to the journal pertain.
Author contributions
L.D. and R.K. provided scientific direction and guided data analysis. E.P-P., M.H.B., S.S., and C.T. drafted the manuscript and L.D., M.C.W, R.K., and A.L. revised the manuscript. M.H.B., C.T., E.P-P., S.S., A.W., B.R., S.C., and A.C. generated figures. P.K-S.N, K.J.J, Z.W., and F.W performed experimental work and G.M. provided functional validation for somatic mutations. V.D.V., A.L., K.C., A.G., J.S., N.L-B., A.G-P., W.W.L., D.W., E.V.A., G.G., M.L., E.K., M.C.W., and H.L. contributed additional scientific input and manuscript editing. B.R., S.S., and A.L. provided translational medicine insights and figures and L.D., M.H.B., S.C., W-W. L., J.K., P.J.P, and I.C-C. contributed signatures analysis of hypermutators and microsatellite unstable tumors. S.S. and Z.W. compiled mutation validation figures and furnished additional writing. A.W., D.B., S.C., and A.C. performed RNA-Seq, copy number, and gene expression impact analyses and K.J.Y., C.S., J.H., D.C., N.N., C.R-P., D.T., L.M., E.M.L., Q.G., J.J.G., A.W., D.B., M.H.B., E.P-P. and C.T. were responsible for computations, including execution of all driver discovery tools. C.T., M.H.B., E.P-P. and M.C.W. developed algorithmic and statistical procedures for aggregation of results.
Declaration of Interests
The authors declare no competing interests.
References
- Adjei AA, Cohen RB, Franklin W, Morris C, Wilson D, Molina JR, Hanson LJ, Gore L, Chow L, Leong S. Phase I pharmacokinetic and pharmacodynamic study of the oral, small-molecule mitogen-activated protein kinase kinase 1/2 inhibitor AZD6244 (ARRY-142886) in patients with advanced cancers. Journal of clinical oncology. 2008;26:2139–2146. doi: 10.1200/JCO.2007.14.4956. [DOI] [PMC free article] [PubMed] [Google Scholar]
- Adzhubei I, Jordan DM, Sunyaev SR. Predicting functional effect of human missense mutations using PolyPhen - 2. Current protocols in human genetics. 2013:7.20. 21–27.20. 41. doi: 10.1002/0471142905.hg0720s76. [DOI] [PMC free article] [PubMed] [Google Scholar]
- Alexandrov LB, Nik-Zainal S, Wedge DC, Aparicio SA, Behjati S, Biankin AV, Bignell GR, Bolli N, Borg A, Børresen-Dale A-L. Signatures of mutational processes in human cancer. Nature. 2013;500:415–421. doi: 10.1038/nature12477. [DOI] [PMC free article] [PubMed] [Google Scholar]
- Ascierto PA, Schadendorf D, Berking C, Agarwala SS, van Herpen CM, Queirolo P, Blank CU, Hauschild A, Beck JT, St-Pierre A. MEK162 for patients with advanced melanoma harbouring NRAS or Val600 BRAF mutations: a non-randomised, open-label phase 2 study. The lancet oncology. 2013;14:249–256. doi: 10.1016/S1470-2045(13)70024-X. [DOI] [PubMed] [Google Scholar]
- Barbieri CE, Baca SC, Lawrence MS, Demichelis F, Blattner M, Theurillat J-P, White TA, Stojanov P, Van Allen E, Stransky N. Exome sequencing identifies recurrent SPOP, FOXA1 and MED12 mutations in prostate cancer. Nature genetics. 2012;44:685–689. doi: 10.1038/ng.2279. [DOI] [PMC free article] [PubMed] [Google Scholar]
- Bashashati A, Haffari G, Ding J, Ha G, Lui K, Rosner J, Huntsman DG, Caldas C, Aparicio SA, Shah SP. DriverNet: uncovering the impact of somatic driver mutations on transcriptional networks in cancer. Genome biology. 2012;13:R124. doi: 10.1186/gb-2012-13-12-r124. [DOI] [PMC free article] [PubMed] [Google Scholar]
- Bertrand D, Chng KR, Sherbaf FG, Kiesel A, Chia BK, Sia YY, Huang SK, Hoon DS, Liu ET, Hillmer A. Patient-specific driver gene prediction and risk assessment through integrated network analysis of cancer omics profiles. Nucleic acids research. 2015;43:e44–e44. doi: 10.1093/nar/gku1393. [DOI] [PMC free article] [PubMed] [Google Scholar]
- Biankin AV, Waddell N, Kassahn KS, Gingras M-C, Muthuswamy LB, Johns AL, Miller DK, Wilson PJ, Patch A-M, Wu J. Pancreatic cancer genomes reveal aberrations in axon guidance pathway genes. Nature. 2012;491:399–405. doi: 10.1038/nature11547. [DOI] [PMC free article] [PubMed] [Google Scholar]
- Brahmer JR, Tykodi SS, Chow LQ, Hwu W-J, Topalian SL, Hwu P, Drake CG, Camacho LH, Kauh J, Odunsi K. Safety and activity of anti–PD-L1 antibody in patients with advanced cancer. N Engl J Med. 2012;2012:2455–2465. doi: 10.1056/NEJMoa1200694. [DOI] [PMC free article] [PubMed] [Google Scholar]
- Brenan L, Andreev A, Cohen O, Pantel S, Kamburov A, Cacchiarelli D, Persky NS, Zhu C, Bagul M, Goetz EM. Phenotypic characterization of a comprehensive set of MAPK1/ERK2 missense mutants. Cell reports. 2016;17:1171–1183. doi: 10.1016/j.celrep.2016.09.061. [DOI] [PMC free article] [PubMed] [Google Scholar]
- Carter H, Chen S, Isik L, Tyekucheva S, Velculescu VE, Kinzler KW, Vogelstein B, Karchin R. Cancer-specific high-throughput annotation of somatic mutations: computational prediction of driver missense mutations. Cancer research. 2009;69:6660–6667. doi: 10.1158/0008-5472.CAN-09-1133. [DOI] [PMC free article] [PubMed] [Google Scholar]
- Carter H, Douville C, Stenson PD, Cooper DN, Karchin R. Identifying Mendelian disease genes with the variant effect scoring tool. BMC genomics. 2013;14:1. doi: 10.1186/1471-2164-14-S3-S3. [DOI] [PMC free article] [PubMed] [Google Scholar]
- Carter H, Marty R, Hofree M, Gross AM, Jensen J, Fisch KM, Wu X, DeBoever C, Van Nostrand EL, Song Y. Interaction landscape of inherited polymorphisms with somatic events in cancer. Cancer Discovery. 2017;7:410–423. doi: 10.1158/2159-8290.CD-16-1045. [DOI] [PMC free article] [PubMed] [Google Scholar]
- Carvajal RD, Sosman JA, Quevedo JF, Milhem MM, Joshua AM, Kudchadkar RR, Linette GP, Gajewski TF, Lutzky J, Lawson DH. Effect of selumetinib vs chemotherapy on progression-free survival in uveal melanoma: a randomized clinical trial. Jama. 2014;311:2397–2405. doi: 10.1001/jama.2014.6096. [DOI] [PMC free article] [PubMed] [Google Scholar]
- Chakravarty D, Gao J, Phillips S, Kundra R, Zhang H, Wang J, Rudolph JE, Yaeger R, Soumerai T, Nissan MH. OncoKB: a precision oncology knowledge base. JCO Precision Oncology. 2017;1:1–16. doi: 10.1200/PO.17.00011. [DOI] [PMC free article] [PubMed] [Google Scholar]
- Chen T, Wang Z, Zhou W, Chong Z, Meric-Bernstam F, Mills GB, Chen K. Hotspot mutations delineating diverse mutational signatures and biological utilities across cancer types. BMC genomics. 2016;17:394. doi: 10.1186/s12864-016-2727-x. [DOI] [PMC free article] [PubMed] [Google Scholar]
- Consortium G. The Genotype-Tissue Expression (GTEx) pilot analysis: Multitissue gene regulation in humans. Science. 2015;348:648–660. doi: 10.1126/science.1262110. [DOI] [PMC free article] [PubMed] [Google Scholar]
- Conway JR, Lex A, Gehlenborg N. UpSetR: An R Package For The Visualization Of Intersecting Sets And Their Properties. bioRxiv. 2017:120600. doi: 10.1093/bioinformatics/btx364. [DOI] [PMC free article] [PubMed] [Google Scholar]
- Cortes-Ciriano I, Lee S, Park W-Y, Kim T-M, Park PJ. A molecular portrait of microsatellite instability across multiple cancers. Nature Communications. 2017;8 doi: 10.1038/ncomms15180. [DOI] [PMC free article] [PubMed] [Google Scholar]
- Creixell P, Reimand J, Haider S, Wu G, Shibata T, Vazquez M, Mustonen V, Gonzalez-Perez A, Pearson J, Sander C. Pathway and network analysis of cancer genomes. Nature methods. 2015;12:615. doi: 10.1038/nmeth.3440. [DOI] [PMC free article] [PubMed] [Google Scholar]
- De Carvalho DD, Sharma S, You JS, Su S-F, Taberlay PC, Kelly TK, Yang X, Liang G, Jones PA. DNA methylation screening identifies driver epigenetic events of cancer cell survival. Cancer cell. 2012;21:655–667. doi: 10.1016/j.ccr.2012.03.045. [DOI] [PMC free article] [PubMed] [Google Scholar]
- Dees ND, Zhang Q, Kandoth C, Wendl MC, Schierding W, Koboldt DC, Mooney TB, Callaway MB, Dooling D, Mardis ER. MuSiC: identifying mutational significance in cancer genomes. Genome research. 2012;22:1589–1598. doi: 10.1101/gr.134635.111. [DOI] [PMC free article] [PubMed] [Google Scholar]
- Ding L, Ley TJ, Larson DE, Miller CA, Koboldt DC, Welch JS, Ritchey JK, Young MA, Lamprecht T, McLellan MD. Clonal evolution in relapsed acute myeloid leukaemia revealed by whole-genome sequencing. Nature. 2012;481:506–510. doi: 10.1038/nature10738. [DOI] [PMC free article] [PubMed] [Google Scholar]
- Ding L, Wendl MC, McMichael JF, Raphael BJ. Expanding the computational toolbox for mining cancer genomes. Nature Reviews Genetics. 2014;15:556–570. doi: 10.1038/nrg3767. [DOI] [PMC free article] [PubMed] [Google Scholar]
- Douville C, Carter H, Kim R, Niknafs N, Diekhans M, Stenson PD, Cooper DN, Ryan M, Karchin R. CRAVAT: cancer-related analysis of variants toolkit. Bioinformatics. 2013;29:647–648. doi: 10.1093/bioinformatics/btt017. [DOI] [PMC free article] [PubMed] [Google Scholar]
- Douville C, Masica DL, Stenson PD, Cooper DN, Gygax DM, Kim R, Ryan M, Karchin R. Assessing the Pathogenicity of Insertion and Deletion Variants with the Variant Effect Scoring Tool (VEST-Indel) Human mutation. 2016;37:28–35. doi: 10.1002/humu.22911. [DOI] [PMC free article] [PubMed] [Google Scholar]
- Dummer R, Schadendorf D, Ascierto PA, Arance A, Dutriaux C, Di Giacomo AM, Rutkowski P, Del Vecchio M, Gutzmer R, Mandala M. Binimetinib versus dacarbazine in patients with advanced NRAS-mutant melanoma (NEMO): a multicentre, open-label, randomised, phase 3 trial. The Lancet Oncology. 2017;18:435–445. doi: 10.1016/S1470-2045(17)30180-8. [DOI] [PubMed] [Google Scholar]
- Ellrott K, Bailey MH, Saksena G, Covington KR, Kandoth C, Stewart C, McLellan M, Sofia HJ, Hutter C, Getz G, et al. Automating Somatic Mutation calling for Ten Thousand Tumor Exomes. in review. [Google Scholar]
- Finn RD, Coggill P, Eberhardt RY, Eddy SR, Mistry J, Mitchell AL, Potter SC, Punta M, Qureshi M, Sangrador-Vegas A. The Pfam protein families database: towards a more sustainable future. Nucleic acids research. 2016;44:D279–D285. doi: 10.1093/nar/gkv1344. [DOI] [PMC free article] [PubMed] [Google Scholar]
- Frampton GM, Fichtenholtz A, Otto GA, Wang K, Downing SR, He J, Schnall-Levin M, White J, Sanford EM, An P. Development and validation of a clinical cancer genomic profiling test based on massively parallel DNA sequencing. Nature biotechnology. 2013;31:1023–1031. doi: 10.1038/nbt.2696. [DOI] [PMC free article] [PubMed] [Google Scholar]
- Futreal PA, Coin L, Marshall M, Down T, Hubbard T, Wooster R, Rahman N, Stratton MR. A census of human cancer genes. Nature Reviews Cancer. 2004;4:177–183. doi: 10.1038/nrc1299. [DOI] [PMC free article] [PubMed] [Google Scholar]
- Gagan J, Van Allen EM. Next-generation sequencing to guide cancer therapy. Genome medicine. 2015;7:80. doi: 10.1186/s13073-015-0203-x. [DOI] [PMC free article] [PubMed] [Google Scholar]
- Gao J, Chang MT, Johnsen HC, Gao SP, Sylvester BE, Sumer SO, Zhang H, Solit DB, Taylor BS, Schultz N. 3D clusters of somatic mutations in cancer reveal numerous rare mutations as functional targets. Genome medicine. 2017;9:4. doi: 10.1186/s13073-016-0393-x. [DOI] [PMC free article] [PubMed] [Google Scholar]
- Gonzalez-Perez A, Deu-Pons J, Lopez-Bigas N. Improving the prediction of the functional impact of cancer mutations by baseline tolerance transformation. Genome medicine. 2012;4:89. doi: 10.1186/gm390. [DOI] [PMC free article] [PubMed] [Google Scholar]
- Greenman C, Stephens P, Smith R, Dalgliesh GL, Hunter C, Bignell G, Davies H, Teague J, Butler A, Stevens C. Patterns of somatic mutation in human cancer genomes. Nature. 2007;446:153. doi: 10.1038/nature05610. [DOI] [PMC free article] [PubMed] [Google Scholar]
- Gryfe R, Kim H, Hsieh ET, Aronson MD, Holowaty EJ, Bull SB, Redston M, Gallinger S. Tumor microsatellite instability and clinical outcome in young patients with colorectal cancer. New England Journal of Medicine. 2000;342:69–77. doi: 10.1056/NEJM200001133420201. [DOI] [PubMed] [Google Scholar]
- Hoadley KA, Yau C, Wolf DM, Cherniack AD, Tamborero D, Ng S, Leiserson MD, Niu B, McLellan MD, Uzunangelov V. Multiplatform analysis of 12 cancer types reveals molecular classification within and across tissues of origin. Cell. 2014;158:929–944. doi: 10.1016/j.cell.2014.06.049. [DOI] [PMC free article] [PubMed] [Google Scholar]
- Iams WT, Sosman JA, Chandra S. Novel targeted therapies for metastatic melanoma. The Cancer Journal. 2017;23:54–58. doi: 10.1097/PPO.0000000000000242. [DOI] [PubMed] [Google Scholar]
- Ionita-Laza I, McCallum K, Xu B, BUXBAUM J. A spectral approach integrating functional genomic annotations for coding and noncoding variants. Nature genetics. 2016;48:214. doi: 10.1038/ng.3477. [DOI] [PMC free article] [PubMed] [Google Scholar]
- Jagadeesh KA, Wenger AM, Berger MJ, Guturu H, Stenson PD, Cooper DN, Bernstein JA, Bejerano G. M-CAP eliminates a majority of variants of uncertain significance in clinical exomes at high sensitivity. Nature genetics. 2016;48:1581–1586. doi: 10.1038/ng.3703. [DOI] [PubMed] [Google Scholar]
- Kandoth C, McLellan MD, Vandin F, Ye K, Niu B, Lu C, Xie M, Zhang Q, McMichael JF, Wyczalkowski MA. Mutational landscape and significance across 12 major cancer types. Nature. 2013;502:333–339. doi: 10.1038/nature12634. [DOI] [PMC free article] [PubMed] [Google Scholar]
- Kim T-M, Laird PW, Park PJ. The landscape of microsatellite instability in colorectal and endometrial cancer genomes. Cell. 2013;155:858–868. doi: 10.1016/j.cell.2013.10.015. [DOI] [PMC free article] [PubMed] [Google Scholar]
- Kircher M, Witten DM, Jain P, O'roak BJ, Cooper GM, Shendure J. A general framework for estimating the relative pathogenicity of human genetic variants. Nature genetics. 2014;46:310–315. doi: 10.1038/ng.2892. [DOI] [PMC free article] [PubMed] [Google Scholar]
- Krzywinski M, Schein J, Birol I, Connors J, Gascoyne R, Horsman D, Jones SJ, Marra MA. Circos: an information aesthetic for comparative genomics. Genome research. 2009;19:1639–1645. doi: 10.1101/gr.092759.109. [DOI] [PMC free article] [PubMed] [Google Scholar]
- Lawrence MS, Stojanov P, Mermel CH, Robinson JT, Garraway LA, Golub TR, Meyerson M, Gabriel SB, Lander ES, Getz G. Discovery and saturation analysis of cancer genes across 21 tumour types. Nature. 2014;505:495–501. doi: 10.1038/nature12912. [DOI] [PMC free article] [PubMed] [Google Scholar]
- Lawrence MS, Stojanov P, Polak P, Kryukov GV, Cibulskis K, Sivachenko A, Carter SL, Stewart C, Mermel CH, Roberts SA. Mutational heterogeneity in cancer and the search for new cancer-associated genes. Nature. 2013;499:214–218. doi: 10.1038/nature12213. [DOI] [PMC free article] [PubMed] [Google Scholar]
- Le DT, Uram JN, Wang H, Bartlett BR, Kemberling H, Eyring AD, Skora AD, Luber BS, Azad NS, Laheru D. PD-1 blockade in tumors with mismatch-repair deficiency. New England Journal of Medicine. 2015;372:2509–2520. doi: 10.1056/NEJMoa1500596. [DOI] [PMC free article] [PubMed] [Google Scholar]
- Lek M, Karczewski K, Minikel E, Samocha K, Banks E, Fennell T, O'Donnell-Luria A, Ware J, Hill A, Cummings B. Analysis of protein-coding genetic variation in 60,706 humans. BioRxiv. 2016:030338. doi: 10.1038/nature19057. [DOI] [PMC free article] [PubMed] [Google Scholar]
- Mao Y, Chen H, Liang H, Meric-Bernstam F, Mills GB, Chen K. CanDrA: cancer-specific driver missense mutation annotation with optimized features. PloS one. 2013;8:e77945. doi: 10.1371/journal.pone.0077945. [DOI] [PMC free article] [PubMed] [Google Scholar]
- McGranahan N, Favero F, de Bruin EC, Birkbak NJ, Szallasi Z, Swanton C. Clonal status of actionable driver events and the timing of mutational processes in cancer evolution. Science translational medicine. 2015;7:283ra254–283ra254. doi: 10.1126/scitranslmed.aaa1408. [DOI] [PMC free article] [PubMed] [Google Scholar]
- Mularoni L, Sabarinathan R, Deu-Pons J, Gonzalez-Perez A, López-Bigas N. OncodriveFML: a general framework to identify coding and non-coding regions with cancer driver mutations. Genome biology. 2016;17:128. doi: 10.1186/s13059-016-0994-0. [DOI] [PMC free article] [PubMed] [Google Scholar]
- Ng PC, Henikoff S. Accounting for human polymorphisms predicted to affect protein function. Genome research. 2002;12:436–446. doi: 10.1101/gr.212802. [DOI] [PMC free article] [PubMed] [Google Scholar]
- Ng PK-S, Li J, Jeong KJ, Shao S, Chen H, Tsang YH, Sengupta S, Wang Z, Bhavana VH, Tran R, et al. Systematic Functional Annotation of Somatic Mutations in Cancer. Cancer cell. 2018 doi: 10.1016/j.ccell.2018.01.021. In press. [DOI] [PMC free article] [PubMed] [Google Scholar]
- Nik-Zainal S, Davies H, Staaf J, Ramakrishna M, Glodzik D, Zou X, Martincorena I, Alexandrov LB, Martin S, Wedge DC. Landscape of somatic mutations in 560 breast cancer whole-genome sequences. Nature. 2016;534:47–54. doi: 10.1038/nature17676. [DOI] [PMC free article] [PubMed] [Google Scholar]
- Niknafs N, Kim D, Kim R, Diekhans M, Ryan M, Stenson PD, Cooper DN, Karchin R. MuPIT interactive: webserver for mapping variant positions to annotated, interactive 3D structures. Human genetics. 2013;132:1235–1243. doi: 10.1007/s00439-013-1325-0. [DOI] [PMC free article] [PubMed] [Google Scholar]
- Niu B, Scott AD, Sengupta S, Bailey MH, Batra P, Ning J, Wyczalkowski MA, Liang W-W, Zhang Q, McLellan MD. Protein-structure-guided discovery of functional mutations across 19 cancer types. Nature genetics. 2016 doi: 10.1038/ng.3586. [DOI] [PMC free article] [PubMed] [Google Scholar]
- Niu B, Ye K, Zhang Q, Lu C, Xie M, McLellan MD, Wendl MC, Ding L. MSIsensor: microsatellite instability detection using paired tumor-normal sequence data. Bioinformatics. 2013;30:1015–1016. doi: 10.1093/bioinformatics/btt755. [DOI] [PMC free article] [PubMed] [Google Scholar]
- Pathways, I.C.G.C.M., and Group, C.S.o.t.B.A.W. Computational approaches to identify functional genetic variants in cancer genomes. Nature methods. 2013;10:723–729. doi: 10.1038/nmeth.2562. [DOI] [PMC free article] [PubMed] [Google Scholar]
- Pieper U, Webb BM, Barkan DT, Schneidman-Duhovny D, Schlessinger A, Braberg H, Yang Z, Meng EC, Pettersen EF, Huang CC. ModBase, a database of annotated comparative protein structure models, and associated resources. Nucleic acids research. 2011;39:D465–D474. doi: 10.1093/nar/gkq1091. [DOI] [PMC free article] [PubMed] [Google Scholar]
- Porta-Pardo E, Garcia-Alonso L, Hrabe T, Dopazo J, Godzik A. A pan-cancer catalogue of cancer driver protein interaction interfaces. PLoS Comput Biol. 2015;11:e1004518. doi: 10.1371/journal.pcbi.1004518. [DOI] [PMC free article] [PubMed] [Google Scholar]
- Porta-Pardo E, Godzik A. e-Driver: a novel method to identify protein regions driving cancer. Bioinformatics. 2014:btu499. doi: 10.1093/bioinformatics/btu499. [DOI] [PMC free article] [PubMed] [Google Scholar]
- Prilusky J, Felder CE, Zeev-Ben-Mordehai T, Rydberg EH, Man O, Beckmann JS, Silman I, Sussman JL. FoldIndex©: a simple tool to predict whether a given protein sequence is intrinsically unfolded. Bioinformatics. 2005;21:3435–3438. doi: 10.1093/bioinformatics/bti537. [DOI] [PubMed] [Google Scholar]
- Pritchard CC, Salipante SJ, Koehler K, Smith C, Scroggins S, Wood B, Wu D, Lee MK, Dintzis S, Adey A. Validation and implementation of targeted capture and sequencing for the detection of actionable mutation, copy number variation, and gene rearrangement in clinical cancer specimens. The Journal of Molecular Diagnostics. 2014;16:56–67. doi: 10.1016/j.jmoldx.2013.08.004. [DOI] [PMC free article] [PubMed] [Google Scholar]
- Raimondi F, Singh G, Betts MJ, Apic G, Vukotic R, Andreone P, Stein L, Russell RB. Insights into cancer severity from biomolecular interaction mechanisms. Scientific reports. 2016;6 doi: 10.1038/srep34490. [DOI] [PMC free article] [PubMed] [Google Scholar]
- Reimand J, Bader GD. Systematic analysis of somatic mutations in phosphorylation signaling predicts novel cancer drivers. Molecular systems biology. 2013;9:637. doi: 10.1038/msb.2012.68. [DOI] [PMC free article] [PubMed] [Google Scholar]
- Reva B, Antipin Y, Sander C. Predicting the functional impact of protein mutations: application to cancer genomics. Nucleic acids research. 2011;39:e118–e118. doi: 10.1093/nar/gkr407. [DOI] [PMC free article] [PubMed] [Google Scholar]
- Rizvi NA, Hellmann MD, Snyder A, Kvistborg P, Makarov V, Havel JJ, Lee W, Yuan J, Wong P, Ho TS. Mutational landscape determines sensitivity to PD-1 blockade in non–small cell lung cancer. Science. 2015;348:124–128. doi: 10.1126/science.aaa1348. [DOI] [PMC free article] [PubMed] [Google Scholar]
- Roberts SA, Gordenin DA. Hypermutation in human cancer genomes: footprints and mechanisms. Nature Reviews Cancer. 2014;14:786–800. doi: 10.1038/nrc3816. [DOI] [PMC free article] [PubMed] [Google Scholar]
- Schulze K, Imbeaud S, Letouzé E, Alexandrov LB, Calderaro J, Rebouissou S, Couchy G, Meiller C, Shinde J, Soysouvanh F. Exome sequencing of hepatocellular carcinomas identifies new mutational signatures and potential therapeutic targets. Nature genetics. 2015;47:505–511. doi: 10.1038/ng.3252. [DOI] [PMC free article] [PubMed] [Google Scholar]
- Shihab HA, Gough J, Cooper DN, Stenson PD, Barker GL, Edwards KJ, Day IN, Gaunt TR. Predicting the functional, molecular, and phenotypic consequences of amino acid substitutions using hidden Markov models. Human mutation. 2013;34:57–65. doi: 10.1002/humu.22225. [DOI] [PMC free article] [PubMed] [Google Scholar]
- Stephens PJ, Tarpey PS, Davies H, Van Loo P, Greenman C, Wedge DC, Nik-Zainal S, Martin S, Varela I, Bignell GR. The landscape of cancer genes and mutational processes in breast cancer. Nature. 2012;486:400–404. doi: 10.1038/nature11017. [DOI] [PMC free article] [PubMed] [Google Scholar]
- Tamborero D, Gonzalez-Perez A, Lopez-Bigas N. OncodriveCLUST: exploiting the positional clustering of somatic mutations to identify cancer genes. Bioinformatics. 2013a;29:2238–2244. doi: 10.1093/bioinformatics/btt395. [DOI] [PubMed] [Google Scholar]
- Tamborero D, Gonzalez-Perez A, Perez-Llamas C, Deu-Pons J, Kandoth C, Reimand J, Lawrence MS, Getz G, Bader GD, Ding L. Comprehensive identification of mutational cancer driver genes across 12 tumor types. Scientific reports. 2013b;3 doi: 10.1038/srep02650. [DOI] [PMC free article] [PubMed] [Google Scholar]
- Thorsson V, Gibbs DL, Brown SD, Wolf D, Bortone DS, Yang T-HO, Porta-Pardo E, Gao G, Eddy JA, Plaisier CL, et al. The immune landscape of cancer. in review. [Google Scholar]
- Tokheim C, Bhattacharya R, Niknafs N, Gygax DM, Kim R, Ryan M, Masica DL, Karchin R. Exome-scale discovery of hotspot mutation regions in human cancer using 3D protein structure. Cancer research. 2016a;76:3719–3731. doi: 10.1158/0008-5472.CAN-15-3190. [DOI] [PMC free article] [PubMed] [Google Scholar]
- Tokheim CJ, Papadopoulos N, Kinzler KW, Vogelstein B, Karchin R. Evaluating the evaluation of cancer driver genes. Proceedings of the National Academy of Sciences. 2016b:201616440. doi: 10.1073/pnas.1616440113. [DOI] [PMC free article] [PubMed] [Google Scholar]
- Torkamani A, Schork NJ. Prediction of cancer driver mutations in protein kinases. Cancer research. 2008;68:1675–1682. doi: 10.1158/0008-5472.CAN-07-5283. [DOI] [PubMed] [Google Scholar]
- Van Allen EM, Wagle N, Stojanov P, Perrin DL, Cibulskis K, Marlow S, Jane-Valbuena J, Friedrich DC, Kryukov G, Carter SL. Whole-exome sequencing and clinical interpretation of formalin-fixed, paraffin-embedded tumor samples to guide precision cancer medicine. Nature medicine. 2014;20:682–688. doi: 10.1038/nm.3559. [DOI] [PMC free article] [PubMed] [Google Scholar]
- Vogelstein B, Kinzler KW. Cancer genes and the pathways they control. Nature medicine. 2004;10:789. doi: 10.1038/nm1087. [DOI] [PubMed] [Google Scholar]
- Vogelstein B, Papadopoulos N, Velculescu VE, Zhou S, Diaz LA, Kinzler KW. Cancer genome landscapes. science. 2013;339:1546–1558. doi: 10.1126/science.1235122. [DOI] [PMC free article] [PubMed] [Google Scholar]
- Wang K, Li M, Hakonarson H. ANNOVAR: functional annotation of genetic variants from high-throughput sequencing data. Nucleic acids research. 2010;38:e164–e164. doi: 10.1093/nar/gkq603. [DOI] [PMC free article] [PubMed] [Google Scholar]
- Watson IR, Takahashi K, Futreal PA, Chin L. Emerging patterns of somatic mutations in cancer. Nature reviews Genetics. 2013;14:703–718. doi: 10.1038/nrg3539. [DOI] [PMC free article] [PubMed] [Google Scholar]
- Wong WC, Kim D, Carter H, Diekhans M, Ryan MC, Karchin R. CHASM and SNVBox: toolkit for detecting biologically important single nucleotide mutations in cancer. Bioinformatics. 2011;27:2147–2148. doi: 10.1093/bioinformatics/btr357. [DOI] [PMC free article] [PubMed] [Google Scholar]
- Wu G, Feng X, Stein L. A human functional protein interaction network and its application to cancer data analysis. Genome biology. 2010;11:R53. doi: 10.1186/gb-2010-11-5-r53. [DOI] [PMC free article] [PubMed] [Google Scholar]
- Yoshihara K, Wang Q, Torres-Garcia W, Zheng S, Vegesna R, Kim H, Verhaak R. The landscape and therapeutic relevance of cancer-associated transcript fusions. Oncogene. 2014 doi: 10.1038/onc.2014.406. [DOI] [PMC free article] [PubMed] [Google Scholar]
- Zack TI, Schumacher SE, Carter SL, Cherniack AD, Saksena G, Tabak B, Lawrence MS, Zhang C-Z, Wala J, Mermel CH. Pan-cancer patterns of somatic copy number alteration. Nature genetics. 2013;45:1134–1140. doi: 10.1038/ng.2760. [DOI] [PMC free article] [PubMed] [Google Scholar]
Associated Data
This section collects any data citations, data availability statements, or supplementary materials included in this article.
Supplementary Materials
Figure S1: MAF Filtering and Power comparison. Related to Figure 1. (A) Overall schema showing how we used the different algorithms and the input from the literature to identify our cancer driver gene consensus list and the driver mutations. (B) Fraction of samples filtered through three quality assurance filters: a mutation call filter, hypermutated samples, and samples excluded by pathology review. Numbers above bars indicate the number of samples completely dropped. N refers to the total samples before filtering. (C) Statistical power analysis for detection of driver genes at defined fraction of tumor samples above the background mutation rate (effect size). Circles indicate each of 12 cancer types or all cancer types together (“PANCAN”) from the original TCGA analysis of 12 cancer types (PanCan-12) placed according to the study sample size and median background mutation rate across samples.
Figure S2: Consensus Gene scores and SMG filtering. Related to Figure 1 and Figure 2. (A) Left, outlier detection was performed on a per analysis and method basis. Outliers were marked (red) based on the quasi-majority of three criteria: (1) low concordance with known cancer genes from Vogelstein et al (lower than median); (2) high divergence of p-value distribution from theoretical expectation (higher than median); and (3) abnormally high number of significant genes (>1.5× the interquartile range above the third quartile). The first two criteria were assessed based on the other tools within a single analysis, while the third criterion was assessed based on the same tool’s results over all the individual cancer types (excluding the PanCancer analysis). Right, example calculation of the gene consensus score for ARID1A in the cancer type LIHC. A result from an outlier is down weighted, receiving a weight of 0.5 instead of 1.0. The gene consensus score is the sum of weights for tools finding that gene as significant. (B) Overlap of consensus gene list with prior TCGA marker papers. (C) Likely false positives were detected with a high Linear Discriminant Analysis (LDA) score threshold representing 90% sensitivity for keeping associations found in Cancer Gene Census genes. LDA was trained to distinguish common false positives in exome sequencing from previous TCGA PanCancer marker papers. The LDA threshold was only applied to the potential source of false positive genes. (D) Fraction of marker paper genes highlighted in the main text that were also found in our consensus gene list. (E) Fraction of our consensus gene list found in previous TCGA marker papers. (F) Fraction of associations found in the Cancer Gene Census (CGC) that were either found only in the consensus gene list or TCGA marker paper. (G) Four heatmaps indicate the relationship between algorithms used in driver gene discovery for 4 cancer types GBM, LIHC, OV, UCEC (left to right). Pairwise Pearson 2-tailed correlation coefficients were calculated from driver prediction p-values generated by each tool and in each cancer type. Strength of the correlation coefficient (R) is displayed in colors ranging from yellow (strong) to blue (weak).
Figure S3: Characteristics of consensus genes. Related to Figure 2. (A) Predictive power of each individual driver gene detection method (in gray) and of the weighted and weighted scores (in orange). The predictive power was measured as prAUC, using all the genes in the Cancer Gene Census and a set that additionally excludes Cancer Genome Landscape genes used in outlier detection. Error bars, calculated by bootstrapping, indicate one standard deviation. (B) The number of consensus genes in each cancer type positively correlated with the average mutation burden. Shaded area indicates 95% bootstrapped confidence interval. (C) Given the variability in powered effect size (fraction of mutated samples above background with 90% power) in this study, there is a negative but not significant correlation with the number of consensus genes in each cancer type. COAD and READ were excluded because analysis was performed separately, but the final consensus genes were merged. (D) Pearson correlation between the number driver genes identified and median purity was calculated and plotted. (E) Pearson correlation between the number driver genes identified and mean purity was calculated and plotted. Summary statistics for p-value and r-squared value are reported in the top right corner of panels D and E. (F) Percent of samples containing a non-silent mutation stratified by cancer type. The red line indicates the median across cancer types (left) and average number of non-silent mutations in consensus genes per sample (right). (G) Pie chart showing percent of consensus genes which are found in the Cancer Gene Census with annotations for small somatic mutations (missense, splice site, indel, and nonsense) (H) Consensus genes showed a higher probability for loss-of-function intolerance and missense mutation constraint of germline mutations based on ExAC(Lek et al., 2016) and were expressed (RPKM>1) in a wider number of tissues from GTeX (version 6) (Consortium, 2015). Given the high correlation of gene expression in the 11 brain regions assessed from GTEx, we took the median of multiple brain tissues, as done in Lek et al., 2016.
Figure S4: Molecular properties of cancer driver genes. Related to Figure 2: (A) Hierarchical clustering of the gene consensus scores for genes that were found in more than one cancer type. The correlation distance metric and average linkage was used. Each gene cluster was tested for enrichment in three groups of cancer types, in order: Pan-squamous (BLCA, CESC, LUSC, HNSC, and ESCA), Pan-gynecological (UCEC, UCS, CESC, OV, and BRCA), and Pan-gastrointestinal (STAD, COADREAD, ESCA, and PAAD). Significant gene clusters are based on a permutation test assessing the total gene consensus score (10,000 iterations) and are progressively colored gray (not significant), blue (Adjusted P<0.05), green (Adjusted P < 0.01), and red (Adjusted P < 0.001). P values were multiple test corrected across all genes using the Benjamini-Hochberg FDR method. Gene clusters are shown as distinct colors in the first column of the row annotation bar. Clusters of genes were defined based on cutting the dendrogram at a depth chosen by manual inspection. (B) Percentage of consensus genes predicted as either oncogene (brown), tumor suppressor gene (green), or unknown (gray) by the 20/20+ algorithm, an improved version of the 20/20 rule(Vogelstein et al., 2013). The 20/20+ algorithm uses a supervised-learning approach (random forests) and bases predictions on the mutational patterns observed within a gene. “Likely” and “Possible” statuses were determined at a threshold of 0.05 for q-value (Benjamini-Hochberg method) and p-value, respectively. Consensus genes were designated as “Unknown” if they did not meet these thresholds. N represents the number of significant genes in each cancer type.
Figure S5: Characteristics and implementation of driver mutation analysis. Related to Figure 3. Eight sequence-based tools scored missense mutations to prioritize likely driver mutations over passenger mutations. (A) The absolute Spearman correlation between different sequence-based tools is shown, where tools are arranged in order by hierarchical clustering using a Euclidean distance metric. Tools that distinguish pathogenic missense mutations from neutral polymorphisms are labeled “population-based” (red), while tools focused on distinguishing passenger somatic missense mutations from cancer drivers are colored blue. A consensus score (named Combined Tool Adjusted Total—CTAT) for the “population-based” tools and “cancer-focused” tools was developed. (B) Receiver operator curves (ROC) compared CTAT-population and CTAT-cancer scores to 8 sequence-based tools. We used OncoKB annotation of “Oncogenic” and “Likely Oncogenic” vs. all other missense mutations in consensus genes as a benchmark. Area under the curve (AUC) calculations are presented for each of the individual 8 sequence-based tools and two sequence-based consensus approaches. We determined the optimal score threshold based on balanced accuracy (red dashed line) for (C) CTAT-population (left) and CTAT-cancer (right). Missense mutation hotspots were also detected based on four structural tools that utilize three-dimensional protein structures. (D) The percentage of missense mutations labeled as “Oncogenic” or “Likely Oncogenic” in OncoKB steadily increased with greater number of structural tools, indicating an amino acid residue was a hotspot. (E) Fraction of unique missense mutations in this study either in or not in the OncoKB, which is stratified by the number of mutation-level approaches in agreement (Population-based, Cancer-focused, and Structural clustering). The gray line separates where mutations were found in our consensus gene list (not found, manually rescued, or official).
Figure S6: Relationship between hypermutated samples and immune-system markers. Related to Figure 5. RNA-Seq abundance of different immune biomarkers for MSI phenotypes defined by MSIsensor. Stars indicate significance levels from a two-sided t-test to calculate p-values (* < 0.05, ** < 0.01, *** < 0.001) for BRCA (A), CESC (B) and LUSC (C).
Figure S7: On-label/off-label calculations for druggable mutations in cancer. Related to Figure 6: Missense mutations from consensus gene calling were annotated using the DEPO database. Here the proportion of samples in a cancer type (x-axis) with on-label (blue) or off-label (red) therapeutic options are provided for specific missense mutations (y-axis). Briefly, on-label refers to mutation specific treatments that have been clinically tested for a given cancer type. Off-label designations refer to potential drug therapies not heavily tested for said cancer types. Only druggable mutations present in the largest number of tumor samples across the TCGA cohort are displayed.
Table S1: Final gene consensus list. Related to Figure 2.
Table S2: Biological processes and pathways associated with each driver gene. Related to Figure 2.
Table S3: Overlap between our consensus driver gene list and recent publications. Related to Figure 2.
Table S4: Mutations shared by all three structural level tools. Related to Figure 3 and Figure 4.
Table S5: Hypermutator samples and MSI and MMR genes frequencies. Related to Figure 5.
Table S6: Samples removed by filtering criteria. Related to Figure 1.
Table S7: Genes used to train LDA. Related to Figure S2.