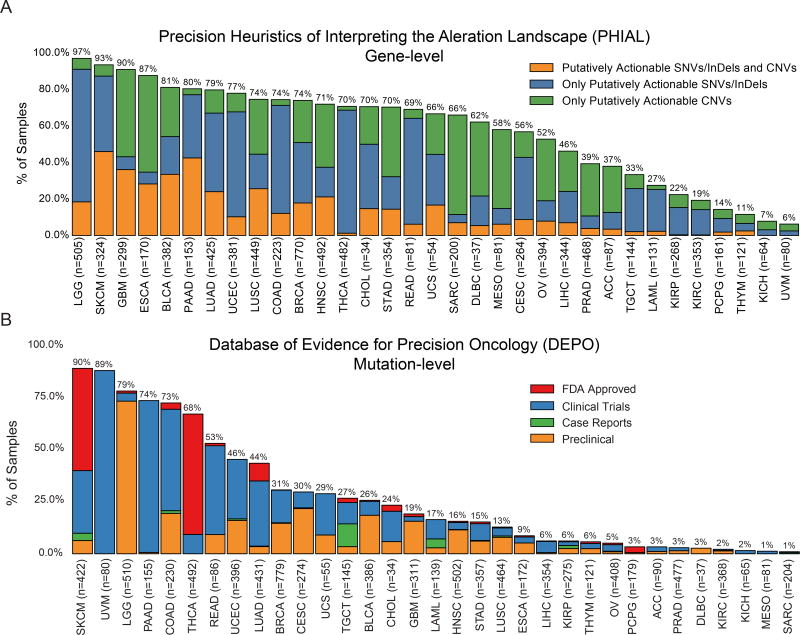
Figure 6. Putative actionability across TCGA studies.
(A) Percentage of samples (y-axis) with at least 1 putatively actionable SNV/indel/CNV (orange), SNV/indel (blue), and CNV only (green) for each cancer type (x-axis) from the TARGET database. Sample size is also given for each cancer type in x-axis labels. Only 8,775 samples are represented due to limitations of copy number data. (B) Percentage of samples (y-axis) with a druggable mutation (missense, indel, frameshift, and nonsense) from DEPO in each cancer type (x-axis) at various stages of approval: FDA approved (red), Clinical Trials (blue), Case Reports (green), and Preclinical (orange). 9079 samples are represented. See also Figure S7.

