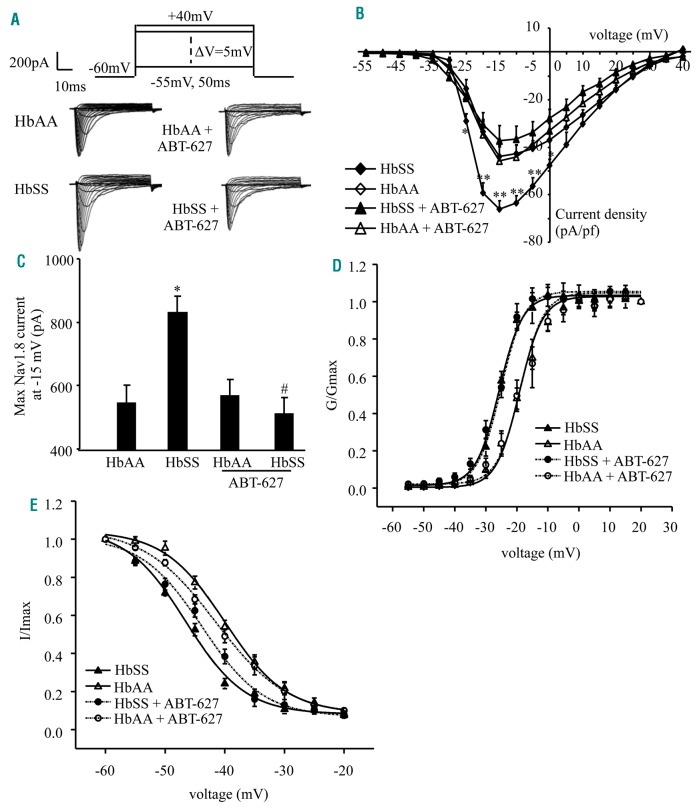
Figure 7.
Nav1.8 channel activity increases in Townes HbSS DRG neurons. (A) Representative traces of Nav1.8 in small DRG neurons from the HbAA mice, HbSS mice, and these mice injected with ABT-627. (B) I-V curves in small DRG neurons from HbAA mice (24 neurons), HbSS mice (21 neurons), HbAA mice given ABT-627 (21 neurons), and HbSS mice given ABT-627 (23 neurons). *P<0.05, **P<0.01 vs. the corresponding HbAA group. (C) When tested at −15mV, HbSS mice exhibit an increase in Nav1.8 current in small DRG neurons compared to HbAA mice. This increase is abolished in HbSS mice given ABT-627. n=25 neurons for the HbAA group, 22 for the HbSS group, 21 for the HbAA with ABT-627 group, and 23 for the HbSS with ABT-627 group. *P<0.05 vs. the HbAA group. #P<0.05 vs. the HbSS group. (D) Activation curve for Nav1.8. Curves are fitted by Boltzmann function. E0.5 = −20.35 ± 1.16 mV for the HbAA group (n = 21 neurons), −24.79 ± 0.93 mV for the HbSS group (n=24 neurons), −21.34 ± 0.65 mV for the HbAA with ABT-627 group (n=21 neurons), and −24.37 ± 0.82 mV for the HbSS with ABT-627 group (n=23 neurons). (E) Inactivation curve for Nav1.8. Curves are fitted by Boltzmann function. E0.5 = −37.56 ± 1.32mV for the HbAA group (n=27 neurons), −45.80 ± 1.80 mV for the HbSS group (n=24 neurons), −39.79 ± 1.11 mV for the HbAA with ABT-627 group (n=19 neurons), and −41.05 ± 1.86 mV for the HbSS with ABT-627 group (n=24 neurons).

