

Abstract
In this study, we examined the molecular and functional characterization of choline uptake in the human esophageal cancer cells. In addition, we examined the influence of various drugs on the transport of [3H]choline, and explored the possible correlation between the inhibition of choline uptake and apoptotic cell death. We found that both choline transporter-like protein 1 (CTL1) and CTL2 mRNAs and proteins were highly expressed in esophageal cancer cell lines (KYSE series). CTL1 and CTL2 were located in the plasma membrane and mitochondria, respectively. Choline uptake was saturable and mediated by a single transport system, which is both Na+-independent and pH-dependent. Choline uptake and cell viability were inhibited by various cationic drugs. Furthermore, a correlation analysis of the potencies of 47 drugs for the inhibition of choline uptake and cell viability showed a strong correlation. Choline uptake inhibitors and choline deficiency each inhibited cell viability and increased caspase-3/7 activity. We conclude that extracellular choline is mainly transported via a CTL1. The functional inhibition of CTL1 by cationic drugs could promote apoptotic cell death. Furthermore, CTL2 may be involved in choline uptake in mitochondria, which is the rate-limiting step in S-adenosylmethionine (SAM) synthesis and DNA methylation. Identification of this CTL1- and CTL2-mediated choline transport system provides a potential new target for esophageal cancer therapy.
Keywords: Choline, Transporter, Esophageal cancer, Apoptotic cell death, Caspase-3/7
INTRODUCTION
The incidence and mortality of esophageal cancer rank eighth and sixth, respectively, among common malignancies worldwide (Zhang, 2013). Risk factors for esophageal cancer include drinking alcohol and smoking (Xu, 2009). Indeed, people who drink and smoke are 30 times more likely to develop esophageal cancer than those who do not have these habits. The most common sites of esophageal cancer are the middle intrathoracic esophagus (about 50%), lower intrathoracic esophagus (about 25%), upper intrathoracic esophagus (about 15%), and cervical esophagus (about 5%) (Tachimori et al., 2016). While the histologic type is mainly squamous cell carcinoma, the incidence of adenocarcinoma that is caused by reflux esophagitis is increasing (Tachimori et al., 2016). Therapy for esophageal cancer includes surgical treatment, chemotherapy and radiotherapy. Recently, however, the treatment outcome with surgery has plateaued. Thus, multimodal therapy that combines chemotherapy and radiotherapy is necessary to improve the treatment outcome. Therefore, the target molecule in novel esophageal cancer therapy needs to be identified.
Choline is a quaternary amine that is essential for all cells. It is used as a precursor of both the neurotransmitter acetylcholine and S-adenosylmethionine (SAM), a methyl donor, and is needed for the synthesis of the major membrane phospholipids phosphatidylcholine (PC) and sphingomyelin (Michel and Bakovic, 2012). Choline affects the expression of genes involved in cell proliferation, differentiation, and apoptosis in both normal cells and cancer cells. In addition, choline uptake is the rate-limiting step in cell proliferation and differentiation (Inazu, 2014). Tumors, including esophageal tumors, are characterized by increased cell membrane synthesis. Since tumor cells require a large amount of choline, we can assume that esophageal tumors show a higher uptake of choline than the surrounding esophageal normal tissue. The study of choline transport and the characteristics of choline transporters is important if we wish to understand the mechanism that underlies membrane synthesis and cell signaling.
The role of positron emission tomography (PET) is rapidly expanding. In particular, choline PET and choline PET-computed tomography (CT) are now commonly performed clinically (García et al., 2014). Choline PET has been shown to be highly effective for imaging several tumor types, including prostate carcinoma, brain tumor, lung metastasis from esophageal cancer, and mediastinal lymph node metastases. Choline PET can also be used to differentiate between malignant and benign lesions in various regions of the body, including the brain, head, bone, and soft tissue (Tian et al., 2004). With regard to esophageal cancer, choline PET may enable the early diagnosis of an unsuspected esophageal carcinoma (Bertagna et al., 2014). Choline PET is more effective than 2-deoxy-2-[fluorine-18]fluoro-D-glucose (18F-FDG) PET for detecting very small metastases localized in the mediastinum (Liu et al., 2002). Further, a recent in vitro study suggested that choline PET might be a useful indicator of the response to chemotherapy agents that act by inhibiting signal transduction (Gllies and Morse, 2005). Previous studies have demonstrated abnormalities in choline uptake and choline phospholipid metabolism in cancer cells based on imaging by magnetic resonance spectroscopy (MRS) (Eliyahu et al., 2007; Glunde et al., 2011). The aberrant choline metabolism in cancer cells is strongly correlated with the progression of malignancy (Glunde et al., 2006). Thus, choline uptake through choline transporters is both the rate-limiting step in choline phospholipid metabolism, and a prerequisite for cancer cell proliferation. However, the uptake of choline and the functional expression of choline transporters in human cancer including esophageal cancer are poorly understood.
The choline transport system has been categorized into three transporter families: high-affinity choline transporter 1 (CHT1), choline transporter-like proteins (CTLs), and polyspecific organic cation transporters (OCTs). CHT1 is a Na+-dependent that is thought to play a role in cholinergic neurons. The function of CHT1 is highly sensitive to the choline uptake inhibitor, hemicholinium-3 (HC-3). The CTL family consist of five genes, CTL1–5, and CTL1 is the predominant member of this family. CTL1 is Na+-independent, and is inhibited by a high concentration of HC-3 (Michel and Bakovic, 2012; Inazu, 2014). CTL1 and CTL2 are functionally expressed as choline transporters (Kommareddi et al., 2010; Michel and Bakovic, 2012). Little is known about other transporters in this family. The OCT family consists of three genes, OCT1–3, which function through a Na+-independent uptake mechanism. OCT1 and OCT2 accept choline as a substrate with low affinity. However, OCT3 does not recognize choline as a substrate.
Thus, choline and the choline transport system are indispensable for all cells, including cancer cells. However, to date, little is known about the uptake system for choline and the functional expression of choline transporters in esophageal cancer. In this study, we performed a molecular and functional characterization of choline uptake in the esophageal cancer cells.
MATERIALS AND METHODS
Materials
The human esophageal cell lines (KYSE series) (Shimada et al., 1992) were purchased from JCRB Cell Bank (Osaka, Japan). Human esophageal epithelial cells (HEEpiC) was purchased from ScienCell Research Laboratories, Inc (Carlsbad, CA, USA). [3H]Choline chloride (specific activity: 3182 GBq/mmol) and ATPLiteTM were obtained from PerkinElmer Life Sciences, Inc (Boston, MA, USA). Diphenhydramine hydrochloride, triprolidine hydrochloride, alimemazine tartrate, hydroxyzine dihydrochloride, ketotifen fumarate, azelastine hydrochloride and ebastine were obtained from Funakoshi Co., Ltd (Osaka, Japan). Choline chloride, D-MEM, RPMI 1640, clemastine fumarate, chloropheniramine maleate, mequitazine, oxatomide and bepotastine besilate were obtained from Wako Pure Chemical Industries, Ltd (Osaka, Japan). Promethazine hydrochloride, emedastine fumarate, epinastine hydrochloride, cetirizine dihydrochloride, loratadine, levocetirizine dihydrochloride, tranilast, suplatast tosilate, sodium cromoglicate and fexofenadine hydrochloride were obtained from Tokyo Chemical Industry Co., Ltd (Tokyo, Japan). Hemicholinium-3 (HC-3), N-methyl-D-glucamine (NMDG), TritonX-100, paroxetine hydrochloride, imipramine hydrochloride, propofol, homochlorcyclizine, quinidine hydrochloride, furosemide, rebamipide hydrate, mebendazole, acyclovir, amantadine hydrochloride, pirenzepine dihydrochloride, bepridil hydrochloride, lomeridine hydrochloride, urapidil hydrochloride, trazodone hydrochloride and cyproheptadine were obtained from Sigma-Aldrich Co. LLC (St. Louis, MO, USA). Alexa Fluor 568 goat anti-rabbit IgG was purchased from Molecular Probes Inc (Eugene, OR, USA). Tris-SDS β-ME sample solution and rupatadine were obtained from Cosmo Bio Corporation (Tokyo, Japan). D-MEM without choline chloride was obtained from Cell Science & Technology Institute, Inc (Miyagi, Japan). Citalopram hydrobromide and fluoxetine hydrochloride were purchased from LKT Laboratories, Inc (St. Paul, MN, USA). Fluvoxamine maleate, milnacipran hydrochloride and venlafaxine were obtained from Meiji Yakuhin Co., Ltd (Tokyo, Japan), Asahi Kasei Pharma Corporation (Tokyo, Japan) and Wyeth-Ayerst Research (Princeton, NJ, USA), respectively. Dexmedetomidine hydrochloride was obtained from Maruishi Pharmaceutical Co. Ltd (Osaka, Japan). Reboxetine mesylate was purchased from Cayman Chemical Company (MI, USA). Caspase-Glo® 3/7Assay was purchased from Promega Corporation (Madison, WI, USA). A TaqMan® RNA-to-CTTM 1-Step Kit and TaqMan® Gene Expression Assays were obtained from Applied Biosystems (Foster City, CA, USA). RIPA Lysis Buffer System was purchased from Santa Cruz Biotechnology, Inc (Santa Cruz, CA, USA). Horseradish peroxidase-conjugated anti-rabbit and anti-mouse IgG were purchased from Kirkegaard and Perry Laboratories Inc (Gaithersburg, MD, USA). A Protease Inhibitor Cocktail kit was purchased from Pierce Biotechnology (Rockford, IL, USA). Protein Multicolor was purchased from BioDynamics Laboratory Inc (Tokyo, Japan). 10% Mini-PROTEAN® TGXTM Gel and Trans-BlotTM TurboTM Transfer Pack were purchased from Bio-Rad Laboratories, Inc (Tokyo, Japan). iBindTM Western Systems was purchased from ThermoFisher Scientific Inc (Waltham, MA, USA). Anti-CTL1 polyclonal antibody (ab110767), anti-COX IV polyclonal antibody (ab16056) and anti-Na+/K+-ATPase mouse monoclonal antibody (ab7671) were purchased from Abcam plc (Cambridge, UK). Anti-CTL2 monoclonal antibody (clone 3D11) was purchased from Abnova Corporation (Taipei City, Taiwan). AmershamTM ECLTM prime Western Blotting Detection reagent was purchased from GE Healthcare Life Sciences (Buckinghamshire, UK).
Cell culture
Table 1 shows a profile of the human esophageal tumor cell line KYSE series. Cells were grown in RPMI 1640 medium supplemented with 10% fetal bovine serum (Gibco, Gaithersburg, MD, USA) and 20 mg/L kanamycin (Gibco) in noncoated flasks and 24-well plates. Cultures were maintained in a humidified atmosphere of 5% CO2 and 95% air at 37°C, and the medium was changed every 3–4 days. In the experiments on the effects of choline deficiency (CD), cells were seeded at 1×10⁴ cells/ml/well on 24-well culture plates and incubated in defined medium D-MEM with 30 μM choline chloride (Control) or without choline chloride (choline deficiency: CD). Cells were used for experiments after 2 days.
Table 1.
Human squamous cell carcinoma cell line established from esophageal cancer (KYSE series)
| Cell Name | Sex | Age | Stage | Profile |
|---|---|---|---|---|
| KYSE-180 | Male | 53 | T4N1M0 Stage 3 | Well differentiated squamous cell carcinoma |
| KYSE-450 | Male | 59 | T1M1N0 stage 2b | Well differentiated squamous cell carcinoma |
| KYSE-510 | Female | 67 | T4M1N0 stage 3 | Well differentiated squamous cell carcinoma |
| KYSE-590 | Male | 39 | T4M1N1 stage 4 | Well differentiated squamous cell carcinoma |
| KYSE-790 | Male | 68 | T4M1N1 stage 4 | Well differentiated squamous cell carcinoma |
RNA extraction and real-time polymerase chain reaction (PCR) assay
Total RNA was extracted from the cells using QIA shredder and an RNeasy Mini Kit according to the manufacturer’s instructions. The TaqMan probes for the target mRNAs (CHT1, OCT1–3, CTL1–5 and the housekeeping gene glyceraldehyde-3-phosphate dehydrogenase (GAPDH)) were designed based on the human mRNA sequence using TaqMan® Gene Expression Assays. For one-step real-time PCR, 20 ng of total RNA was added to a master mixture by using the TaqMan® RNA-to-CTTM 1-Step Kit according to the manufacturer’s instructions. Real-time PCR data were analyzed with the LightCycler® 96 system (Roche Diagnostics, Mannheim, Germany). The relative mRNA expression levels of the target genes in cells were calculated using the comparative cycle time (Ct) method. The mRNA expression level relative to GAPDH for each target PCR can be calculated using the following equation: relative mRNA expression=2−(Ct target− Ct GAPDH)×100% (Inazu et al., 2013).
Western blot analysis
Cells were washed two times with D-PBS and were extracted on ice in a RIPA Lysis Buffer (2 mM PMSF, 1 mM sodium orthovanadate, protease inhibitor cocktail, 1mM EDTA, lysis buffer, pH 7.4), and then centrifuged (14,000 ×g) for 15 min at 4°C. The supernatant was incubated for 5 min at 100°C in a 1:1 (v:v) ratio of Tris-SDS β-ME sample solution and electro-phoresed on 10% SDS gel with molecular weight standards. Proteins separated on 10% SDS–PAGE were transferred to PVDF membranes using by the Trans-Blot® TurboTM Transfer System. After protein transfer, the membrane was blocked with iBindTM Flex Solution overnight at 4°C. Membranes were then incubated with 1 μg/ml rabbit anti-CTL1 polyclonal antibody and 2 μg/ml anti-CTL2 monoclonal antibody in iBindTM Flex Solution and secondary antibody of anti-rabbit HRP (1 μg/ml) or anti-mouse HRP (1 μg/ml) using a iBind Flex Western Device for 2.5 h at room temperature. Protein bands were visualized using an ECL Prime Western Blotting Detection System (GE Healthcare Life Sciences, Marlborough, MA, USA). Luminescent images were obtained using a ChemiDoc XRS Plus System (Bio-Rad Laboratories, Hercules, CA, USA).
Immunocytochemistry
Cells grown on a 35 mm Glass Base dish (IWAKI, Chiba, Japan) were washed twice with D-PBS and fixed with 100% methanol for 20 min at room temperature. Cells were permeabilized with detector blocking solution for CTL1 detection or iBindTM Flex Solution for CTL2 detection overnight at 4°C. Cells were incubated with anti-CTL1 polyclonal antibody (2 μg/ml), anti-CTL2 monoclonal antibody (2 μg/ml), anti-COX IV polyclonal antibody (2 μg/ml) and anti-Na+/K+-ATPase monoclonal antibody (5 μg/ml) in new blocking solution for 4 h at room temperature. After being washed with wash solution, the cells were incubated with 2 μg/ml Alexa Fluor 488 anti-rabbit IgG (Molecular Probes Inc.) and 2 μg/ml Alexa Fluor 568 anti-goat IgG for 1 h at room temperature. After excess antibody was washed out with wash solution, the specimens were mounted using VECTASHIELD mounting medium with DAPI (Vector Laboratories, Burlingame, CA, USA). Fluorescence images were obtained with a Confocal Laser Scanning Biological Microscope (FV10i-DOC, Olympus, Tokyo, Japan).
[3H]Choline uptake into KYSE-180 cells
Cells were cultured in 24-well plates. The growth medium was removed from the 24-well plates, and cells were washed twice with uptake buffer, consisting of 125 mM NaCl, 4.8 mM KCl, 1.2 mM CaCl2, 1.2 mM KH2PO4, 5.6 mM glucose, 1.2 mM MgSO4 and 25 mM HEPES adjusted to pH 7.4 with Tris. This was followed by the addition of [3H]choline. [3H]Choline uptake was terminated by removal of the uptake buffer and three rapid washes with ice-cold uptake buffer. Cells were dissolved in 0.1 M NaOH and 0.1% Triton X-100, and aliquots were taken for liquid scintillation counting and protein assay. The radioactivity was measured by a liquid scintillation counter (Tri-Carb® 2100TR, Packard, USA). When Na+-free buffer was used, the Na+-free buffer was modified by replacing NaCl with an equimolar concentration of N-methyl-D-glucamine chloride. Uptake buffers of varying pH (pH 6.0, 6.5, 7.0, 7.5, 8.0, and 8.5) were prepared by mixing 25 mM MES (pH 5.5) and 25 mM Tris (pH 8.5). Both buffers contained 125 mM NaCl, 4.8 mM KCl, 1.2 mM CaCl2, 1.2 mM KH2PO4, 5.6 mM glucose and 1.2 mM MgSO4. In the experiment on saturation kinetics, the concentration of [3H]choline was kept constant at 10 nM and unlabeled choline was added to give the desired choline concentration. The specific uptake of [3H]choline was calculated as the difference between total [3H]choline uptake in the presence and absence of 30 mM unlabeled choline (Iwao et al., 2016). Protein concentrations were determined using a DC Protein Assay Kit (Bio-Rad Laboratories, Hercules, CA, USA).
Cell viability assay
Cells were plated and cultured on 24-well plates. Inhibitors were added after 24 h of cell culture, and the final volume of medium in each well was 1.0 ml. Cell numbers were measured using an ATPLiteTM, and the luminescence ATP detection assay system was used as described in the manufacturer’s instructions. Luminescence was measured on a FilterMax F5 Multi-Mode Microplate Reader (Molecular Devices, LLC, Sunnyvale, CA, USA). The assay was linear over a large range of ATP concentrations (5×10⁻⁹ to 10−6 mol/L) and with a large variety of cell numbers in the assay. There is a linear correlation between the luminescence signal and the cell number (Nishiyama et al., 2016).
Measurements of the caspase-3/7 activity
For measurements of the activities of caspase-3/7, the Caspase-Glo® 3/7 Assay was carried out according to the manufacturer’s instruction. This kit is based on the cleavage of the DEVD sequence of a luminogenic substrate by caspase-3/7, which results in a luminescent signal (Nishiyama et al., 2016). KYSE-180 cells were seeded at a density of 1×10⁴ cells/well in 24-well plates. Test drugs were added 24 h after cell plating, and the final volume of medium in each well was 1.0 ml. Luminescence was measured on a FilterMax F5 Multi-Mode Microplate Reader (Molecular Devices, LLC).
Data analysis
Data are expressed as mean ± SD. Statistical analyses were performed with the unpaired t-test and Dunnett multiple comparisons test using commercially available software (Prism 6, GraphPad Software, Inc., San Diego, CA, USA). The results were considered to be statistically significant when p-values were less than 0.05. The time courses of choline uptake were compared after fitting into single exponential decay equations. The kinetic parameters (Km and Vmax) and the half-inhibitory concentration (IC50) values were calculated by nonlinear regression methods and Eadie-Hofstee curves were fitted using linear regression with the commercially available software Prism 6 (GraphPad Software, Inc.).
RESULTS
Expression of choline transporters in human esophageal epithelial cells (HEEpiC) and esophageal cancer cell lines (KYSE series)
The expression of mRNA for CHT1, CTL1–5 and OCT1–3 was investigated by real-time PCR analysis (Fig. 1). In the KYSE cell lines, CTL1 and CTL2 mRNA were highly expressed, while CHT1, CTL4, OCT2 and OCT3 mRNA were not expressed. CTL3, CTL5 and OCT1 mRNA were expressed at a low level. In contrast, the CTL1 and CTL2 mRNA expression in HEEpiC was lower than that of KYSE series. The expression patterns of the transporters closely resembled it in all KYSE series. Therefore, we conducted a molecular and functional analysis using KYSE-180 cells.
Fig. 1.

Expression of mRNA for choline transporters in HEEpiC and KYSE cells. Real-time PCR analysis of the expression of mRNAs for CHT1, CTL1–5, and OCT1–3. Relative mRNA expression is expressed as a ratio of the target mRNA to GAPDH mRNA. Experiments were performed in triplicate. Each column represents the mean ± SD (n=3). BLQ means below the limit of quantification.
CTL1 and CTL2 mRNA were mainly expressed in KYSE cell lines and HEEpiC by real-time PCR analysis. Therefore, we examined the expression of CTL1 and CTL2 at the protein level. Extracts of KYSE-180 cell lysate were immunoblotted with anti-CTL1 and anti-CTL2 antibody. Immunoblot assays with CTL1 and CTL2 antibody demonstrated the presence of a band of 70 kDa, respectively, in KYSE 180 cells (Fig. 2A).
Fig. 2.

Expression of protein for CTL1 and CTL2 in KYSE-180 cells. (A) Detection of CTL1 and CTL2 proteins by western blot analysis. MM, pre-stained protein molecular weight marker. (B) Subcellular distribution of CTL1 and CTL2 proteins by immunocytochemistry. (C) Fluorescence from antibodies directed to CTL1 (green), CTL2 (green), Na+/K+-ATPase (red) and COX IV (red) was imaged with a confocal microscope. Nuclei are stained with DAPI (blue). Merged images are shown in Merge, and yellow represents co-localization.
The subcellular distribution of CTL1 and CTL2 in KYSE-180 cells was determined by immunocytochemical staining (Fig. 2B). Immunocytochemical staining using anti-CTL1 antibody revealed that the cell surface showed immunoreactivity, and overlapped that of the plasma membrane marker Na+/K+-ATPase (Fig. 2C). On the other hand, CTL2 immunoreactivity was recognized in intracellular compartments, and overlapped that of the mitochondrial marker COX IV (Fig. 2C).
Time course and kinetics of [3H]choline uptake in KYSE 180 cells
We examined the time course of [3H]choline uptake in the presence and absence of extracellular Na+ in KYSE 180 cells for 60 min (Fig. 3A). [3H]Choline uptake increased in a time-dependent manner; it was linear with time up to at least 20 min. When NaCl in the uptake buffer was replaced by NMDG-Cl, the uptake of [3H]choline uptake under Na+-free conditions was weakly decreased compared to control uptake under normal conditions. These uptake was not statistically significant, indicates that it is a Na+-independent transport system. The characteristics of the kinetics of [3H]choline uptake by KYSE 180 cells were determined (Fig. 3B). A kinetic analysis of [3H] choline uptake (specific uptake), as computed by a nonlinear regression analysis, yielded a Michaelis-Menten constant (Km) of 8.6 ± 0.8 μM and a maximal velocity (Vmax) of 6001.0 ± 167.8 pmol/mg protein/h. The Eadie-Hofstee plot shows a straight line in these cells. These data suggest that [3H]choline uptake into KYSE 180 cells is mediated by a single intermediate-affinity transport system.
Fig. 3.

Time course and Na+-dependence of [3H]choline uptake in KYSE-180 cells. (A) Time course of 10 μM [3H]choline uptake in the presence (▲) and absence (●) of extracellular Na+ for 60 min. The time-course of [3H]choline uptake was fitted to the experimental data by a non-linear regression analysis. Each point represents the mean ± SD (n=4). (B) Kinetic characteristics of [3H]choline uptake in KYSE-180 cells. Cells were incubated for 20 min with [3H] choline at concentrations of 2.3 to 88.9 μM. Each point represents the mean ± SD (n=4). An analysis of the kinetics of [3H]choline uptake, as computed by a non-linear regression analysis, yielded a Km value of 8.6 ± 0.8 μM, and a Vmax value of 6001.0 ± 167.8 pmol/mg protein/h. Inset: Eadie-Hofstee plots of [3H]choline uptake show single straight lines.
Properties of [3H]choline uptake in KYSE-180 cells
It has been reported that choline uptake through CTL1 is completely inhibited by HC-3 in the μM range (Inazu, 2014). We investigated the inhibitory effects of HC-3, a choline uptake inhibitor, on the uptake of [3H]choline into KYSE-180 cells (Fig. 4A). [3H]Choline uptake was inhibited by HC-3 in a concentration–dependent manner. The Ki value for the inhibition of [3H]choline uptake by HC-3 in KYSE-180 cells was 17.8 μM.
Fig. 4.

Properties of [3H]choline uptake in KYSE-180 cells. (A) Effects of HC-3 on [3H]choline uptake in KYSE-180 cells. Cells were pre-incubated with various concentrations of HC-3 for 20 min, and the uptake of 10 μM [3H]choline was then measured for 20 min. Results are given as a percentage of the control uptake measured in the presence of vehicle. Each point represents the mean ± SD (n=4). (B) Influence of extracellular pH on [3H]choline uptake in KYSE-180 cells. The uptake of 10 μM [3H]choline was measured for 20 min under different pH conditions. The results show [3H]choline uptake as a percentage of that at pH 7.5. Each column represents the mean ± SD (n=4).
It has been reported that choline uptake through CTL1 is pH-dependent (Inazu, 2014). The influence of extracellular pH on the uptake of [3H]choline in KYSE-180 cells was examined by varying the pH of the pre-incubation and incubation media between pH 6.0 and 8.5 (Fig. 4B). [3H]Choline uptake decreased when the extracellular pH was changed from 7.5 to 6.0, and was increased when the pH of the extracellular medium was changed from 7.5 to 8.5.
Influence of choline deficiency on cell viability and caspase-3/7 activity in KYSE-180 cells
We investigated the influence of choline deficiency on cell viability and caspase-3/7 activity in KYSE-180 cells (Fig. 5). Cells were seeded at 1×10⁴ cells/ml/well on 24-well culture plates and incubated in defined medium D-MEM with 30 μM choline chloride (control) or without choline chloride (choline deficiency: CD) for 2 days. Choline deficiency significantly inhibited cell viability and significantly increased caspase-3/7 activity in KYSE-180 cells.
Fig. 5.

Influence of choline deficiency on cell viability (A) and caspase-3/7 activity (B) in KYSE-180 cells. Cells were seeded at 1×10⁴ cells/well on 24-well culture plates and incubated in defined medium D-MEM with 4 mg/L choline chloride (Normal) or without choline chloride (choline deficiency: CD) for 2 days. Cell numbers and caspase-3/7 activity were then measured. Each column represents the mean ± SD (n=4). ****p<0.0001 compared with the normal conditions.
Effects of various drugs on [3H]choline uptake and cell viability in KYSE-180 cells
We examined the inhibitory effects of 47 various drugs (100 μM) on [3H]choline uptake and cell viability in KYSE-180 cells (Fig. 6). Several cationic drugs inhibited [3H]choline uptake (Fig. 6A) and cell viability (Fig. 6B). The correlations between the effects of 47 various drugs on [3H]choline uptake and cell viability were significant (r=0.64, p<0.0001) (Fig. 6C). We examined the effects of 7 cationic drugs (bepridil, rupatadine, paroxetine, mequitazine, loratadine, clemastine and azelastine, which are surrounded by a circle in Fig. 6C) on caspase-3/7 activity, which inhibited both cell viability and [3H] choline uptake. These drugs can inhibit cell viability, and increased caspase-3/7 activity in KYSE-180 cells (Fig. 7).
Fig. 6.

Effects of 47 various drugs on [3H]choline uptake and cell viability in KYSE-180 cells. (A) Cells were incubated with 100 μM drugs for 20 min, and then 10 μM [3H]choline uptake was measured. Results are given as a percentage of the control uptake measured in the presence of vehicle. Each point represents the mean ± SD (n=3). (B) Cell viability was measured 24 h after treatment with 100 μM drug. Results are given as a percentage of the findings in the vehicle control. Each column represents the mean ± SD (n=3). (C) A correlation analysis of the potencies of various drugs (100 μM) for the [3H]choline uptake and cell viability (data from Figs. 6A, 6B) gave highly significant correlation coefficients (r=0.64, p<0.0001). We selected 7 drugs (which are surrounded with a circle in Fig. 6C), including bepridil, azelastine, clemastine, loratadine, rupatadine, paroxetine and mequitazine, that inhibited both cell viability and [3H] choline uptake. Dotted lines show the 95% confidence interval.
Fig. 7.
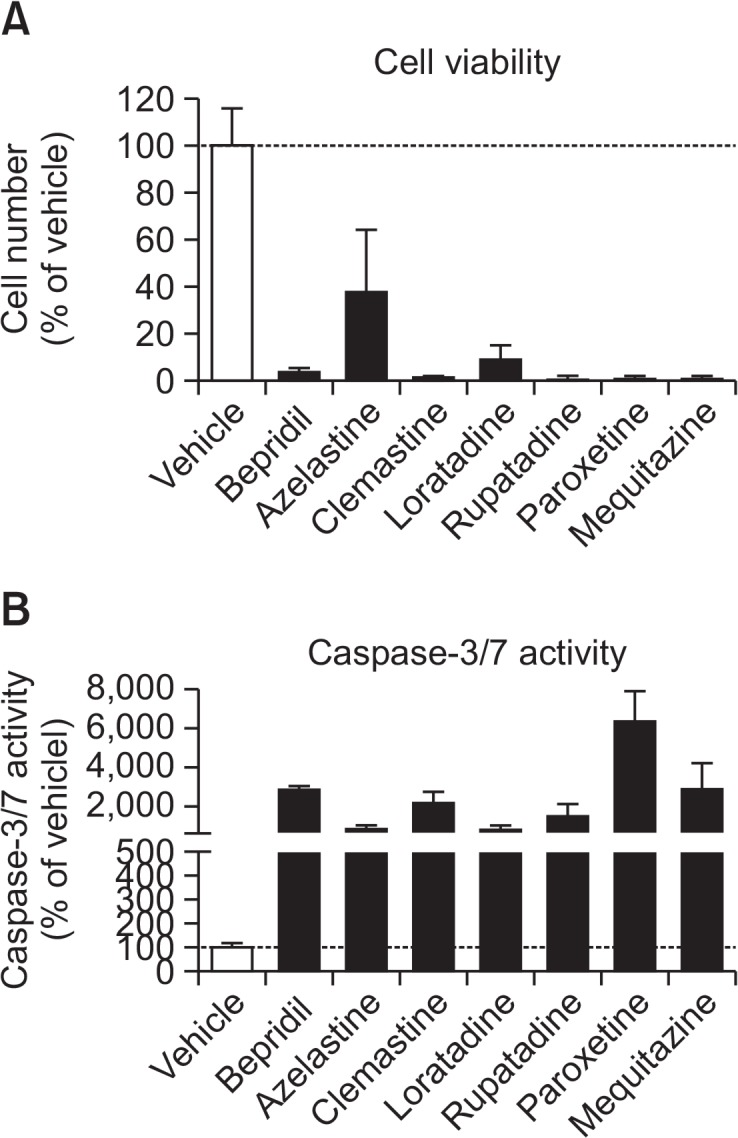
Effects of 7 drugs that inhibited both cell viability and [3H] choline uptake on cell viability (A) and caspase-3/7 activity (B) in KYSE-180 cells. Cells were incubated with 100 μM cationic drugs for 8 h. Cell numbers and caspase-3/7 activity were then measured. Results are given as a percentage of the findings in the vehicle control. Each column represents the mean ± SD (n=4).
DISCUSSION
Choline PET and MRS have shown that enhanced choline transport may play a role in the elevation of phosphocholine (PCho) levels in cancer cells (Ackerstaff et al., 2003; Eliyahu et al., 2007). The elevation of PCho and total choline is one of the most widely established characteristics of cancer cells. PCho is a precursor and a breakdown product of PC, the most abundant phospholipid in biological membranes. The intracellular accumulation of choline through choline transporters is the rate-limiting step in choline phospholipid metabolism, and a prerequisite for cancer cell proliferation. It is important that we characterize the underlying mechanism and the expression of choline transport systems in cancer cells.
We first examined the expression of mRNA for CHT1, CTL1–5 and OCT1–3 in HEEpiC and KYSE cells by real-time RT-PCR analysis. We found that CTL1 and CTL2 mRNA were mainly expressed in all KYSE cells, and these expression levels are higher than HEEpiC. Furthermore, both CTL1 and CTL2 proteins were expressed, and were localized in the plasma membrane and mitochondria, respectively. These results indicate that CTL1 may be involved in the uptake of extracellular choline into cancer cells. KYSE-180 cells have a Na+-independent and an intermediate-choline transport systems that can be characterized by kinetic parameters and Eadie-Hofstee plots. The Km value was 8.6 μM, which is similar to those in the human cell line, and these cell types show properties similar to those of CTL1. CTL1 is known to be pH-dependent, and can be completely inhibited by HC-3 in the μM range (Inazu et al., 2005). In this study, [3H]choline uptake in KYSE-180 cells was decreased by acidification and increased by alkalinization of the extracellular medium, indicating that choline may be transported by a choline/H+ antiport system. Moreover, the Ki value of HC-3 for KYSE-180 cells is 17.8 μM, which is very close to the Ki value for CTL1. These results suggest that [3H]choline uptake in KYSE-180 cells is likely mediated by CTL1. Therefore, intermediate-affinity choline uptake via CTL1 is believed to play an important role in choline transport in esophageal cancer. The presence of CTL1-mediated choline uptake has been suggested in primary cultures of rat astrocytes (Inazu et al., 2005), mouse neurons (Fujita et al., 2006), human keratinocytes (Uchida et al., 2009), human colon carcinoma cells (Kouji et al., 2009), rat renal tubule epithelial cells (Yabuki et al., 2009), human neuroblastoma cells (Yamada et al., 2011) and small cell lung carcinoma cells (Inazu et al., 2013). CTL1 is ubiquitously expressed in mammalian tissues which suggests that it plays an important role in choline transporter for a broader purpose, such as ACh, PCho and phospholipid synthesis. CTL1 is strongly expressed in cancer cells such as breast cancer (Eliyahu et al., 2007) and lung adenocarcinoma (Wang et al., 2007), which require high levels of choline to synthesize sphingomyelin, PCho and PC.
We investigated the relationship between apoptotic cell death and the inhibition of intracellular choline uptake in KYSE-180 cells. We found that choline deficiency significantly inhibited cell viability and significantly increased caspase-3/7 activity. We concluded that the choline deficiency in KYSE-180 cells caused apoptotic cell death. These results demonstrate that the functional inhibition of choline uptake through CTL1 could promote apoptotic cell death. Many studies have reported that various organic cations inhibited choline uptake and cell viability (Kouji et al., 2009; Yamada et al., 2011; Nishiyama et al., 2016). A correlation analysis of the potencies of organic cations for the inhibition of choline uptake and cell viability showed a strong correlation in tongue cancer HSC-3 cells (Nishiyama et al., 2016). Thus, these results indicate that there is a strong correlation between cell survival and the inhibition of choline uptake. In addition, HSC-3 cells cultured with choline-deficiency medium that were stained with FITC-annexin V, which indicates that they were apoptotic cells (Nishiyama et al., 2016). These results demonstrate that the functional inhibition of CTL1 could promote apoptotic cell death. We explored the possible correlation between choline uptake and cell viability by examining the effects of 47 various drugs on the survival of KYSE-180 cells. We found a strong correlation between cell survival and the inhibition of choline uptake (r=0.64, p<0.0001). Furthermore, choline uptake inhibitors can inhibit cell viability and increase caspase-3/7 activity. It may be possible to induce apoptotic cell death by obstructing the function of choline uptake through CTL1 in KYSE-180 cells. In the near future, it is necessary to evaluate these drugs in vivo tumor xenograft experiments using KYSE-180 cells. These choline uptake inhibitors induced changes in total choline uptake could affect PET tumor imaging, and it may be available as a PET tracer. Previous studies have shown that choline deficiency triggers apoptosis via a p53-independent pathway (Albright et al., 1996) and increases the amount of ceramide, a lethal metabolite, in PC12 cells and primary neurons (Yen et al., 1999). An increase in ceramide was associated with choline deficiency-induced apoptosis. The inhibition of choline transport decreased PCho and PC contents; cancer cells attempt to overcome this by activating an alternative mechanism for generating PCho and PC. This enables cancer cells, to some extent, to continue PCho and PC production, but also leads to the production of ceramide by the sphingomyelinase-catalyzed hydrolysis of sphingomyelin. Caspase-3 is activated following the induction of ceramide accumulation, and could promote apoptotic cell death.
The physiological function of CTL2 is not well understood. However, there have been some reports on this subject. CTL2 mRNA and protein are expressed in the human inner ear (Nair et al., 2004), rat renal epithelial cells (Yabuki et al., 2009), human trophoblastic cells (Yara et al., 2015), human glioblastoma cells (Taguchi et al., 2014), human brain microvascular endothelial cells (Iwao et al., 2016) and human tongue cancer cells (Nishiyama et al., 2016). The intracellular localization of CTL2 differs among these cells and it is located in the plasma membrane and mitochondria. It has recently been demonstrated that CTL2 exhibits detectable choline transport activity (Kommareddi et al., 2010). However, the function of CTL2 has not been fully characterized and Km values for choline are unknown. We found that CTL2 mRNA and protein were mainly expressed in KYSE-180 cells and CTL2 protein was located in mitochondria. SAM act as a major source of methyl groups and play an essential role as an epigenetics. The main intracellular source of SAM is from the oxidation of choline in mitochondria. Choline oxidase is located in the inner membrane of mitochondria in liver and kidney (Porter et al., 1992; Kaplan et al., 1993; O’Donoghue et al., 2009), which shows that intracellular choline must cross the mitochondrial inner membrane before oxidation can occur. Interestingly, choline deficiency causes mitochondrial and cellular oxidative damage and lipid peroxidation (Ossani et al., 2007). Thus, choline is also an essential substance for mitochondria. We found that the apoptotic cell death was induced by choline deficiency in KYSE cells. We speculate that CTL2 might be the major site for the control of choline oxidation in mitochondria and may be important molecules of the apoptotic cell death in esophageal cancer cells. Chemical modifications of histones and DNA, such as histone methylation, histone acetylation, and DNA methylation, play critical roles in epigenetic gene regulation (Kaelin and McKnight, 2013). SAM contains the active methyl donor group that is used by most methyltransferase enzymes. Altered DNA methylation and disruption of DNA repair have been reported in cancer patients (Balassiano et al., 2011). Therefore, epigenetic mechanisms play important roles in carcinogenesis. Further studies will be needed to examine the function of CTL2 and its association with epigenetics in esophageal cancer cells.
We conclude that KYSE-180 cells express the intermediate-affinity choline transporter CTL1, which uses a directed H+ gradient as a driving force. Choline uptake through CTL1 is associated with cell viability, and the functional inhibition of CTL1 could promote apoptotic cell death. Furthermore, CTL2 may be involved in choline uptake in mitochondria, which is the rate-limiting step in SAM synthesis and DNA methylation. Identification of this CTL1-and CTL2-mediated choline transport system should provide a potential new target for esophageal cancer therapy.
Acknowledgments
This work was supported by JSPS KAKENHI Grant Number 17K08315.
Footnotes
CONFLICT OF INTEREST
The authors have declared that there is no conflict of interest.
REFERENCES
- Ackerstaff E, Glunde K, Bhujwalla ZM. Choline phospholipid metabolism: a target in cancer cells? J Cell Biochem. 2003;90:525–533. doi: 10.1002/jcb.10659. [DOI] [PubMed] [Google Scholar]
- Albright CD, Liu R, Bethea TC, Da Costa KA, Salganik RI, Zeisel SH. Choline deficiency induces apoptosis in SV40-immortalized CWSV-1 rat hepatocytes in culture. FASEB J. 1996;10:510–516. doi: 10.1096/fasebj.10.4.8647350. [DOI] [PubMed] [Google Scholar]
- Balassiano K, Lima S, Jenab M, Overvad K, Tjonneland A, Boutron-Ruault MC, Clavel-Chapelon F, Canzian F, Kaaks R, Boeing H, Meidtner K, Trichopoulou A, Laglou P, Vineis P, Panico S, Palli D, Grioni S, Tumino R, Lund E, Buenode-Mesquita HB, Numans ME, Peeters PH, Ramon Quirós J, Sánchez MJ, Navarro C, Ardanaz E, Dorronsoro M, Hallmans G, Stenling R, Ehrnström R, Regner S, Allen NE, Travis RC, Khaw KT, Offerhaus GJ, Sala N, Riboli E, Hainaut P, Scoazec JY, Sylla BS, Gonzalez CA, Herceg Z. Aberrant DNA methylation of cancer-associated genes in gastric cancer in the European Prospective Investigation into Cancer and Nutrition (EPIC-EURGAST) Cancer Lett. 2011;311:85–95. doi: 10.1016/j.canlet.2011.06.038. [DOI] [PubMed] [Google Scholar]
- Bertagna F, Bertoli M, Treglia G, Manenti S, Salemme M, Giubbini R. Incidental 11C-Choline PET/CT uptake due to Esophageal carcinoma in a patient studied for prostate cancer. Clin Nucl Med. 2014;39:e442–e444. doi: 10.1097/RLU.0000000000000334. [DOI] [PubMed] [Google Scholar]
- Eliyahu G, Kreizman T, Degani H. Phosphocholine as a biomarker of breast cancer: molecular and biochemical studies. Int. J. Cancer. 2007;120:1721–1730. doi: 10.1002/ijc.22293. [DOI] [PubMed] [Google Scholar]
- Fujita T, Shimada A, Okada N, Yamamoto A. Functional characterization of Na+-independent choline transport in primary cultures of neurons from mouse cerebral cortex. Neurosci Lett. 2006;393:216–221. doi: 10.1016/j.neulet.2005.09.069. [DOI] [PubMed] [Google Scholar]
- García JR, Ponce A, Canales M, Ayuso J, Moragas M, Soler M. Detection of second tumors in 11C-choline PET/CT studies performed due to biochemical recurrence of prostate cancer. Rev Esp Med Nucl Imagen Mol. 2014;33:28–31. doi: 10.1016/j.remn.2013.01.007. [DOI] [PubMed] [Google Scholar]
- Gllies RJ, Morse DL. In vivo magnetic resonance spectroscopy in cancer. Annu Rev Biomed Eng. 2005;7:287–326. doi: 10.1146/annurev.bioeng.7.060804.100411. [DOI] [PubMed] [Google Scholar]
- Glunde K, Jiang L, Moestue SA, Gribbestad IS. MRS and MRSI guidance in molecular medicine: targeting and monitoring of choline and glucose metabolism in cancer. NMR Biomed. 2011;24:673–690. doi: 10.1002/nbm.1751. [DOI] [PMC free article] [PubMed] [Google Scholar]
- Glunde K, Jacobs MA, Bhujwalla ZM. Choline metabolism in cancer: implications for diagnosis and therapy. Expert Rev Mol Diagn. 2006;6:821–829. doi: 10.1586/14737159.6.6.821. [DOI] [PubMed] [Google Scholar]
- Inazu M. Choline transporter-like proteins CTLs/SLC44 family as a novel molecular target for cancer therapy. Biopharm Drug Dispos. 2014;35:431–449. doi: 10.1002/bdd.1892. [DOI] [PubMed] [Google Scholar]
- Inazu M, Takeda H, Matsumiya T. Molecular and functional characterization of an Na+-independent choline transporter in rat astrocytes. J Neurochem. 2005;94:1427–1437. doi: 10.1111/j.1471-4159.2005.03299.x. [DOI] [PubMed] [Google Scholar]
- Inazu M, Yamada T, Kubota N, Yamanaka T. Functional expression of choline transporter-like protein 1 (CTL1) in small cell lung carcinoma cells: a target molecule for lung cancer therapy. Pharmacol Res. 2013;76:119–131. doi: 10.1016/j.phrs.2013.07.011. [DOI] [PubMed] [Google Scholar]
- Iwao B, Yara M, Hara N, Kawai Y, Yamanaka T, Nishihara H, Inoue T, Inazu M. Functional expression of choline transporter like-protein 1 (CTL1) and CTL2 in human brain microvascular endothelial cells. Neurochem Int. 2016;93:40–50. doi: 10.1016/j.neuint.2015.12.011. [DOI] [PubMed] [Google Scholar]
- Kaelin WG, Jr, McKnight SL. Influence of metabolism on epigenetics and disease. Cell. 2013;153:56–69. doi: 10.1016/j.cell.2013.03.004. [DOI] [PMC free article] [PubMed] [Google Scholar]
- Kaplan CP, Porter RK, Brand MD. The choline transporter is the major site of control of choline oxidation in isolated rat liver mitochondria. FEBS Lett. 1993;321:24–26. doi: 10.1016/0014-5793(93)80613-Y. [DOI] [PubMed] [Google Scholar]
- Kommareddi PK, Nair TS, Thang LV, Galano MN, Babu E, Ganapathy V, Kanazawa T, McHugh JB, Carey TE. Isoforms, expression, glycosylation, and tissue distribution of CTL2/SLC44A2. Protein J. 2010;29:417–426. doi: 10.1007/s10930-010-9268-y. [DOI] [PMC free article] [PubMed] [Google Scholar]
- Kouji H, Inazu M, Yamada T, Tajima H, Aoki T, Matsumiya T. Molecular and functional characterization of choline transporter in human colon carcinoma HT-29 cells. Arch Biochem Biophys. 2009;483:90–98. doi: 10.1016/j.abb.2008.12.008. [DOI] [PubMed] [Google Scholar]
- Liu D, Hutchinson OC, Osman S, Price P, Workman P, Aboagye EO. Use of radiolabelled choline as a pharmacodynamic marker for the signal transduction inhibitor geldanamycin. Br. J. Cancer. 2002;87:783–789. doi: 10.1038/sj.bjc.6600558. [DOI] [PMC free article] [PubMed] [Google Scholar]
- Michel V, Bakovic M. The ubiquitous choline transporter SLC44A1. Cent Nerv Syst Agents Med Chem. 2012;12:70–81. doi: 10.2174/187152412800792733. [DOI] [PubMed] [Google Scholar]
- Nair TS, Kozma KE, Hoefling NL, Kommareddi PK, Ueda Y, Gong TW, Lomax MI, Lansford CD, Telian SA, Satar B, Arts HA, El-Kashlan HK, Berryhill WE, Raphael Y, Carey TE. Identification and characterization of choline transporter-like protein 2, an inner ear glycoprotein of 68 and 72 kDa that is the target of antibody-induced hearing loss. J Neurosci. 2004;24:1772–1779. doi: 10.1523/JNEUROSCI.5063-03.2004. [DOI] [PMC free article] [PubMed] [Google Scholar]
- Nishiyama R, Nagashima F, Iwao B, Kawai Y, Inoue K, Midori A, Yamanaka T, Uchino H, Inazu M. Identification and functional analysis of choline transporter in tongue cancer: A novel molecular target for tongue cancer therapy. J Pharmacol Sci. 2016;131:101–109. doi: 10.1016/j.jphs.2016.04.022. [DOI] [PubMed] [Google Scholar]
- O’Donoghue N, Sweeney T, Donagh R, Clarke KJ, Porter RK. Control of choline oxidation in rat kidney mitochondria. Biochim. Biophys. Acta. 2009;1787:1135–1139. doi: 10.1016/j.bbabio.2009.04.014. [DOI] [PubMed] [Google Scholar]
- Ossani G, Dalghi M, Repetto M. Oxidative damage lipid peroxidation in the kidney of choline-deficient rats. Front Biosci. 2007;12:1174–1183. doi: 10.2741/2135. [DOI] [PubMed] [Google Scholar]
- Porter RK, Scott JM, Brand MD. Choline transport into rat liver mitochondria. Characterization and kinetics of a specific transporter. J Biol Chem. 1992;267:14637–14646. [PubMed] [Google Scholar]
- Shimada Y, Imamura M, Wagata T, Yamaguchi N, Tobe T. Characterization of 21 newly established esophageal cancer cell lines. Cancer. 1992;69:277–284. doi: 10.1002/1097-0142(19920115)69:2<277::AID-CNCR2820690202>3.0.CO;2-C. [DOI] [PubMed] [Google Scholar]
- Tachimori Y, Ozawa S, Numasaki H, Fujishiro M, Matsubara H, Oyama T, Shinoda M, Toh Y, Udagawa H, Uno T. Comprehensive registry of esophageal cancer in Japan, 2009. Esophagus. 2016;13:110–137. doi: 10.1007/s10388-016-0531-y. [DOI] [PMC free article] [PubMed] [Google Scholar]
- Taguchi C, Inazu M, Saiki I, Yara M, Hara N, Yamanaka T, Uchino H. Functional analysis of [methyl-3H]choline uptake in glioblastoma cells: influence of anti-cancer and central nervous system drugs. Biochemical Pharmacol. 2014;88:303–312. doi: 10.1016/j.bcp.2014.01.033. [DOI] [PubMed] [Google Scholar]
- Tian M, Zhang H, Oriuchi T, Higuchi T, Endo K. Comparison of 11C-choline PET and FDG PET for the differential diagnosis of malignant tumors. Eur. J. Nucl. Med. Mol. Imaging. 2004;31:1064–1072. doi: 10.1007/s00259-004-1496-y. [DOI] [PubMed] [Google Scholar]
- Uchida Y, Inazu M, Takeda H, Yamada T, Tajima H, Matsumiya T. Expression and functional characterization of choline transporter in human keratinocytes. J Pharmacol Sci. 2009;109:102–109. doi: 10.1254/jphs.08291FP. [DOI] [PubMed] [Google Scholar]
- Wang T, Li J, Chen F, Zhao Y, He X, Wan D, Gu J. Choline transporters in human lung adenocarcinoma: expression and functional implications. Acta Biochim Biophys Sin (Shanghai) 2007;39:668–674. doi: 10.1111/j.1745-7270.2007.00323.x. [DOI] [PubMed] [Google Scholar]
- Xu XC. Risk factors and gene expression in esophageal cancer. Methods Mol Biol. 2009;471:335–360. doi: 10.1007/978-1-59745-416-2_17. [DOI] [PubMed] [Google Scholar]
- Yabuki M, Inazu M, Yamada T, Tajima H, Matsumiya T. Molecular and functional characterization of choline transporter in rat renal tubule epithelial NRK-52E cells. Arch Biochem Biophys. 2009;485:88–96. doi: 10.1016/j.abb.2009.02.007. [DOI] [PubMed] [Google Scholar]
- Yamada T, Inazu M, Tajima H, Matsumiya T. Functional expression of choline transporter-like protein 1 (CTL1) in human neuroblastoma cells and its link to acetylcholine synthesis. Neurochem Int. 2011;58:354–365. doi: 10.1016/j.neuint.2010.12.011. [DOI] [PubMed] [Google Scholar]
- Yara M, Iwao B, Hara N, Yamanaka T, Uchino H, Inazu M. Molecular and functional characterization of choline transporter in the human trophoblastic cell line JEG-3 cells. Placenta. 2015;36:631–637. doi: 10.1016/j.placenta.2015.03.010. [DOI] [PubMed] [Google Scholar]
- Yen CL, Mar MH, Zeisel SH. Choline deficiency-induced apoptosis in PC12 cells is associated with diminished membrane phosphatidylcholine and sphingomyelin, accumulation of ceramide and diacylglycerol, and activation of a caspase. FASEB J. 1999;13:135–142. doi: 10.1096/fasebj.13.1.135. [DOI] [PubMed] [Google Scholar]
- Zhang Y. Epidemiology of esophageal cancer. World J Gastroenterol. 2013;19:5598–5606. doi: 10.3748/wjg.v19.i34.5598. [DOI] [PMC free article] [PubMed] [Google Scholar]