Abstract
Emerging evidence has indicated that long non‐coding RNA plays an important role in carcinogenesis at the transcriptional and post‐translational levels. The regulation of carcinogenesis‐related effectors is potent in the determination of tumor initiation and progression. In the current study, FOXD2‐AS1 was found to interact with microRNA (miR)‐185‐5p to modulate proliferation, migration, and invasion of colorectal cancer (CRC) cells. Interestingly, expression of cell division control 42 was significantly influenced by FOXD2‐AS1 and miR‐185‐5p. In CRC patients, the expression level of FOXD2‐AS1 in CRC tissue was closely associated with miR‐185‐5p and cell division control 42, and implicated in the overall survival rate. Therefore, our study suggests that long non‐coding RNA FOXD2‐AS1 plays a positive role in CRC and could be developed and used as a potential biomarker for the diagnosis and therapy of CRC. This will greatly improve the prevention and treatment of the third most common cancer worldwide.
Keywords: biomarker, colorectal cancer, FOXD2‐AS1, long non‐coding RNA, microRNA‐185‐5p
1. INTRODUCTION
Colorectal cancer (CRC) is one of the most common cancers worldwide, with high incidence and mortality.1 Although the incidence rate is higher in developed countries, the overall mortality is higher in developing countries.2 Colorectal cancer begins with polyps, which subsequently become adenomas with high‐grade dysplasia, and ultimately to colonic carcinoma. Current investigations of the pathogenesis of CRC have indicated that genetic and epigenetic changes significantly contribute to CRC.3, 4 Sequential genetic and epigenetic abnormal alterations in specific oncogenes and/or tumor suppressors result in CRC onset, progression, and metastasis.5 Although immune activation and intestinal bacterial dysbiosis are also implicated in CRC genesis,3, 6, 7 molecular characterizations are necessary to understand the precise cascade of events for diagnostic and therapeutic purposes.
Long non‐coding RNA (lncRNA) is functionally defined as non‐protein coding transcripts >200 nt in length.8 These so‐called junk lncRNAs have been found to be critical players in the regulation of cancer phenotype through their interactions with DNA, RNA, and proteins.9 Many lncRNA are uniquely expressed in differentiated tissue and specific cancers,9 indicating that lncRNA could be potential treatment targets with high specificity. Recent studies have investigated the role of lncRNA FOXD2‐AS1 in the regulation of a variety of carcinoma development, including CRC.10, 11, 12, 13 Overexpression of FOXD2‐AS1 promotes non‐small‐cell lung cancer growth.12 In certain human CRC cell lines, FOXD2‐AS1 is upregulated and associated with cell proliferation and invasion.10 Therefore, an understanding of the mechanisms associated with FOXD2‐AS1 in carcinogenesis could be potentially beneficial to CRC therapy.
In the current study, we tested the expression levels of FOXD2‐AS1 in human CRC tissues and a number of human CRC cell lines that were not included in previous studies. Through overexpression and knockdown, the role of FOXD2‐AS1 in cell proliferation, migration, and invasion was evaluated. Furthermore, we showed that the interaction between microRNA (miR)‐185‐5p and FOXD2‐AS1 is responsible for cell division control protein 42 (CDC42) expression, indicating that CDC42 might be the potential downstream effector of the FOXD2‐AS1 and miR185‐5p complex in CRC genesis. Finally, the expression levels of FOXD2‐AS1, miR‐185‐5p, and CDC42 were measured in human CRC tissues. The correlation between FOXD2‐AS1 expression and overall CRC patient survival rates highlighted the valuable clinical role of FOXD2‐AS1 as a biomarker in the prediction of 6‐year CRC survival rates.
2. MATERIALS AND METHODS
2.1. Patients and CRC tissue
Colorectal cancer patients were diagnosed by colonoscopy and biopsy tests. Colorectal cancer tissue and adjacent non‐carcinogenic tissue were collected from consenting patients during surgical removal of tumor. The protocol for the research project was approved by the Ethics Committee of Henan Provincial People's Hospital (Shengzhou, China) and it conformed to the provisions of the Declaration of Helsinki (as revised in Fortaleza, Brazil, October 2013). Informed consent was obtained from all individual participants included in the study.
2.2. Cell culture and transfection
All colon cancer cell lines (SW620, HCT‐116, HT‐29, and LOVO) were grown in DMEM (Thermo Fisher Scientific, Waltham, MA, USA) supplemented with 10% FBS (Sigma, St. Louis, MO, USA). Cultures were incubated at 37°C with 5% CO2 in a humidified incubator. Transfections were carried out with either Lipofectamine 3000 (Thermo Fisher Scientific) for overexpression and knockdown (siRNA) experiments, or RNAiMax for miRNA mimics.
The plasmid for FOXD2‐AS1 overexpression was constructed by inserting full length FOXD2‐AS1 into pCDNA3 plasmid. Empty pCDNA3 vector was used as its negative control. Two sets of siRNAs targeting FOXD2‐AS1 and its scrambled control siRNA were purchased from Thermo Fisher Scientific for the knockdown assay. The biotinylated miRNA‐185‐50, 150, and 4306 mimics were purchased from Thermo Fisher Scientific. The transfected cells were lysed for 24 hours post‐transfection for streptavidin beads pull‐down. The pulled down components were subjected to RNA isolation and quantitative RT‐PCR (qRT‐PCR) for FOXD2‐AS1. The efficiencies of knockdown and overexpression are shown in Figure S1.
2.3. RNA extraction, cDNA synthesis, and qRT‐PCR
Cells were washed with PBS and lysed with TRIzol (Thermo Fisher Scientific). Total RNA was isolated from TRIzol lysed cells following the manufacturer's instructions. For mRNA and lncRNA expression, 1 μg total RNA was used to synthesize cDNA using a cDNA synthesis kit (Thermo Fisher Scientific). Specific primers were used in qRT‐PCR as previously described:10 FOXD2‐AS1‐forward, 5′TGGACCTAGCTGCAGCTCCA3′; FOXD2‐AS1‐reverse, 5′AGTTGAAGGTGCACACACTG3′; GAPDH‐forward, 5′GCGAGATCGCACTCATCATCT‐3′; and GAPDH‐reverse, 5′‐TCAGTGGTGGACCTGACC‐3′. The PCR conditions were as follows: 95°C for 5 minutes, 40 cycles of 95°C for 20 seconds and 62°C for 30 seconds, followed by 72°C for 3 minutes.
For miRNA expression, cDNA was synthesized using the qScript microRNA cDNA Synthesis Kit (Quantabio, Beverly, MA, USA) according to the manufacturer's instructions. Quantitative PCR was carried out under the following thermocycler conditions: 95°C for 2 minutes, and 40 cycles of 95°C for 5 seconds and 60°C for 30 seconds. MicroRNA qRT‐PCR was done using a miScript SYBR Green PCR Kit (Qiagen, Hilden, Germany) according to the manufacturer's protocol, with miScript Primer Assay for miR‐185‐5p (Qiagen). The U6 small RNA Assay (Qiagen) was used as housekeeping control for normalization.
2.4. Cell proliferation assay
Cells in 24‐well plates with different treatments were subjected to medium replacement with 10 μL sterile MTT dye (5 mg/mL). After incubation at 37°C for 4 hours, the MTT solution was removed and 150 μL DMSO was added to each well. Absorbance was read at 490 nm on an enzyme immunoassay analyzer (Biotek, Winooski, VT, USA).
2.5. Wound healing assay
When cells grew to approximately 70%‐80% confluence in culture wells, a 1‐mL pipette tip was used to gently scratch the monolayer across the center of the well. Wells were briefly washed twice with medium to remove the detached cells. Fresh medium was added and cells grew for an additional 24 hours before photographs were taken on a microscope.
2.6. Crystal violet staining
Cells subjected to crystal violet staining were washed with cold PBS, and fixed with ice‐cold methanol for 10 minutes. Then cells were stained with 0.5% crystal violet solution in 25% methanol for 10 minutes. Cells were washed with water several times prior to observation under a microscope.
2.7. Transwell assay
Cell migration assays were carried out using 24‐well Transwell chambers (8‐μm pore size; BD Biosciences). Approximately 1 × 10⁵ cells were resuspended in 100 μL serum‐free medium and added into the top chambers, which had been coated with Matrigel matrix (Corning, Corning, NY, USA), and DMEM containing 10% FBS was filled into the bottom chambers. After 24 hours of incubation at 37°C, the cells that did not migrate through the pores were removed by a cotton‐tipped applicator, and cells on the lower surface of the membrane were subjected to crystal violet staining.
2.8. Constructions and luciferase assay
The 3′‐UTR of Cdc40 sequences was amplified and cloned into a pMIR‐Report vector (Thermo Fisher Scientific) located downstream of the luciferase gene. The same amount of the Renilla expression vector pRL‐TK (Promega, Madison, WI, USA) was cotransfected for normalization. Luciferase activity was measured at 48 hours post‐transfection using the Dual‐Glo Luciferase Assay System (Promega).
2.9. Western blot analysis
Total protein was isolated by RIPA buffer in the presence of proteinase inhibitors, and quantified by Bradford assay (Sigma). Total protein (20 μg) was loaded into each well and transferred to PVDF membranes. Primary antibody used against human cell division control 42 (CDC42) (Cambridge, UK) was diluted 1:2000 and incubated with the membranes at 4°C overnight. Secondary anti‐rabbit antibody (Cambridge, UK) was diluted 1:5000 and incubated with the membranes at room temperature for 1 hour.
2.10. Statistical analyses
Prism 6 (GraphPad) was used to carry out statistical analyses. Unpaired t‐test, one‐way ANOVA, two‐way ANOVA, and the chi‐square‐test were used as indicated.
3. RESULTS
3.1. Expression of FOXD2‐AS1 is increased in colonic cancer cells
First, relative mRNA expression levels of FOXD2‐AS1 were evaluated in human colonic tumor and adjacent non‐tumor tissue. There was a significant increase in the FOXD2‐AS1 expression in tumor samples compared with non‐tumor controls (Figure 1A). To proceed with the cell line study, a number of human colon cancer cell lines were used for the quantification of FOXD2‐AS1 expression level. Compared with normal human colon cell line CCD‐18Co, increased FOXD2‐AS1 expression was found in the other four tested colon cancer cell lines (Figure 1B).
Figure 1.
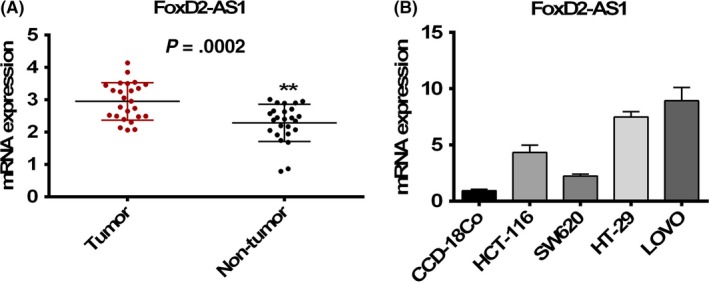
Increased mRNA expression levels of FOXD2‐AS1 in colorectal cancer (CRC). The mRNA level was determined by quantitative RT‐PCR in human CRC tissue (A) and in four CRC cell lines (B) compared with non‐tumor tissue and normal CRC cells, respectively. **P < .0002, unpaired t‐test
3.2. FOXD2‐AS1 promotes proliferation, migration, and invasion in colon cancer cells
To investigate the effects of FOXD2‐AS1 in colonic carcinogenesis, HCT‐116, SW620, HT‐29, and LOVO cell lines were transfected to either overexpress FOXD2‐AS1 or knock down the expression of FOXD2‐AS1. Cell proliferation was determined by MTT assay. Within 72 hours, acceleration and deceleration in cell proliferation were observed in FOXD2‐AS1 overexpressed and knockdown cells, respectively (Figure 2A). In addition, cell proliferation was also evaluated by crystal violet staining. Given the same basal cell number to start with, HCT‐116 and SW620 cells transfected with plasmid overexpressing FOXD2‐AS1 showed a higher density of cells within the 48‐hour culture (Figure 2B). In contrast, HT‐29 and LOVO, both of which have relatively high basal levels of FOXD2‐AS1, were transfected with plasmid expressing siRNA targeting FOXD2‐AS1. Reduction in cell proliferation was observed in the HT‐29 and LOVO cells with FOXD2‐AS1 knockdown (Figure 2B).
Figure 2.
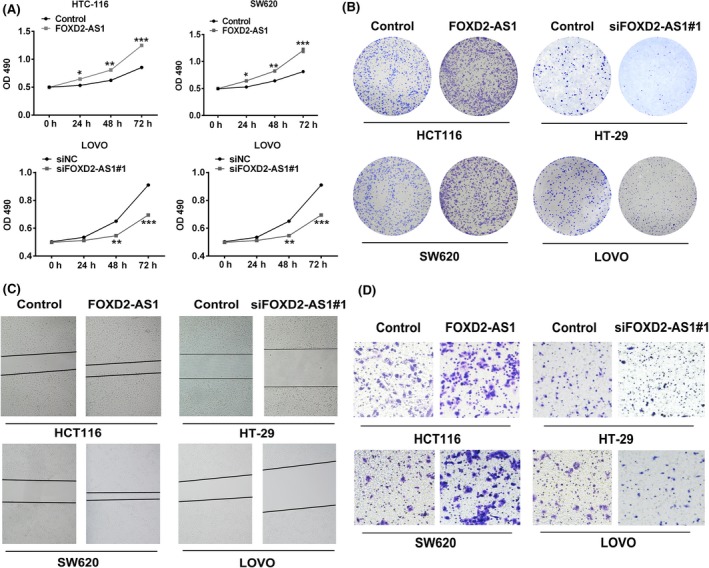
FOXD2‐AS1 promotes cell proliferation, migration, and invasion. Overexpression of FOXD2‐AS1 in HCT116 and SW620 colorectal cancer cells induced accelerated cell growth, evaluated by MTT assay (A) and crystal violet staining (B). Cell migration and invasion were determined by wound healing assay (C) and Transwell assay (D), respectively. Conversely, reduced expression of FOXD2‐AS1 in HT‐29 and LOVO cells by siRNA knockdown suppressed cell growth (A,B), migration (C) and invasion (D). *P < .05, **P < .01. two‐way ANOVA test. siNC, scrambled control siRNA
Cell migration was evaluated by wound healing assay. Consistent with the cell proliferation assay, we observed rapid wound closure in the HCT‐116 and SW620 cells with overexpression of FOXD2‐AS1. Slower wound closure was found in the HT‐29 and LOVO cells with knockdown of FOXD2‐AS1 (Figure 2C).
Finally, Transwell assay was used to measure the cell capability of motility and invasion. Consistent with proliferation and migration assays, we found that overexpression of FOXD2‐AS1 in HCT‐116 and SW620 promoted motility and invasion, whereas suppression of FOXD2‐AS1 expression led to diminished motility and invasion (Figure 2D). To eliminate the off‐target possibility of siRNA knockdown, an alternative set of siRNA targeting FOXD2‐AS1 was used. We observed comparable effects of both siRNAs on HT‐29 and LOVO proliferation (Figure S2).
3.3. FOXD2‐AS1 interacts with miR‐185‐5p and regulates its expression
To investigate the role of FOXD2‐AS1 in colonic carcinogenesis, the Starbase database was utilized to predict the interactions between FOXD2‐AS1 and potential miRNA.14, 15 Human miR‐185‐5p (hsa‐miR‐185‐5p) was proposed to be a potential binding candidate of interest (Figure 3A). To test this binding in vivo, 3′‐end biotinylated miR‐185‐5p, miR‐150‐5p, and miR‐4306 were separately synthesized and transfected into LOVO cells.16 After streptavidin capture, the input and bound fractions were tested by qRT–PCR targeting FOXD2‐AS1. In contrast to miR‐150‐5p and miR‐4306, significant association between FOXD2‐AS1 and miR‐185‐5p was determined (Figure 3B).
Figure 3.
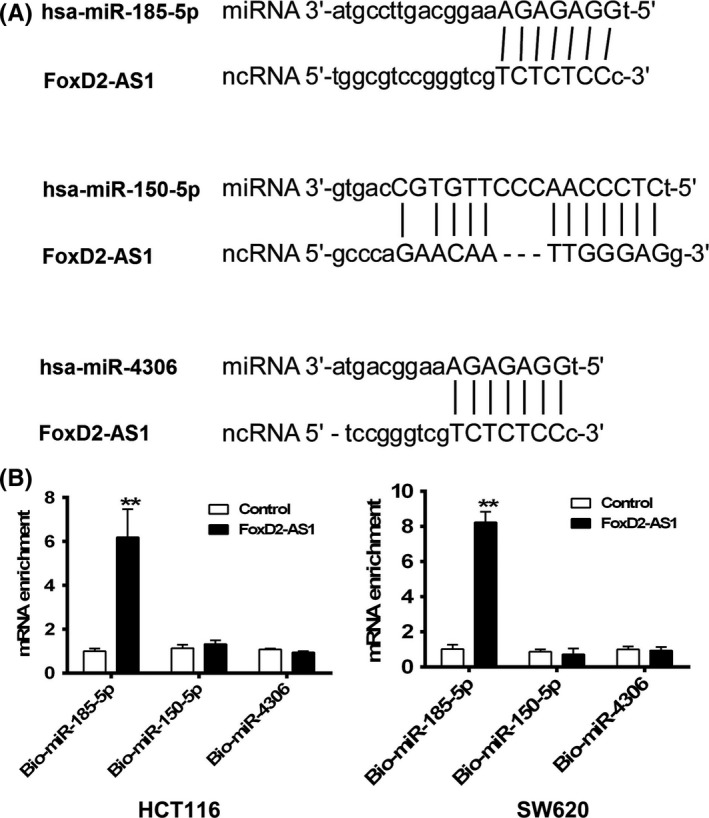
FOXD2‐AS1 interacts with microRNA (miR)‐185‐5p in colorectal cancer cells. A, Predicted interaction between human miR‐185‐5p and FOXD2‐AS1 in Starbase. B, Synthetic biotin‐labeled microRNAs were transfected into HCT116 and SW620 cells and mRNA levels of FOXD2‐AS1 were tested by quantitative RT‐PCR in precipitates pulled down by streptavidin (B). **P < .01, two‐way ANOVA test
3.4. FOXD2‐AS1 regulates CDC42 expression at transcriptional and protein levels
To investigate the effects of this association, overexpression of FOXD2‐AS1 was carried out in HCT‐116 and SW620 cell lines, both of which have relatively low expression levels of FOXD2‐AS1. In contrast, FOXD2‐AS1 was knocked down in HT‐29 and LOVO cell lines, both of which have high expression of FOXD2‐AS1. The miR‐185‐5p level was evaluated by qRT‐PCR in these four cell lines. Decrease in the expression of miR‐185‐5p was found in HCT‐116 and SW620 cells with overexpression of FOXD2‐AS1 (Figure 4A), in contrast to the increase in expression of miR‐185‐5p in HT‐29 and LOVO cells, which have knockdown levels of FOXD2‐AS1 (Figure 4B).
Figure 4.
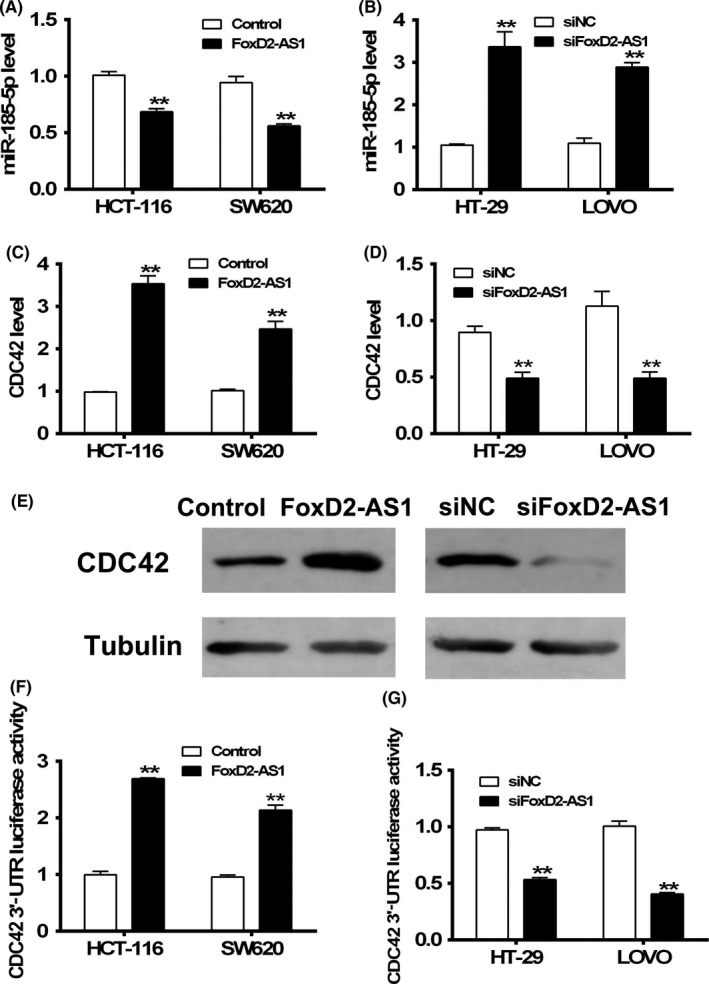
FOXD2‐AS1 negatively regulates microRNA (miR)‐185‐5p and positively regulates cell division control protein 42 (CDC42) expression. A,B, miR‐185‐5p levels were measured by quantitative RT‐PCR in HCT116 and SW620 cells overexpressing FOXD2‐AS1 (A) and in HT‐29 and LOVO cells with knockdown of FOXD2‐AS1 expression (B). C‐E, CDC42 mRNA levels (C,D) and protein levels (E) were evaluated in these cells. F,G, Luciferase assay was carried out to investigate the regulatory effects of FOXD2‐AS1 on CDC42 regulatory 3′‐UTR region in these cells. **P < .01, two‐way ANOVA test
Cell division control 42 is a downstream target of miR‐185‐5p and involved in the proliferation of colorectal cells.17 Therefore, expression of CDC42 in the aforementioned four transfection‐modified cell lines was evaluated. Not surprisingly, overexpression of FOXD2‐AS1 resulted in elevation in the CDC42 at RNA and protein levels (Figure 4C,E). Reduced expression of FOXD2‐AS1 led to diminished CDC42 at RNA and protein levels (Figure 4D,E). Next, luciferase assay was used in the aforementioned four cell lines transfected with pGL3 harboring the CDC42 3′‐UTR region, a region that showed direct regulatory effects on CDC42 expression. Positive regulation of CDC42 3′‐UTR activity by FOXD2‐AS1 was determined by either overexpressing (Figure 4F) or knocking down (Figure 4G) FOXD2‐AS1 in the colon cancer cell lines. In addition, we used an alternative set of siRNA targeting FOXD2‐AS1 to exclude the possibility of off‐target effects of the original FOXD2‐AS1 siRNA set (Figure S3).
3.5. FOXD2‐AS1 promotes proliferation, migration, and invasion in a miR‐185‐5p‐dependent manner
As FOXD2‐AS1 is associated with miR‐185‐5p and regulates its expression, we undertook a rescue experiment wherein SW620 cells overexpressing FOXD2‐AS1 were transfected transfected with either control miRNA duplexes or miR‐185‐5p duplexes. The MTT assay showed that miR‐185‐5p expression partially suppressed FOXD2‐AS1‐induced cell proliferation (Figure 5A). In addition, cell proliferation evaluated by crystal violet staining consistently illustrated that the colony number formed in cells overexpressing FOXD2‐AS1 and transfected with miR‐185‐5p was less than those overexpressing FOXD2‐AS1 only (Figure 5B). In the wound healing assay, transfection with miR‐186‐5p facilitated wound closure in the cells overexpressing FOXD2‐AS1, compared with the FOXD2‐AS1 + NC group (Figure 5C). Finally, reduction in cell motility and invasion was observed in the FOXD2‐AS1 + miR‐185‐5p group compared with the FOXD2‐AS1 + NC group in the Transwell assay (Figure 5D).
Figure 5.
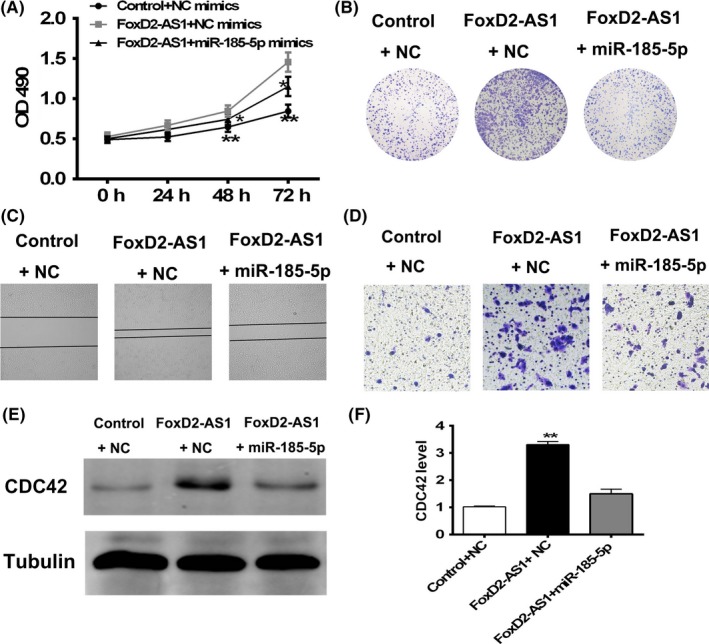
Antagonistic effects of FOXD2‐AS1 and microRNA (miR)‐185‐5p in colorectal cancer. SW620 cells were transfected with control (NC) miRNA mimics, pCDNA3‐FOXD2‐AS1 + NC mimics, or pCDNA3‐FOXD2‐AS1 + miR‐158‐5p mimics. A‐D, Cell proliferation (A,B), migration (C), and invasion (D) were investigated. E,F, Cell division control protein 42 (CDC42) level was induced by FOXD2‐AS1 overexpression at protein (E) and mRNA (F) levels. *P < .05, two‐way ANOVA test; **P < .01, one‐way ANOVA test
3.6. MicroRNA‐185‐5p negatively regulates CDC42 expression
Next, we tested the effects of miR‐185‐5p on FOXD2‐AS1‐induced expression of CDC42. By Western blot analysis and qRT‐PCR, we found that transfection of miR‐185‐5p partially suppressed the induction of CDC42 expression by FOXD2‐AS1 (Figure 5E,F), indicating that CDC42, the downstream factor of miR‐185‐5p, might be a potential contributor to FOXD2‐AS1‐induced carcinogenesis.
3.7. Correlation of FOXD2‐AS1 with miR‐185‐5p, CDC42 expression, and survival in humans
In our human CRC samples, FOXD2‐AS1, miR‐185‐5p, and CDC42 mRNA levels were determined by qRT‐PCR. Data showed the correlation between FOXD2‐AS1 with miR‐185‐5p and FOXD2‐AS1 with CDC42, analyzed by linear regression (Figure 6). The FOXD2‐AS1 and miR‐185‐5p mRNA levels showed a negative correlation with statistical significance (Figure 6B), whereas FOXD2‐AS1 and CDC42 mRNA levels showed positive correlation with statistical significance (Figure 6A). A 12‐year follow‐up study reported that high expression levels of FOXD2‐AS1 are positively related to a lower 6‐year, but not 12‐year, post‐surgery survival rate (Figure 6C).
Figure 6.
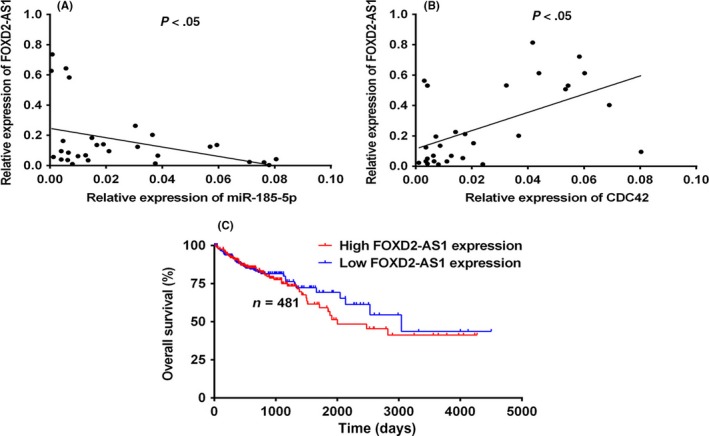
Correlation of FOXD2‐AS1 with cell division control protein 42 (CDC42), microRNA (miR)‐185‐5p, and colorectal cancer patient survival. Linear regression analysis was used to illustrate the correlation between FOXD2‐AS1 and CDC42 (A) and miR‐185‐5p (B). C, FOXD2‐AS1 expression is positively correlated with 6‐y survival rate in colorectal cancer patients, P = .4629
4. DISCUSSION
Epigenetic alterations in human CRC have been recognized and investigated for a long time.5 Abnormalities in epigenetics, including DNA methylation, histone acetylation, and methylation, chromatin remodeling and non‐coding RNAs, have been reported in every aspect of tumor development.18 Genomic mutations and/or aberrant expression of certain regions within the genome do not necessarily encode proteins.19 However, lncRNAs are usually the transcribed products of these regions.19 Long non‐coding RNAs play a critical role in gene regulation, and thereafter has impacts on protein synthesis and multiple aspects of cellular homeostasis.20 By using next‐generation sequencing methods, a great number of lncRNAs have been determined to be associated with different cancer types.19
In our study, we focused on lncRNA FOXD2‐AS1, which has been found to be aberrantly expressed in lung and CRC cancers.10, 12 We tested the expression of FOXD2‐AS1 in human CRC tumors and several CRC cell lines. The data showed consistency with previous findings, wherein CRC tumors/cells have increased expression of FOXD2‐AS1 (Figure 1). In the following functional assays, consistent results were obtained in the cell lines with overexpression and knockdown of FOXD2‐AS1. Overexpression of FOXD2‐AS1 promoted CRC cell proliferation, migration, and invasion (Figure 2A,C‐E). By contrast, reduction in FOXD2‐AS1 suppressed the proliferation, migration, and invasion of CRC cells (Figure 2B,C‐E). These data suggest an oncogene‐like role of FOXD2‐AS1 in the modulation of CRC properties.
Next, we investigated the downstream molecular mechanism of FOXD2‐AS1 in CRC. MicroRNA‐185‐5p was predicted to be a molecule that can directly interact with FOXD2‐AS1 (Figure 3A). In the following biotin–streptavidin pull‐down assay, miR‐185‐5p, but not miR‐150‐5p or miR‐4306, was found to be associated with FOXD2‐AS1 (Figure 3B). Therefore, FOXD2‐AS1 and miR‐185‐5p are associated with each other in a complex, if not direct, interaction. Previous studies have reported that lncRNA–miRNA interaction is highly involved in the regulation of gene expression.21 Long non‐coding RNA might function as endogenous sponges to absorb miRNA, which subsequently reduces the level of free miRNA and regulates gene expression.22, 23 We found that the miRNA‐185‐5p expression level was negatively regulated by FOXD2‐AS1 (Figure 4A,B). In addition, the transcriptomic and translational expression of CDC42, a miRNA‐185‐5p direct target, was also affected by FOXD2‐AS1 (Figure 4C‐G), indicating that CDC42 could be a downstream effector in the FOXD2‐AS1–miRNA‐185‐5p axis. The cotransfection rescue experiment further revealed the antagonistic roles of FOXD2‐AS1 and miRNA‐185‐5p in the regulation of carcinogenic properties of CRC cells (Figure 5A‐D). Finally, CDC42 expression was found to be reduced following miR‐185‐5p expression in the presence of FOXD2‐AS1 (Figure 5E,F). Collectively, FOXD2‐AS1 and miRNA‐185‐5p interact with each other and antagonistically regulate the carcinogenic properties of CRC cells, and CDC42 expression is significantly affected by both FOXD2‐AS1 and miRNA‐185‐5p.
In human CRC tumors, FOXD2‐AS1 was significantly correlated with CDC42 and miR‐185‐5p (Figure 6A,B). Strikingly, FOXD2‐AS1 levels are closely associated with 6‐year survival rates in CRC patients (Figure 6C). As CRC usually develops from early‐stage benign precancerous polyps to late‐stage metastatic disease, the discovered association between FOXD2‐AS1 and CRC survival could potentially be used as an early biomarker of CRC; patients with high expression levels of FOXD2‐AS1 in colon tissue should be cautioned and subjected to further screening or diagnoses procedures.
A previous study found the FOXD2‐AS1 is involved in the regulation of N‐ and E‐cadherin expression,10 two important proteins in epithelial–mesenchymal transition in CRC. During epithelial–mesenchymal transition, CDC42 plays a regulatory role in actin rearrangement and assembly, including the formation of lamellipodia and filopodia.24 Hence, it is hypothesized that FOXD2‐AS1 interacts with miR‐185‐5p to regulate the expression of CDC42, which may be responsible for the alterations in N‐ and E‐cadherin.25 This needs to be tested further.
In summary, we found that FOXD2‐AS1 plays a negative role in CRC carcinogenesis through its interplay with miR‐185‐5p and CDC42. The expression of FOXD2‐AS1 is significantly associated with miR‐185‐5p and CDC42, and implicated in the survival of patients with CRC.
CONFLICT OF INTEREST
The authors have no conflict of interest.
Supporting information
Zhu Y, Qiao L, Zhou Y, Ma N, Wang C, Zhou J. Long non‐coding RNA FOXD2‐AS1 contributes to colorectal cancer proliferation through its interaction with microRNA‐185‐5p. Cancer Sci. 2018;109:2235–2242. https://doi.org/10.1111/cas.13632
Funding information
This work was supported by the Henan Provincial Bureau of Science and Technology, Grant No. 162102310016de
Contributor Information
Chaojie Wang, Email: wangchaojiefbx@126.com.
Jianwei Zhou, Email: zhoujianweicxm@126.com.
REFERENCES
- 1. Rosa MD, Pace U, Rega D, et al. Genetics, diagnosis and management of colorectal cancer (Review). Oncol Rep. 2015;34:1087‐1096. [DOI] [PMC free article] [PubMed] [Google Scholar]
- 2. Ferlay J, Soerjomataram I, Dikshit R, et al. Cancer incidence and mortality worldwide: sources, methods and major patterns in GLOBOCAN 2012. Int J Cancer. 2015;136:E359‐E386. [DOI] [PubMed] [Google Scholar]
- 3. Yang T, Owen JL, Lightfoot YL, Kladde MP, Mohamadzadeh M. Microbiota impact on the epigenetic regulation of colorectal cancer. Trends Mol Med. 2013;19:714‐725. [DOI] [PMC free article] [PubMed] [Google Scholar]
- 4. Fearon ER. Molecular genetics of colorectal cancer. Semin Colon Rectal Surg. 2010;768:101‐110. [Google Scholar]
- 5. Pancione M, Remo A, Colantuoni V. Genetic and epigenetic events generate multiple pathways in colorectal cancer progression. Patholog Res Int. 2012;2012:509348. [DOI] [PMC free article] [PubMed] [Google Scholar]
- 6. Gao Z, Guo B, Gao R, Zhu Q, Qin H. Microbiota disbiosis is associated with colorectal cancer. Front Microbiol. 2015;6:20. [DOI] [PMC free article] [PubMed] [Google Scholar]
- 7. Rubin DC, Shaker A, Levin MS. Chronic intestinal inflammation: inflammatory bowel disease and colitis‐associated colon cancer. Front Immunol. 2012;3:107. [DOI] [PMC free article] [PubMed] [Google Scholar]
- 8. Kung JTY, Colognori D, Lee JT. Long noncoding RNAs: past, present, and future. Genetics. 2013;193:651‐669. [DOI] [PMC free article] [PubMed] [Google Scholar]
- 9. Iyer MK, Niknafs YS, Malik R, et al. The landscape of long noncoding RNAs in the human transcriptome. Nat Genet. 2015;47:199. [DOI] [PMC free article] [PubMed] [Google Scholar]
- 10. Yang X, Duan B, Zhou X. Long non‐coding RNA FOXD2‐AS1 functions as a tumor promoter in colorectal cancer by regulating EMT and Notch signaling pathway. Eur Rev Med Pharmacol Sci. 2017;21:3586. [PubMed] [Google Scholar]
- 11. Li CY, Liang GY, Yao WZ, et al. Integrated analysis of long non‐coding RNA competing interactions reveals the potential role in progression of human gastric cancer. Int J Oncol. 2016;48:1965. [DOI] [PubMed] [Google Scholar]
- 12. Lin R, Zhao R, Lu J. Highly expressed long non‐coding RNA FOXD2‐AS1 promotes non‐small cell lung cancer progression via Wnt/β‐catenin signaling. Biochem Biophys Res Comm. 2017;484:586‐591. [DOI] [PubMed] [Google Scholar]
- 13. Zhang J, Fan D, Jian Z, Chen GG, Lai PBS. Cancer specific long noncoding RNAs show differential expression patterns and competing endogenous RNA potential in hepatocellular carcinoma. PLoS ONE. 2015;10:e0141042. [DOI] [PMC free article] [PubMed] [Google Scholar]
- 14. Yang JH, Li JH, Shao P, Zhou H, Chen YQ, Qu LH. starBase: a database for exploring microRNA‐mRNA interaction maps from Argonaute CLIP‐Seq and Degradome‐Seq data. Nucleic Acids Res. 2011;39:202‐209. [DOI] [PMC free article] [PubMed] [Google Scholar]
- 15. Li JH, Liu S, Zhou H, Qu LH, Yang JH. starBase v2.0: decoding miRNA‐ceRNA, miRNA‐ncRNA and protein‐RNA interaction networks from large‐scale CLIP‐Seq data. Nucleic Acids Res. 2014;42:D92. [DOI] [PMC free article] [PubMed] [Google Scholar]
- 16. Hansen TB, Jensen TI, Clausen BH, et al. Natural RNA circles function as efficient microRNA sponges. Nature. 2013;495:384‐388. [DOI] [PubMed] [Google Scholar]
- 17. Liu M, Lang N, Chen X, et al. miR‐185 targets RhoA and Cdc42 expression and inhibits the proliferation potential of human colorectal cells. Cancer Lett. 2011;301:151‐160. [DOI] [PubMed] [Google Scholar]
- 18. Vaiopoulos AG, Athanasoula KC, Papavassiliou AG. Epigenetic modifications in colorectal cancer: molecular insights and therapeutic challenges. Biochem Biophys Acta. 2014;1842:971‐980. [DOI] [PubMed] [Google Scholar]
- 19. Huarte M. The emerging role of lncRNAs in cancer. Nat Med. 2015;21:1253. [DOI] [PubMed] [Google Scholar]
- 20. Mitchell G, Ido A, Manuel G, et al. Chromatin signature reveals over a thousand highly conserved large non‐coding RNAs in mammals. Nature. 2009;458:223. [DOI] [PMC free article] [PubMed] [Google Scholar]
- 21. Jalali S, Bhartiya D, Lalwani MK, Sivasubbu S, Scaria V. Systematic transcriptome wide analysis of lncRNA‐miRNA interactions. PLoS ONE. 2013;8:e53823. [DOI] [PMC free article] [PubMed] [Google Scholar]
- 22. Cesana M, Cacchiarelli D, Legnini I, et al. A long noncoding RNA controls muscle differentiation by functioning as a competing endogenous RNA. Cell. 2011;147:358‐369. [DOI] [PMC free article] [PubMed] [Google Scholar]
- 23. Kallen AN, Zhou XB, Xu J, et al. The imprinted H19 LncRNA antagonizes Let‐7 MicroRNAs. Mol Cell. 2013;52:101‐112. [DOI] [PMC free article] [PubMed] [Google Scholar]
- 24. Nobes CD, Hall A. Rho, Rac, and Cdc42 GTPases regulate the assembly of multimolecular focal complexes associated with actin stress fibers, lamellipodia, and filopodia. Cell. 1995;81:53. [DOI] [PubMed] [Google Scholar]
- 25. Lamouille S, Xu J, Derynck R. Molecular mechanisms of epithelial–mesenchymal transition. Nat Rev Mol Cell Biol. 2014;15:178‐196. [DOI] [PMC free article] [PubMed] [Google Scholar]
Associated Data
This section collects any data citations, data availability statements, or supplementary materials included in this article.
Supplementary Materials


