Abstract
HSPC159 is a novel human galectin‐related protein that has been shown to be involved in carcinogenesis. Little is known about HSPC159 expression and function in breast cancer. Herein we showed that HSPC159 was aberrantly expressed in both breast cancer cell lines and tumor tissues and that its expression was associated with poor prognosis of breast cancer patients. Using gain‐ and loss‐of‐function methods we found that HSPC159 enhanced breast cancer cell proliferation and metastasis in vitro and in vivo. Mechanistically, HSPC159 was found to induce epithelial‐mesenchymal transition (EMT) and the F‐actin polymerization process of breast cancer cells. Moreover, HSPC159 promoted proliferation, migration and invasion through activating the PI3K/Akt signaling pathway in breast cancer. In conclusion, our findings showed that HSPC159 contributed to breast cancer progression through the PI3K/Akt pathway and might serve as a potential therapeutic target for the treatment of breast cancer.
Keywords: Akt, EMT, HSPC159, metastasis, proliferation
Abbreviations
- Akt
Protein Kinase B
- cDNA
complementary DNA
- CRD
carbohydrate‐recognition domain
- EGF
epidermal growth factor
- EMT
epithelial‐mesenchymal transition
- IHC
immunohistochemistry
- N‐cadherin
neural cadherin
1. INTRODUCTION
Breast cancer is the most common malignant tumor of women worldwide, accounting for 25% of all cancer incidence and 15% of all cancer deaths among women.1 Despite advances in surgical and chemotherapeutic treatment, the long‐term survival rate for advanced breast cancer patients remains low, mainly as a result of tumor relapse or distant metastasis. Although a large number of oncogenes and tumor suppressors have been found to be involved in the development of breast cancer, the molecular mechanisms underlying the process of breast cancer occurrence and development still need to be explored in order to elucidate potential targets for breast cancer therapy.
The galectins are a family of 15 mammalian galactoside‐binding proteins that contain conserved CRD of approximately 130 amino acids and have an affinity for β‐galactosides.2 Based on their structural differences and the number of CRD within their polypeptide chains, galectins are classified into 3 subgroups: prototype, tandem‐repeat type, and chimera‐type. Previous studies have reported that galectins play important functions in several aspects of cancer biology, including proliferation, apoptosis, invasion, metastasis and angiogenesis of cancer cells, indicating that galectins might modulate tumor progression and influence disease outcome.2, 3, 4
HSPC159 is a novel human galectin‐related protein (also known as GRP) that is mapped to human chromosome 2p13. The HSPC159 gene was originally deduced by partial sequence alignment and confirmed by a full‐length sequence for an mRNA isolated from CD34+ hematopoietic stem cells.5 The HSPC159 sequence is composed of 5 exons with exon/intron junctions located in positions generally conserved across the galectin family.6 HSPC159 comprises only 1 conserved CRD with 38 additional N‐terminal residues and shares consensus amino acids at 51 of the 64 most highly conserved residues in other galectins.7 However, human HSPC159 shows a serious sequence deviation at 5 of the 7 highly conserved carbohydrate recognition segments, leading to them lacking β‐galactoside binding activity. The biological role of human HSPC159 has so far not been elucidated completely. HSPC159 has been shown to be involved in carcinogenesis. Knockdown of HSPC159 could increase the sensitivity of colon cancer cells to methotrexate,8 implying its oncogenic potential. By conducting microarray analysis, Koch and Wiese9 showed that HSPC159 was downregulated in cervical cancer tissues and HSPC159 was identified as 1 of potential biomarker genes for cervical cancer.9 However, Zhang et al10 indicated that miR‐9 could repress tumorigenesis of cervical adenocarcinoma by targeting HSPC159, implying that HSPC159 might exert distinct and even opposite functions in cervical cancer.
To date, however, there are no reports concerning the expression and biological functions of HSPC159 in human breast cancer. In the present study, we found that HSPC159 was upregulated in breast cancer and correlated with clinicopathological factors of breast cancer patients. HSPC159 depletion effectively suppressed the proliferation and metastasis of breast cancer cells in vitro and in vivo. Moreover, HSPC159 was found to induce EMT and the F‐actin polymerization process of breast cancer cells. We also showed that PI3K/Akt signaling was involved in the oncogenic effects of HSPC159 in breast cancer. Our study might present valuable information for elucidating the pathogenesis mechanism of breast cancer and provide a potential biomarker for breast cancer therapy.
2. MATERIALS AND METHODS
2.1. Patient samples
Ninety‐six human invasive breast carcinoma specimens and adjacent non‐tumor tissues were collected at the time of surgical resection from Affiliated Hospital of Weifang Medical University from January 2011 to October 2014. These specimens were obtained from primary breast cancer patients who had not previously received chemotherapy or radiotherapy. This study was approved by the Ethics Committee of Weifang Medical University and written informed consent was obtained from all patients.
2.2. Immunohistochemistry staining and scoring system
Immunohistochemistry was carried out to investigate the expression of HSPC159 protein in human breast cancer and adjacent non‐tumorous tissues. Sections were incubated overnight with polyclonal antibody against HSPC159 (1:200; Abcam, London, UK) at 4°C. All slides were counterstained with hematoxylin. Results were graded for staining intensity (0, negative; 1, weak; 2, moderate; 3, strong) and percentage of positive cells (0; 1, 1%‐25%; 2, 26%‐50%; 3, 51%‐75%; 4, 76%‐100%). These scores were added to produce the final score: high (score ≥4) and low or none (score 0‐3).
2.3. Cell culture and transfection
Human breast cancer cell lines MDA‐MB‐231, MDA‐MB‐468, MCF‐7 and T47D were obtained from ATCC (Manassas, VA, USA) and were cultured in DMEM or RPMI 1640 medium (Hyclone, Logan, UT, USA) supplemented with 10% FBS at a humidity of 5% CO2 at 37°C. For transient transfection, HSPC159 siRNA or the negative control (RiboBio, Guangzhou, China) were transfected into MDA‐MB‐231 cells using Lipofectamine 2000 (Invitrogen, Carlsbad, CA, USA) according to the manufacturer's instructions. For stable transfection, HSPC159 shRNA plasmid containing a target sequence and a vector containing a scrambled sequence were obtained from Santa Cruz Biotechnology (Santa Cruz, CA, USA). Stable cell lines that expressed HSPC159 shRNA plasmid or a vector were selected for 10 days with 0.3 mg/mL puromycin.
Full‐length human HSPC159 cDNA was amplified by PCR and cloned into pcDNA3.1 plasmid (Invitrogen) and was confirmed by DNA sequencing. MCF‐7 cells were transfected with pcDNA3.1‐HSPC159 plasmid or pcDNA3.1 vector using Lipofectamine 2000.
2.4. RNA extraction and quantitative reverse transcription PCR (qRT‐PCR)
Total RNA was extracted from cell lines and tissues using Trizol (Invitrogen) and cDNA was synthesized using the ReverTra Ace qPCR RT Kit (Toyobo, Osaka, Japan). Real‐time quantitative PCR was carried out using FastStart Universal SYBR Green Master (Roche Diagnostic GmbH, Mannheim, Germany). Relative expression of HSPC159 was detected using the 2−ΔΔCT method.
2.5. Cell counting Kit‐8 assay
Cell proliferation was measured at 24, 48, and 72 hours after transfection. CCK‐8 solution (Dojindo, Gaithersburg, MD, USA) was added to the culture medium, followed by an incubation of 4 hours and the optical density was read at 450 nm.
2.6. EdU assay
A Cell‐Light™ EdU Apollo® 488 In Vitro Imaging Kit (RiboBio) was used to carry out EdU proliferation assay according to the manufacturer's protocol. After EdU labeling, the cells were treated with Apollo reaction cocktail, stained with Hoechst 33342 and visualized under a fluorescence microscope (Olympus, Tokyo, Japan). The percentage of EdU‐positive cells was defined as the proliferation rate.
2.7. Cell migration and invasion assays
Cell migratory and invasive capability in vitro was detected using Transwell chambers (8 μm pore, Costar; Corning, Cambridge, MA, USA) as previously described.11
2.8. Western blot analysis
Western blot was carried out following standard methods. The following commercial antibodies were used in this study: HSPC159 (1:1000; Abcam), E‐cadherin, N‐cadherin, Vimentin, Slug, Snail, Akt, p‐Akt(Ser473), p‐Akt(Thr308), β‐actin (1:1000; Cell Signaling, Boston, MA, USA), Twist1, ZEB1 (1:1000, Santa Cruz Biotechnology).
2.9. Immunofluorescence
Cells were grown on coverslips, fixed in 4% paraformaldehyde for 20 minutes. Primary antibody was carried out overnight at 4°C. The antibodies used were E‐cadherin and N‐cadherin (1:300; Santa Cruz Biotechnology). Cells were costained with DAPI to detect nuclei. The results were analyzed using fluorescence microscopy.
2.10. Xenograft model experiment
Four‐week‐old SCID mouse were purchased from Beijing HFK Bioscience Co., Ltd (Beijing, China). All animal work procedures were approved by the Ethics Committee of Weifang Medical University. MDA‐MB‐231 cells transfected stably with shRNA‐HSPC159 or sh‐negative control were injected into the fat pads or the through tail vein (4 × 10⁶ cells per mouse), respectively, into SCID mice (6 for each group). Tumor sizes were measured using a caliper every 7 days when the tumors were apparent. All mice were killed after 5 weeks (fat pads xenograft group) or 8 weeks (lung metastases xenograft group), and the tumor nodules and lungs of mice were isolated. Tumor volume was calculated according to the following equation:
Lung tissues were fixed with formalin, embedded in paraffin and H&E staining serial slides were carried out to detect micrometastases.
2.11. Cellular F‐actin measurement
Breast cancer cells were suspended in medium supplemented with 10 mmol/L HEPES (pH 7.2) and 2% (w/v) BSA at a concentration of 2.5 × 10³ cells per mL and incubated at 37°C for 3 hours. Next, these cells were stimulated by 10 ng/mL EGF at 37°C for the indicated period of time, then cells were fixed with 4% paraformaldehyde for 10 minutes, permeabilized using 0.1% Triton X‐100 for 30 minutes, and incubated with rhodamine phalloidin for 60 minutes. After these cells were washed 5 times, F‐actin content was measured with a microplate fluorescence reader with an excitation 578‐nm wavelength and an emission 600‐nm wavelength. Fluorescence signals were normalized against total protein. The relative F‐actin content over different time periods was calculated according to the following equation:
2.12. F‐actin fluorescence microscopy
Cells were cultured 24 hours before this experiment and starved in serum‐free medium for 3 hours. The cells were then stimulated with 10 ng/mL EGF at 37°C for 2 minutes and fixed with 4% paraformaldehyde. After permeabilization with 0.1% Triton X‐100, cells were incubated with Alexa‐Fluor 568 phalloidin for 30 minutes in the dark and gently washed with F‐actin buffer. The cells were visualized with the inverted fluorescent microscope (Olympus).
2.13. Statistical analysis
Statistical significance was determined with Student's t test, 1‐way analysis of variance or a chi‐squared test as appropriate. Survival rates were calculated by the Kaplan‐Meier method and compared by the log‐rank test. Each experiment was repeated 3 times. Statistical analyses were analyzed using GraphPad Prism 5 software (GraphPad Software, Inc., San Diego, CA, USA). P < .05 was considered to be statistically significant.
3. RESULTS
3.1. Upregulation of HSPC159 in breast cancer tissues and cell lines
Immunohistochemistry analysis was carried out to investigate HSPC159 protein expression in an independent panel of 96 paraffin‐embedded breast samples with follow‐up data. The positive HSPC159 expression rate was 54.17% (52/96) in breast tissue samples and 25.0% (10/40) in adjacent non‐tumor tissues (Figure 1A, P < .05).
Figure 1.
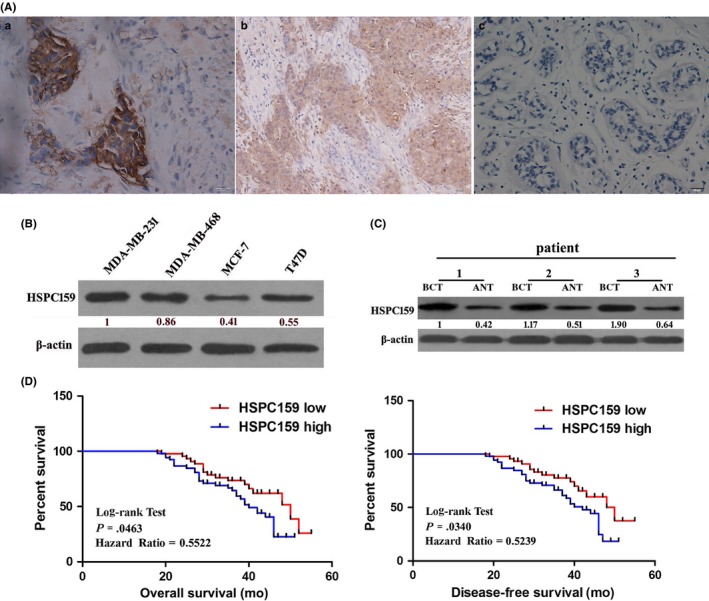
Expression of HSPC159 in breast cancer tissues and invasive breast cancer cell lines. A, Immunohistochemistry analysis of HSPC159 protein levels in 96 primary invasive breast cancer and adjacent normal tissues. a, strong staining of HSPC159 in breast cancer tissues. b, weak staining of HSPC159 in breast cancer tissues. c, negative staining of HSPC159 in adjacent normal tissues. B, Relative expression level of HSPC159 in different breast cancer cell lines. C, HSPC159 protein expression level in paired breast cancer tissues and adjacent non‐cancerous tissues. D, Kaplan‐Meier curves with univariate analysis of overall survival and disease‐free survival based on HSPC159 expression. ANT, adjacent non‐tumor tissues; BCT, human breast cancer tissues
To further demonstrate the function of HSPC159 in human breast cancer, western blot was done to assess HSPC159 expression in a series of breast cancer cell lines. As shown in Figure 1B, highly invasive cells MDA‐MB‐231 and MDA‐MB‐468 expressed higher HSPC159 and lowly invasive cells MCF‐7 and T47D expressed lower HSPC159. Moreover, western blot analyses of 20 pairs of randomly selected human breast cancer tissues (BCT) and adjacent non‐tumor tissues (ANT) showed that HSPC159 protein levels were significantly increased in cancer tissues compared with matched ANT (P < .05; Figure 1C). These results showed that expression of HSPC159 was increased in both clinical primary breast cancer tissues and in human highly invasive breast cancer cell lines.
3.2. Correlation of HSPC159 with clinicopathological features
In order to gain a better understanding of the influences of HSPC159 on breast cancer, we evaluated the associations between HSPC159 expression and clinicopathological factors. Patients were divided into the HSPC159 high‐expression group (n = 52) and the HSPC159 low‐ or no‐expression group (n = 44) based on IHC scores. As listed in Table 1, high HSPC159 expression was strongly correlated with tumor size (P = .040), clinical stage (P = .043), lymph node metastasis (P = .021), and tumor differentiation (P = .012). These results confirmed that high expression of HSPC159 was correlated with progression and metastasis of human breast cancer.
Table 1.
Association of HSPC159 expression with clinicopathological features of breast cancer patients
| Variable | n | Expression of HSPC159 | P‐value | |
|---|---|---|---|---|
| Low or none | High | |||
| Age (years) | ||||
| >50 | 55 | 24 | 31 | .682 |
| ≤50 | 41 | 20 | 21 | |
| Tumor size (cm) | ||||
| >3 | 51 | 18 | 33 | .040a |
| ≤3 | 45 | 26 | 19 | |
| Clinical stage | ||||
| I + II | 50 | 28 | 22 | .043a |
| III + IV | 46 | 16 | 30 | |
| Lymph node metastasis | ||||
| Negative | 57 | 32 | 25 | .021a |
| Positive | 39 | 12 | 27 | |
| Tumor differentiation | ||||
| I | 21 | 15 | 6 | .012a |
| II | 50 | 22 | 28 | |
| III | 25 | 7 | 18 | |
| ER status | ||||
| Negative | 46 | 24 | 22 | .307 |
| Positive | 50 | 20 | 30 | |
| PR status | ||||
| Negative | 41 | 21 | 20 | .411 |
| Positive | 55 | 23 | 32 | |
| HER2 status | ||||
| Negative (IHC 0‐2+) | 60 | 24 | 36 | .147 |
| Positive (IHC 3+) | 36 | 20 | 16 | |
ER, estrogen receptor; HER‐2, human epidermal growth factor receptor; IHC, immunohistochemistry; PR, progesterone receptor.
These P‐values are significant.
3.3. High expression of HSPC159 predicted a poor prognosis of breast cancer patients
Kaplan‐Meier analysis using the log‐rank test was carried out to investigate whether the expression of HSPC159 was associated with survival of breast cancer patients. Patients with high expression of HSPC159 had shorter overall survival (hazard ratio [HR] = 0.5522, P = .0463) and disease‐free survival (HR = 0.5239, P = .034) compared with patients with low HSPC159 expression (Figure 1D). Thus, HSPC159 might be a valuable prognostic marker for patients with breast cancer.
3.4. HSPC159 promoted breast cancer cell proliferation in vitro and in vivo
To monitor transfection efficiency, western blot was carried out to determine HSPC159 expression at 48 hours after transfection. As expected, HSPC159 expression was significantly lower in MDA‐MB‐231 cells transfected with HSPC159 siRNA (si‐HSPC159/MDA231) than in negative control groups (NC/MDA231) (Figure 2A). At the same time, upregulated expression of HSPC159 was detected in MCF‐7 cells transfected with pcDNA3.1‐HSPC159 plasmid (overHSPC159/MCF‐7) compared with that transfected with empty plasmid (Con/MCF‐7) (Figure 2B).
Figure 2.
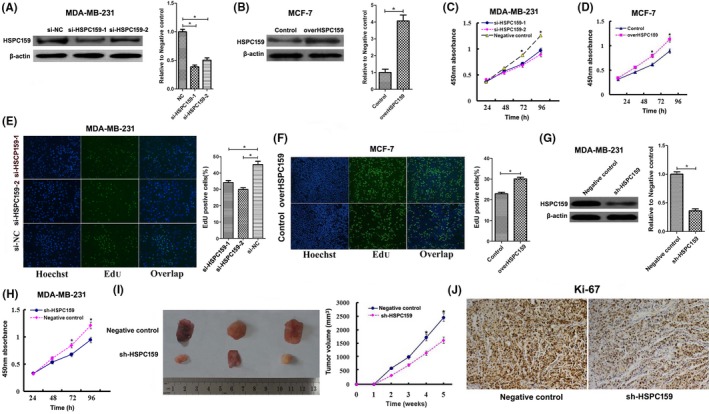
HSPC159 promoted breast cancer cell proliferation in vitro and in vivo. A, Western blot analysis showed siRNA targeting HSPC159 reduced HSPC159 expression level in MDA‐MB‐231 cells. B, Western blot analysis showed that the protein level of HSPC159 was increased after transfection with pcDNA3.1‐HSPC159 plasmid compared with negative control in MCF‐7 cells. C,D, Cell proliferation rates were measured using CCK‐8 assays in MDA‐MB‐231 cells (C) and MCF‐7 cells (D) after transfection. E,F, Results of EdU assays also confirmed the effect of HSPC159 on cell proliferation. G, Western blot analysis showed shRNA targeting HSPC159 reduced HSPC159 expression level in MDA‐MB‐231 cells. H, Cell proliferation rate was measured using CCK‐8 assays in MDA‐MB‐231 cells after shRNA transfection. I, Knockdown of HSPC159 in MDA‐MB‐231 cells suppressed tumorigenesis in vivo. Tumor volumes were measured on the indicated days. J, Immunohistochemistry for Ki‐67 detection showed that tumor cells in the negative control group showed a higher positivity rate than those in the shRNA‐HSPC159 group (magnification ×200). *P < .05
To assess whether HSPC159 could affect the proliferation of breast cancer cells, CCK‐8 assay indicated that HSPC159 knockdown inhibited proliferation of MDA‐MB‐231 cells (Figure 2C), whereas HSPC159 overexpression significantly enhanced cell growth of MCF‐7 cells (Figure 2D). Furthermore, EdU assay confirmed that decreased expression of HSPC159 significantly reduced EdU staining (Figure 2E). Consistently, HSPC159 overexpression increased EdU staining (Figure 2F).
In order to investigate the effect of HSPC159 on tumor growth in vivo, xenograft SCID model experiments were carried out. Western blot confirmed that HSPC159 expression was downregulated in MDA‐MB‐231 cells transfected with HSPC159 shRNA compared with that in negative control groups (Figure 2G). CCK‐8 assay showed that downregulation of HSPC159 suppressed the proliferation rate of MDA‐MB‐231 cells after shRNA transfection (Figure 2H). Average size of primary tumors from mice injected with sh‐HSPC159/MDA231 cells was decreased compared with that of negative control groups (Figure 2I). Tumor growth in the sh‐HSPC159 group was obviously slower than that in the NC group (Figure 2I). Immunohistochemistry for Ki‐67 showed tumor cells in the control group had more proliferative activity compared with those in the sh‐HSPC159 group (Figure 2J). In conclusion, these results showed that HSPC159 promoted tumor growth in vitro and in vivo.
3.5. Downregulation of HSPC159 inhibited migration and invasion abilities of breast cancer cells in vitro and in vivo
Given that HSPC159 was highly expressed in metastatic breast cancer tissues and cell lines, we carried out cell migration and invasion assay to investigate the role of HSPC159 in breast cancer cells. As shown in Figure 3A, si‐HSPC159/MDA231 cells showed a significantly reduced migration and invasion capacity compared with that of negative control cells. Moreover, the overHSPC159/MCF‐7 cells had increased migration and invasion abilities compared with the Con/MCF‐7 cells (Figure 3B). These results suggested that HSPC159 played an important role in the migration and invasion of breast cancer cells in vitro.
Figure 3.
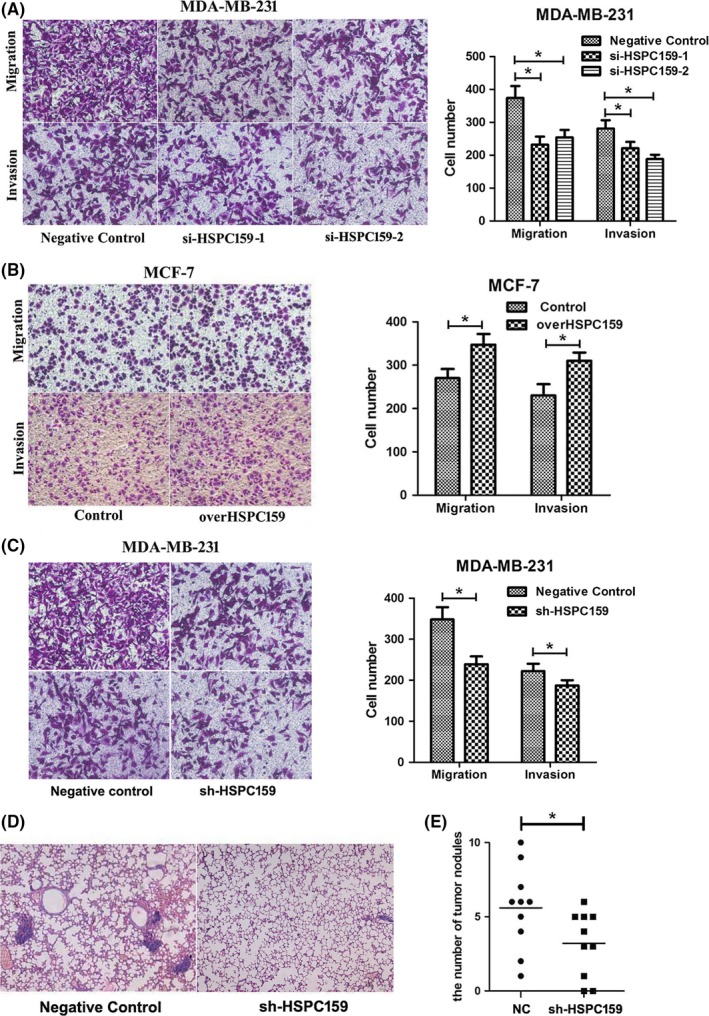
HSPC159 enhanced the migration and invasion ability of breast cancer cells in vitro and in vivo. A, Transwell assays showed that depleted cells had less migratory and invasive capacity in MDA‐MB‐231 cells. B, Effect of HSPC159 overexpression on cell migration and invasion ability in MCF‐7 cells. C, MDA‐MB‐231 cells showed reduced migration and invasion capacity after shRNA transfection. D, Representative metastasis images are shown with H&E staining. E, Number of lung metastases of indicated SCID mice groups. *P < .05
MDA‐MB‐231 cells also showed reduced migration and invasion capacity after shRNA transfection compared with negative control cells (Figure 3C). The metastatic properties of breast cancer cells were analyzed in vivo through a xenograft transplant model in SCID mice. Metastatic foci in mouse lungs were examined through H&E staining slides. As shown in Figure 3D,E, the number of lung metastatic nodules in the shRNA‐HSPC159 group was decreased compared to the negative control group (P < .05). These data demonstrated that HSPC159 had a pivotal role in mediating breast cancer cell invasion and metastasis.
3.6. HSPC159 knockdown suppressed the EMT process of breast cancer cells
Epithelial‐mesenchymal transition plays an important role in cancer cell migration and invasion. In order to determine the relationship between HSPC159 expression and EMT, we examined the expression of key EMT biomarkers after HSPC159 was knocked down. Western blot analysis showed that depletion of endogenous HSPC159 significantly increased the expression of the epithelial marker E‐cadherin and suppressed the expression of the mesenchymal markers N‐cadherin and vimentin in MDA‐MB‐231 cells (Figure 4A). In overHSPC159/MCF‐7 cells, expression of E‐cadherin was downregulated, whereas that of N‐cadherin and vimentin was upregulated (Figure 4B). Immunofluorescence staining of cells showed the same results (Figure 4C). We then examined EMT‐associated transcription factors, and our results showed that silenced HSPC159 inhibited the expression of Snail and Twist, but had no effect on Slug and ZEB1 compared with the control group in MDA‐MB‐231 cells (Figure 4D). Meanwhile, the expression of Snail and Twist was upregulated in overHSPC159/MCF‐7 cells (Figure 4E). These data indicated that HSPC159 could regulate breast cancer cell EMT processes through Snail and Twist.
Figure 4.
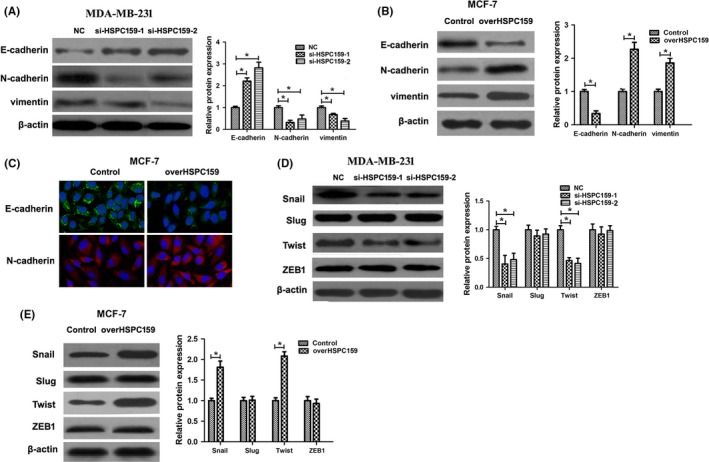
Knockdown of HSPC159 inhibited the epithelial‐mesenchymal transition (EMT) process of breast cancer cells. A, Western blot analysis showed that EMT marker E‐cadherin was upregulated, and that EMT markers N‐cadherin and vimentin were downregulated after knockdown of HSPC159 in MDA‐MB‐231 cells. B, Western blot analysis showed that EMT marker E‐cadherin was downregulated, and that N‐cadherin and vimentin were upregulated after overexpression of HSPC159 in MCF‐7 cells. C, Immunofluorescence staining of E‐cadherin and N‐cadherin after overexpression of HSPC159 in MCF‐7 cells. D,E, Expression of EMT‐associated transcription factors in MDA‐MB‐231 and MCF‐7 cells by western blot. *P < .05
3.7. Reduction of HSPC159 impaired F‐actin polymerization in breast cancer cells
Quick and transient F‐actin polymerization plays an important role in the process of cellular chemotaxis which is crucial for invasion and metastasis. F‐actin polymerization was carried out to investigate whether HSPC159 knockdown could inhibit F‐actin polymerization of MDA‐MB‐231 cells. Results showed that EGF elicited transient actin polymerization at from 15 seconds to 2 minutes in NC/MDA231 cells; however, actin polymerization was obviously reduced in si‐HSPC159/MDA231 cells (Figure 5A). EGF induced an increase in F‐actin content in negative control cells, but not in si‐HSPC159/MDA231 cells (Figure 5B). These results showed that HSPC159 plays a vital role in regulating cytoskeleton rearrangement.
Figure 5.
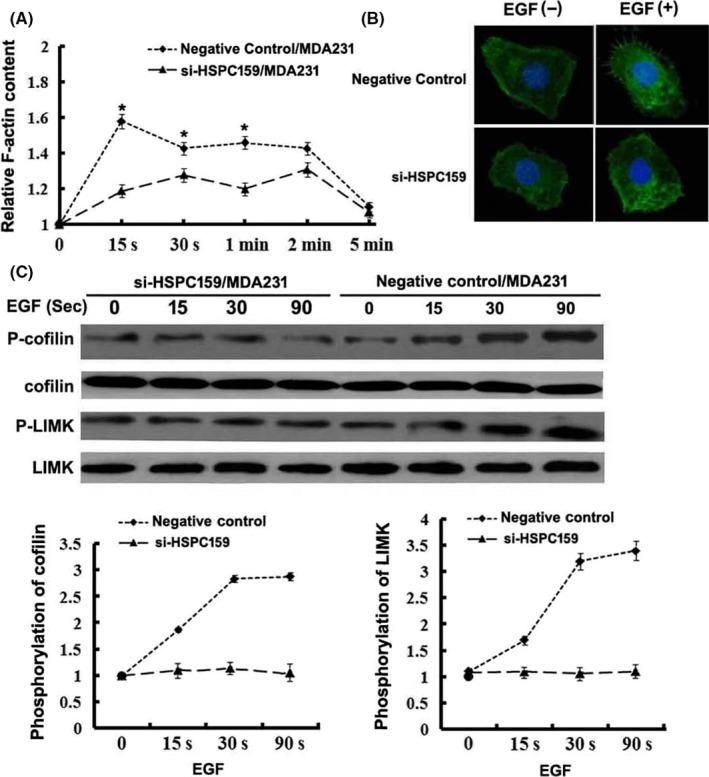
HSPC159 promoted F‐actin polymerization in breast cancer cells. A, Time course of relative F‐actin content in MDA‐MB‐231 cells. B, Cytoskeleton rearrangement in si‐HSPC159/MDA231 and negative control cells was imaged by immunofluorescence assay. Cells were treated with 10 ng/mL epidermal growth factor (EGF). Figures show representative images from 3 repeated experiments. C, Western blot analysis of the phosphorylation of cofilin and LIMK in total cell lysates from MDA‐MB‐231 cells with EGF stimulation for 0, 15, 30 and 90 min. Total cofilin and LIMK was used as a loading control. *P < .05
LIM kinase 1 (LIMK1) and cofilin are 2 crucial factors involved in the regulation of actin cytoskeletal dynamics, and their phosphorylation mediates the regulation of chemoattractants that induce actin polymerization. To test the hypothesis that HSPC159 regulates EGF‐induced activation of LIMK1 and cofilin which, in turn, mediates actin polymerization, we assessed the evidence for LIMK1 and cofilin activation. As shown in Figure 5C, reduction of HSPC159 inhibited phosphorylation of LIMK1 and cofilin, consistent with the defects of actin polymerization in MDA‐MB‐231 cells. These results indicated that knockdown of HSPC159 led to a major cytoskeletal reorganization reduction by regulating the EGF‐induced phosphorylation of LIMK and cofilin in MDA‐MB‐231 cells.
3.8. HSPC159 enhanced proliferation, migration and invasion through activating the PI3K/Akt signaling pathway in breast cancer cells
To investigate the mechanisms underlying the roles of HSPC159, we examined the signal transduction pathways downstream of HSPC159. The PI3K/Akt signaling pathway plays an important role in breast cancer cell proliferation and invasion. We assessed whether HSPC159 regulated the activity of the PI3K/Akt signaling pathway, thereby mediating breast cancer cell proliferation and invasion. The results showed that si‐HSPC159 significantly reduced the levels of p‐Akt (Thr308 and Ser473) in MDA‐MB‐231 cells compared with the negative control group (Figure 6A). Consistently, overexpression of HSPC159 increased the levels of p‐Akt (Thr308 and Ser473) in MCF‐7 cells (Figure 6B).
Figure 6.
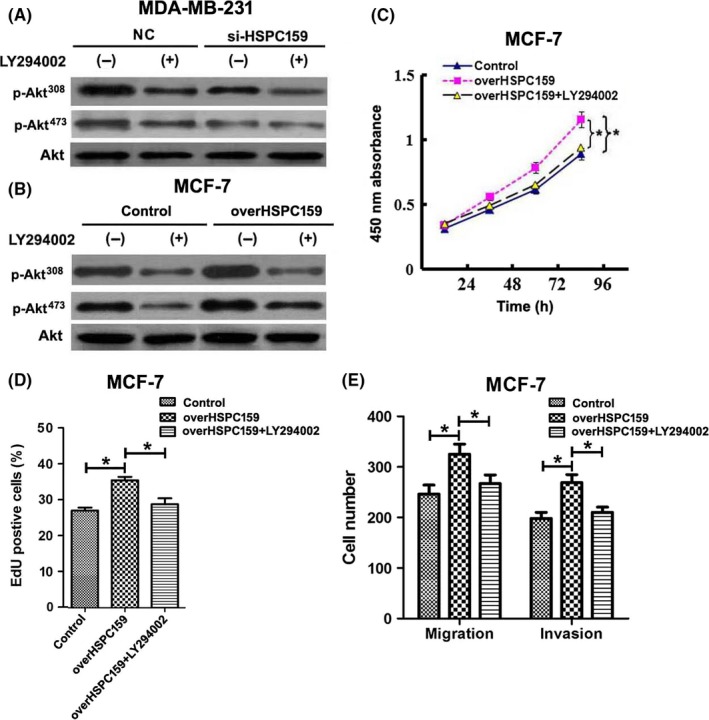
HSPC159 enhanced proliferation, migration and invasion through the PI3K/Akt pathway in breast cancer cells. A,B, Western blot analysis of the phosphorylation of Akt (Thr308 and Ser473) in total cell lysates from MDA‐MB‐231 and MCF‐7 cells. MDA‐MB‐231 and MCF‐7 cells were pretreated with PI3K inhibitors LY294002 for 1 h, and the expression level of Akt (Thr308 and Ser473) phosphorylation was detected by western blot. Akt was used as a loading control. C,D, Cell proliferation rates were measured using CCK‐8 (C) and EdU assays (D) after overexpression of HSPC159 with or without LY294002 treatment in MCF‐7 cells. E, Migration and invasion ability was measured by Transwell assays after upregulated expression of HSPC159 with or without LY294002 treatment in MCF‐7 cells. *P < .05
Furthermore, we cultured MDA‐MB‐231 and MCF‐7 cells with an exogenous specific PI3K inhibitor (LY294002). Our results showed that LY294002 significantly suppressed the phosphorylation of Akt (Thr308 and Ser473) compared with the control group (Figure 6A,B). These results showed that HSPC159 was involved in the PI3K/Akt pathway in breast cancer.
To explore the role of HSPC159 in regulating the proliferation, migration and invasion effect of breast cancer cells through PI3K/Akt, we transfected HSPC159 full‐length plasmid into MCF‐7 cell lines; the proliferation, migration and invasion ability was increased (Figure 6C‐E). Cells were then also treated with PI3K inhibitor LY294002, and cell proliferation, migration and invasion was inhibited (Figure 6C‐E). These results clearly demonstrated that HSPC159 promoted cell proliferation, migration, and invasion through PI3K/Akt signaling.
4. DISCUSSION
Breast cancer is a biologically heterogeneous disease involving various genetic and epigenetic events, and numerous molecular variables that contribute to the progression of breast cancer have been characterized. Herein, we report for the first time that HSPC159 functions as an oncogenic protein to promote proliferation, migration and metastasis of breast cancer. We found that HSPC159 was upregulated in breast cancer tissues compared with non‐tumorous tissues. Clinicopathological analysis suggested that increased HSPC159 expression was associated with large tumor size, positive lymph node metastasis (LNM), clinical stage and tumor differentiation. Furthermore, survival analysis showed that patients with high expression of HSPC159 showed a poorer overall survival and disease‐free survival than those who had low HSPC159 expression.
To date, investigations to explore functions of HSPC159 in human cancers are few and, to our knowledge, no previous studies have included a study of the clinical significance and molecular mechanisms of HSPC159 in cancer. Thus, in the present study, we investigated functional roles and underlying mechanisms of HSPC159 in breast cancer cells using both gain‐ and loss‐of‐function approaches. Our results indicated that downregulation of HSPC159 significantly inhibited proliferation, migration and invasion of breast cancer cells in vitro. However, overexpression of HSPC159 generated an opposite effect. For migration and invasion abilities, although HSPC159 regulates cell growth, the results of migration and invasion assays are independent of cell growth ability. Because the migration and invasion ability was detected before 48 hours after transfection, however, CCK‐8 assay indicated that there was no significant difference of proliferation rate between these transfected cells and negative control cells. Moreover, stable knockdown of HSPC159 in vivo reduced tumor growth and inhibited tumor metastasis to the lungs. These findings provide strong evidence that overexpression of HSPC159 plays an important role in promoting breast cancer progression and pathogenesis.
Epithelial‐mesenchymal transition is a process involved in the conversion of early‐stage tumors to invasive malignancies. EMT is an important event in tumor progression, as induction of EMT allows tumor cells to metastasize to a distant site as a result of enhanced cell motility and decreased intercellular adhesion.12, 13 The regulation of migration and invasion by HSPC159 described in this work suggests that HSPC159 may influence breast cancer progression by inducing the EMT process. Thus, in the present study, we analyzed the associations between HSPC159 expression and EMT. Western blot analysis showed that E‐cadherin was upregulated and the expression of N‐cadherin and vimentin was suppressed after HSPC159 knockdown. Consistently, HSPC159 overexpression increased N‐cadherin and vimentin and decreased E‐cadherin expression. Our results showed that HSPC159‐driven acquisition of migratory and invasive properties was followed by increase of N‐cadherin and vimentin and suppression of E‐cadherin, implying that HSPC159 promotes EMT in breast cancer cells. We also examined several EMT‐associated transcription factors to determine the mechanism of EMT; the results showed Snail and Twist were downregulated after HSPC159 knockdown and upregulated expression of HSPC159 exerted the opposite effect. These data demonstrate that HSPC159‐induced EMT is triggered by increased expression of Snail and Twist.
Actin polymerization and subsequent formation of membrane protrusions play an important role in cell migration.14, 15 This actin cytoskeleton remodeling is crucial for the motility and chemotaxis of cancer cells and consequently influences the metastatic ability of these cells.16 Our findings showed that HSPC159 took part in actin polymerization to regulate cytoskeletal rearrangement, which plays an important role in migration and invasion of breast cancer cells. LIMK and cofilin regulated chemoattractant‐induced actin polymerization that is crucial for motility.17, 18 Our studies also suggested that HSPC159 enhanced LIMK and cofilin phosphorylation, thus promoting actin polymerization. Taken together, our results suggest that HSPC159 acts upstream of LIMK/cofilin and mediates actin polymerization.
Furthermore, many studies have shown that the PI3K/Akt pathway plays an important role in malignant tumor progression, and that activation of Akt is associated with cell proliferation, survival, migration and invasion.19, 20 In order to explore the mechanism by which HSPC159 promotes growth and invasion in breast cancer cells, we measured the phosphorylation of Akt to investigate the activation of the PI3K/Akt pathway. Our study found that suppression of HSPC159 could reduce the phosphorylation of Akt(Thr308 and Ser473) in MDA‐MB‐231 cells. Meanwhile, overexpression of HSPC159 could induce the phosphorylation of Akt(Thr308 and Ser473) in MCF‐7 cells, whereas the expression of Akt was not changed. Inhibition of PI3K by LY294002 blocked the phosphorylation of Akt(Thr308 and Ser473). Moreover, treatment with the PI3K inhibitor LY294002 could inhibit the proliferation, migration and invasion ability of breast cancer cells after transfection of HSPC159 full‐length plasmid. These findings indicate that HSPC159 acts as an upstream regulator of the PI3K/Akt pathway and that HSPC159 promotes breast cancer cell proliferation and invasion by activating the PI3K/AKT pathway.
In summary, we showed that HSPC159 overexpression in breast cancer caused high malignancy features of the tumor and affected the clinical outcomes of the patients. Our results showed that knockdown of HSPC159 expression significantly inhibited cancer cell proliferation, migration and metastasis through reduction of EMT and through the PI3K/Akt pathway. HSPC159 can be expected to be a potential therapeutic target for breast cancer.
CONFLICTS OF INTEREST
Authors declare no conflicts of interest for this article.
ACKNOWLEDGMENTS
This work was supported by the Natural Scientific Foundation of Shandong Province (ZR2015HL091, ZR2015HL064, ZR2016HL20, ZR2014HM086), the Natural Scientific Foundation of China (81472365), the Shandong Province Medicine and Health Science Technology Program (2013WS0279).
Zheng J, Zhang M, Zhang L, Ding X, Li W, Lu S. HSPC159 promotes proliferation and metastasis by inducing epithelial‐mesenchymal transition and activating the PI3K/Akt pathway in breast cancer. Cancer Sci. 2018;109:2153‐2163. https://doi.org/10.1111/cas.13631
Contributor Information
Jie Zheng, Email: zj1978824@163.com.
Shijun Lu, Email: shijunlu2016@sina.com.
REFERENCES
- 1. Torre LA, Bray F, Siegel RL, et al. Global cancer statistics, 2012. CA Cancer J Clin. 2015;65:87‐108. [DOI] [PubMed] [Google Scholar]
- 2. Liu FT, Rabinovich GA. Galectins as modulators of tumour progression. Nat Rev Cancer. 2005;5:29‐41. [DOI] [PubMed] [Google Scholar]
- 3. Wu MH, Hong TM, Cheng HW, et al. Galectin‐1‐mediated tumor invasion and metastasis, up‐regulated matrix metalloproteinase expression, and reorganized actin cytoskeletons. Mol Cancer Res. 2009;7:311‐318. [DOI] [PubMed] [Google Scholar]
- 4. Chen C, Duckworth CA, Fu B, Pritchard DM, Rhodes JM, Yu LG. Circulating galectins ‐2, ‐4 and ‐8 in cancer patients make important contributions to the increased circulation of several cytokines and chemokines that promote angiogenesis and metastasis. Br J Cancer. 2014;110:741‐752. [DOI] [PMC free article] [PubMed] [Google Scholar]
- 5. Zhang QH, Ye M, Wu XY, et al. Cloning and functional analysis of cDNAs with open reading frames for 300 previously undefined genes expressed in CD34+ hematopoietic stem/progenitor cells. Genome Res. 2000;10:1546‐1560. [DOI] [PMC free article] [PubMed] [Google Scholar]
- 6. Zhou D, Ge H, Sun J, Gao Y, Teng M, Niu L. Crystal structure of the C‐terminal conserved domain of human GRP, a galectin‐related protein, reveals a function mode different from those of galectins. Proteins. 2008;71:1582‐1588. [DOI] [PubMed] [Google Scholar]
- 7. Wälti MA, Thore S, Aebi M, Künzler M. Crystal structure of the putative carbohydrate recognition domain of human galectin‐related protein. Proteins. 2008;72:804‐808. [DOI] [PubMed] [Google Scholar]
- 8. Mencia N, Selga E, Noé V, Ciudad CJ. Underexpression of miR‐224 in methotrexate resistant human colon cancer cells. Biochem Pharmacol. 2011;82:1572‐1582. [DOI] [PubMed] [Google Scholar]
- 9. Koch M, Wiese M. Gene expression signatures of angiocidin and darapladib treatment connect to therapy options in cervical cancer. J Cancer Res Clin Oncol. 2013;139:259‐267. [DOI] [PubMed] [Google Scholar]
- 10. Zhang J, Jia J, Zhao L, et al. Down‐regulation of microRNA‐9 leads to activation of IL‐6/Jak/STAT3 pathway through directly targeting IL‐6 in HeLa cell. Mol Carcinog. 2016;55:732‐742. [DOI] [PMC free article] [PubMed] [Google Scholar]
- 11. Zheng J, Liu Y, Qiao Y, Zhang L, Lu S. miR‐103 promotes proliferation and metastasis by targeting KLF4 in gastric cancer. Int J Mol Sci. 2017;18:910. [DOI] [PMC free article] [PubMed] [Google Scholar]
- 12. Wang Y, Wen M, Kwon Y, et al. CUL4A induces epithelial‐mesenchymal transition and promotes cancer metastasis by regulating ZEB1 expression. Cancer Res. 2014;74:520‐531. [DOI] [PMC free article] [PubMed] [Google Scholar]
- 13. Lee J, Hahm ER, Marcus AI, Singh SV. Withaferin A inhibits experimental epithelial‐mesenchymal transition in MCF‐10A cells and suppresses vimentin protein level in vivo in breast tumors. Mol Carcinog. 2015;54:417‐429. [DOI] [PMC free article] [PubMed] [Google Scholar]
- 14. Mouneimne G, Hansen SD, Selfors LM, et al. Differential remodeling of actin cytoskeleton architecture by profilin isoforms leads to distinct effects on cell migration and invasion. Cancer Cell. 2012;22:615‐630. [DOI] [PMC free article] [PubMed] [Google Scholar]
- 15. Wang LH, Xiang J, Yan M, et al. The mitotic kinase Aurora‐A induces mammary cell migration and breast cancer metastasis by activating the Cofilin‐F‐actin pathway. Cancer Res. 2010;70:9118‐9128. [DOI] [PubMed] [Google Scholar]
- 16. Bhattacharya S, Ahir M, Patra P, et al. PEGylated‐thymoquinone‐nanoparticle mediated retardation of breast cancer cell migration by deregulation of cytoskeletal actin polymerization through miR‐34a. Biomaterials. 2015;51:91‐107. [DOI] [PubMed] [Google Scholar]
- 17. Pollard TD, Borisy GG. Cellular motility driven by assembly and disassembly of actin filaments. Cell. 2003;112:453‐465. [DOI] [PubMed] [Google Scholar]
- 18. Song X, Chen X, Yamaguchi H, et al. Initiation of cofilin activity in response to EGF is uncoupled from cofilin phosphorylation and dephosphorylation in carcinoma cells. J Cell Sci. 2006;119:2871‐2881. [DOI] [PubMed] [Google Scholar]
- 19. Yang SX, Polley E, Lipkowitz S. New insights on PI3K/AKT pathway alterations and clinical outcomes in breast cancer. Cancer Treat Rev. 2016;45:87‐96. [DOI] [PMC free article] [PubMed] [Google Scholar]
- 20. Rabi T, Huwiler A, Zangemeister‐Wittke U. AMR‐Me inhibits PI3K/Akt signaling in hormone‐dependent MCF‐7 breast cancer cells and inactivates NF‐kappaB in hormone‐independent MDA‐MB‐231 cells. Mol Carcinog. 2014;53:578‐588. [DOI] [PubMed] [Google Scholar]


