Abstract
Paramagnetic relaxation enhancement (PRE) measurements constitute a powerful approach for detecting both permanent and transient protein-protein interactions. Typical PRE experiments require an intrinsic or engineered paramagnetic site on one of the two interacting partners; while a second, diamagnetic binding partner is labeled with stable isotopes (15N or 13C). Multiple paramagnetic labeled centers or reversed labeling schemes are often necessary to obtain sufficient distance restraints to model protein-protein complexes, making this approach time consuming and expensive. Here, we show a new strategy that combines a modified pulse sequence (1HN-Γ2-CCLS) with an asymmetric labeling scheme to enable the detection of both intra- and inter-molecular PREs simultaneously using only one sample preparation. We applied this strategy to the non-covalent dimer of ubiquitin. Our method confirmed the previously identified binding interface for the transient di-ubiquitin complex, and at the same time, unveiled the internal structural dynamics rearrangements of ubiquitin upon interaction. In addition to reducing the cost of sample preparation and speed up PRE measurements, by detecting the intra-molecular PRE this new strategy will make it possible to measure and calibrate inter-molecular distances more accurately for both symmetric and asymmetric protein-protein complexes.
Keywords: Paramagnetic Relaxation Enhancement, Protein-Protein Interactions, Intra- and Inter-molecular PRE
INTRODUCTION
Protein-protein interactions are involved in a myriad of processes that are essential to cellular function. Based on the strength and persistance of interactions, protein-protein complexes are categorized as permanent or transient 1,2. Permanent complexes occur between proteins with high binding affinities (nM to sub-μM range). If their size is within the feasibility range of solution NMR spectroscopy, these complexes can be fully characterized using several NMR observables such as chemical shift perturbations, residual dipolar couplings, and more importantly, nuclear overhauser effects (NOEs) 3. The detection of intermolecular NOEs, however, can be rather challenging for transient or ‘fuzzy’ complexes, with low binding affinities 4. In this case, long-range distances can be estimated by measuring paramagnetic relaxation enhancement (PRE) between the nuclear spins of one binding partner and a paramagnetic center intrinsic or engineered on a second binding partner 5,6. The paramagnetic center increases the relaxation rates of the nuclear magnetization, with an effect that is proportional to the average distance between the unpaired electron and the nucleus of interest, 〈r−6〉 7–9. Due to the large magnetic moment of unpaired electrons, PRE affects nuclei up to 35 Å, making it a powerful tool for structure determination 7.
The application of PREs to the study of macromolecular structures and dynamics became widespread with the introduction of extrinsic paramagnetic centers that are conjugated to specific, solvent exposed sites of protein targets 10, or metal-binding proteins with intrinsic or engineered paramagnetic centers 11,12. The most commonly used spin labels are covalently attached to naturally occurring or engineered cysteine residues such as S-(1-oxyl-2,2,5,5-tetramethyl-2,5-dihydro-1H-pyrrol-3-yl)methyl methanesulfonothioate (MTSL) or Ethylenediaminetetraacetic acid chelated with Mn2+ (EDTA-Mn2+), which in the majority of cases are characterized by an isotropic g-tensor 7. Also, soluble paramagnetic ions (chelated or free) can be dissolved in solution, generating PRE effects from their random collisions with macromolecules or macromolecular complexes 12–14. These approaches have been instrumental to determine the conformational space of transient biomacromolecular complexes such as protein-protein and protein-DNA complexes as well as interactions between intrinsically disordered domains and globular binding partners 12,15–17.
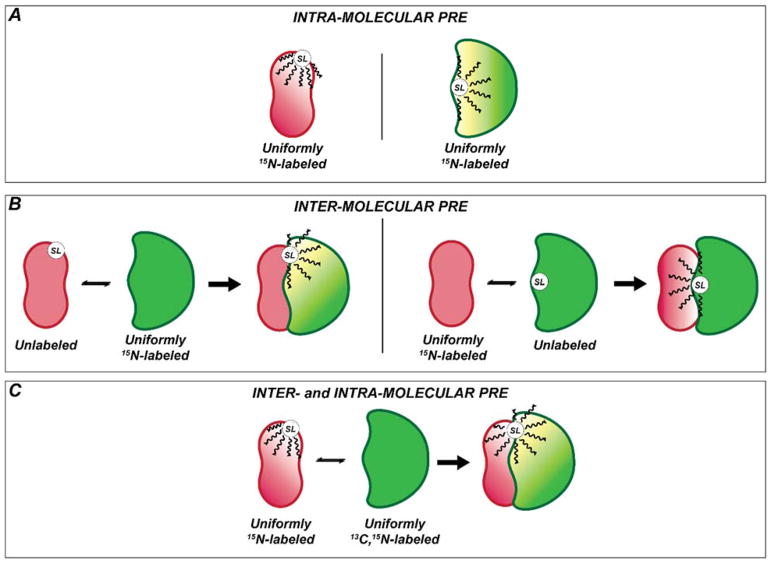
In a standard intermolecular PRE experiment that involves two interacting proteins (A and B), the effects of a paramagnetic center are detected for only one of the binding partners in each independent NMR experiment (Figure 1A–B). Often, several positions of the spin label or reversed labeling schemes are needed to generate non-redundant, unambiguos distances for molecular modeling using software packages such as HADDOCK 18,19 or XPLOR-NIH 20,21 (Figure 1B). Therefore, probing accurately the interactions between two proteins can be time consuming and expensive.
Figure 1. Schematic of the NMR approach to study protein-protein interactions using PRE distance restraints.
(A) Schematization of the standard experiment for the detection of intra-molecular PRE. (B) Classical approach to monitor PRE for protein complexes. In this case two different sample are used. The first sample is prepared with asymmetric labeling using the first binding partner spin labeled and NMR silent and the second NMR active (e.g., 15N or 13C labeled) (left panel). In the second sample the labeling scheme is reversed (right panel). (C) Simultaneous detection of inter- and intra-molecular PRE using 1HN-Γ2 CCLS experiment. One species is uniformly 15N label while the other should be double labeled (e.g., 15N or 13C labeled). SL: Spin Label.
In this paper, we propose a simple strategy that combines an asymmetric labeling scheme with a modified version of the 1HN-Γ2 pulse sequence for detecting both intra- and inter-molecular PRE rates for two binding partners simultaneously (Figure 1C). The labeling strategy consists of labeling one of the two binding partners with U-15N and MTSL (A) and the second with U-13C, 15N (B) (Figure 1C). The modified 1HN-Γ2 pulse sequence 8 includes a carbonyl carbon label selective (CCLS) editing scheme, which separates the amide fingerprint spectrum of the U-15N labeled protein from the U-13C,15N binding partner 22.
As a benchmark, we chose the non-covalent, transient dimer of ubiquitin. Specifically, we studied a complex formed between wild-type ubiquitin (UbiWT) and the K48C ubiquitin mutant (UbiK48C), a system extensively analyzed by solution NMR with PRE measurements 23. Using our new strategy, we were able to characterize both intra- and inter-molecular interactions in the di-ubiquitin complex, detecting the structural and dynamics changes intrinsic to ubiquitin upon dimerization and eliminating the need of multiple samples.
MATERIALS AND METHODS
Sample preparation
Uniformly labeled U-13C,15N UbiWT was expressed using E. coli BL21(DE3) cells in M9 minimal media and purified as previously described 24. Briefly, an overnight culture of E. coli bacteria, transformed with ubiquitin plasmid, was used to inoculate 250 mL of M9 medium with 15NH4Cl salt as the only source of nitrogen. Ubiquitin overexpression was induced using 1 mM IPTG and carried out at 37 °C for 5 h. The cell pellet was suspended in 50 mM sodium acetate buffer at pH 5.0 and lysated by sonication. Subsequently, the lysate was centrifuged at 20,000 rpm at 4 °C and the supernatant loaded onto a P11 cationic exchange column and eluted with a gradient of 0–1 M NaCl. An additional size exclusion purification step was performed with a Sephacryl S-100 resin (GE®) using 100 mM phosphate buffer at pH 7.0 as a mobile phase. The purified protein was concentrated, lyophilized, and stored under vacuum at room temperature. For NMR sample preparation, 0.80 mg of U-13C,15N UbiWT was solubilized in 10 mM sodium acetate buffer (pH 6.0) and 100 mM NaN3 with a final concentration of 300 μM. The UbiK48C mutant was engineered on the original plasmid using a QuickChange® kit from Stratagene. The mutant was expressed in M9 medium containing 15NH4Cl salt, and purified as described for UbiWT. The purity of the samples was assayed using sodium dodecyl sulfate-polyacrylamide gel electrophoresis (SDS-PAGE) (Figure S4A). In all the purification steps of UbiK48C, 1,4-Dithiothreitol (DTT) was utilized and removed right before lyophilization using a HiTrap Desalting column (GE®). For the NMR sample 0.80 mg of UbiK48C powder was solubilized in 10 mM Na2HPO4, 0.1 mM EDTA and 1 mM NaN3 at pH 7.5 to a final concentration of 1.5 mM. The protein solution was then divided into two equal aliquots for labeling using MTSL (1-oxyl-2,2,5,5-tetramethyl-δ-3-pyrroline-3-methyl)methanethiosulfonate (Toronto Research Chemicals, Inc.) and the diamagnetic analog dMTSL (1-acetyl-2,2,5,5-tetramethyl-δ-3-pyrroline-3-methyl)methanethiosulfonate (Toronto Research Chemicals, Inc.). The labeling reactions were performed at 4°C overnight with 10-fold excess of labeling compounds. Afterward, the samples were purified with HiTrap Desalting column (GE) to eliminate the excess of labeling compounds. The extent of labeling was assessed by ESI TOF mass spectrometry (Mass Spectrometry Laboratory, Department of Chemistry, University of Minnesota), and was found to be >99% (Figure S4B).
Two Ubi complex samples were used to test the new pulse sequence. The first sample consisted of an equimolar mixture of U-13C,15N UbiWT and MTSL-labeled-15N UbiK48C (paramagnetic sample) to a total concentration of 300 μM; while the second contained an equimolar mixture of U-13C,15N UbiWT and dMTSL-15N UbiK48C (diamagnetic sample) (Figure S3A). To compare the values of 1HN-Γ2 obtained with the classical pulse sequence and the new CCLS version, a 1 mM sample of U-13C,15N UbiWT was also prepared (Figure S2A).
NMR spectroscopy
The NMR experiments were recorded at 303 K on a Bruker Avance II 700 MHz spectrometer equipped with a triple-resonance z-gradient cryo-probe and on a Bruker Avance NEO 600 MHz spectrometer, equipped with a 5-mm triple resonance cryoprobe. All the experiments were performed using 64 scans with 2048 (1H dimension) and 128 (15N dimension) complex points, with a relaxation delay of 2 s. 1HN PRE-Γ2 relaxation rates were recorded using the new 1HN-Γ2-CCLS pulse sequence (Figure 2A). The experiments were performed in an interleaved manner using a relaxation duration of 4 (Taτa) and 14 (Tbτb) ms. The 1HN-Γ2 relaxation rates were calculated as reported by Iwahara 8 using the following equation:
| (1) |
where Γ2 is the PRE relaxation rate, the time points are τTa and Tbτβ, Ipara is the peak intensity recorded for the paramagnetic sample and Idia is the corresponding peak intensity for the diamagnetic sample. Experimental errors of Γ2 were calculated using the following equation:
| (2) |
where σdia and σpara are the root mean square of the noise in the respective spectra 8. Before and after recording the paramagnetic and diamagnetic PRE relaxation rates, 2D-CCLS HSQC spectra were acquired to estimate the quality and stability of the samples. The validation of the new pulse sequence was performed by comparing R2 relaxation rates using the original and the CCLS modified version of the 1HN-Γ2 experiment8. All the experiments were performed at 298 K using 8 scans with 2048 direct points and 128 indirect points. The decay curves were obtained using nine relaxation delays (4, 8, 12, 14, 18, 22, 28, 34, 40 ms).
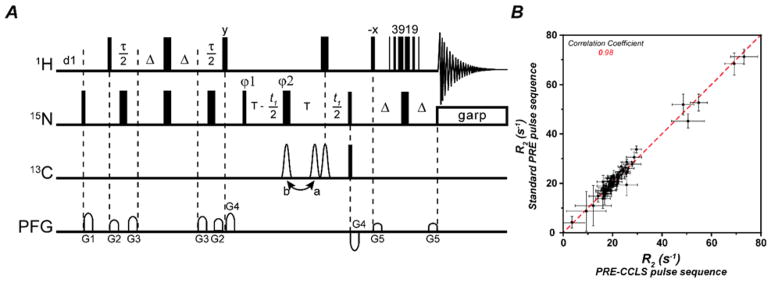
Figure 2. The1HN-Γ2 CCLS pulse sequence for PRE Γ2 measurements.
(A). The narrow and wide bars represent 90° and 180° hard pulses, respectively. The three 13C 180° shaped pulses are 256 μs long Q3 pulse35, the first two and the last one shaped pulses are applied to 13C′ and 13CA, respectively. The 13C′ 180° shaped pulse may be at either position a or b. When it is at position a, the 1JNC′ is decoupled and reference spectra are acquired. When it is at position b, the 1JNC′ is present and 13C′-suppressed spectra are acquired. The flipping angles and phases of the pulses in 3919 are 20.8°x, 62.2°x, 131.6°x, 131.6°-x, 62.2°-x, and 20.8°-x, respectively, and the interval between pulses is 188 μs (= 1/d, d is the distance in Hz between center and next null). T = 16.5 ms, Δ = 2.6 ms. G1=(1 ms, 25.0 G/cm), G2=(0.3 ms, 5.0 G/cm), G3=(0.3 ms, 8.0 G/cm), G4=(1 ms, 15.0 G/cm), G5=(1 ms, 10.0 G/cm). Phase cycling scheme is φ1= (x, -x), φ2=(x, x, -x, -x), φ3=4(x), 4(-x), φrec=(x, -x, x, -x, -x, x, -x, x). The quadrature detections in t1 dimension are acquired via States-TPPI of φ1. Constant time mode is used to measure Γ2, that is Γ2 = ln(S1/S2)/(τ2−τ1), where S1 and S2 are signal intensities of a peak measured with τ = τ1 and τ = τ2, respectively. 2×2 spectra are acquired in an interleave mode via changing relaxation delay τ (minimum 2 ms) and changing the 13C′ 180° shaped pulse from position a to b, respectively. (B) Agreement between R2 values determined using a standard pulse sequence (y-axis) and the 1HN-Γ2 PRE-CCLS pulse sequence (x-axis) with a correlation coefficient equal to 0.98.
RESULTS AND DISCUSSION
The spectroscopic characterization of the non-covalent di-ubiquitin complex is rather challenging as this transient complex gives rise to only one set of resonances in the amide fingerprints for the two species. For our experiments, we produced a sample containing an equimolar mixture of UbiWT and UbiK48C mutant to a final concentration of 0.6 mM. Under these experimental conditions, the estimated population of the Ubi dimer is approximately 6% 23. We expressed the first binding partner, UbiWT, uniformly labeled with 13C and 15N labeled, while we expressed the second binding partner, UbiK48C, uniformly labeled with 15N. We then cross-linked U-15N-UbiK48C with MTSL to measure the PREs with UbiWT. For the control experiment, we cross-linked U-15N-UbiK48C with dMTSL. To estimate the amide relaxation rates (1HN-Γ2), we calculated the difference between the paramagnetic (R2,para) and diamagnetic (R2,dia) relaxation rates (Γ2 = R2,para - R2,dia) 7. To edit the fingerprint spectrum of each binding partner individually, we implemented a CCLS element into the 1HN-Γ2 pulse scheme 8. The CCLS element was previously introduced to separate the chemical shifts perturbations of the fingerprint of two binding partners and measure residual dipolar couplings between two or three binding partners simultaneously 22,25,26.
The new pulse scheme reported in Figure 2A includes a constant time (CT) evolution period for the 15N magnetization together with the CCLS element for editing the 13C-linked resonances 22. During the CT evolution period, the J coupling between 15N and 13C′ (1JNC′ ~ −15 Hz) is active or refocused using a 180° shaped pulse (Q3) on the carbonyl resonances at positions b or a, respectively; whereas the J coupling between 15N and 13Cα (1JNCα ~ −11 Hz) is refocused in both schemes using a third 180° shaped pulse on the 13C channel. To edit the amide fingerprint of each binding partner individually, we carry out two separate experiments. In the first experiment, we register a reference spectrum detecting the 1H-15N amide fingerprints for both binding partners; while in a second experiment we acquire a suppression spectrum, editing out the amide resonances of the U-13C labeled binding partner. Reference and suppression spectra are acquired in an interleaved manner (Figure S1). Specifically, the reference spectrum is recorded with the 13C′ 180° shaped pulse applied at position a (Figure 2) so that both fingerprints, with and without 13C′-labeling, are observed. The suppression spectrum is acquired with the 13C′ 180° shaped pulse at position b. The latter causes the 15N–13C′ J coupling to be active during the CT period, converting the two spin-order operators 2HzNx and 2HzNy for the 15N spins linked to 13C′ into three spin-order operators, 4HzNyC′z and 4HzNxC′z, where H, N and C′ are the corresponding spin operators for 1HN, 15N and 13C′. After a 90° hard pulse on 13C′, the C′z is converted into C′y for these two terms and dephased by a G4 gradient, which edits out the signals arising from amide groups linked to 13C′. The magnetization originating from the 12C′-linked amide groups of the second binding partner (without 13C-labeling) remains unaffected. The suppression spectrum is then subtracted from the reference giving rise to the fingerprint of the U-15N,13C labeled binding partner alone (Figure S1). It should be noted that this subtraction reduces the sensitivity of subtracted spectrum by a factor of √2 22. To measure the transverse relaxation of amides protons, it is sufficient to increment the two delay periods. In the pulse sequence, the two T values must be greater than 2 ms, i.e., longer than the sum of the G2 and G3 pulse gradients and their recovery delays (0.2 ms).
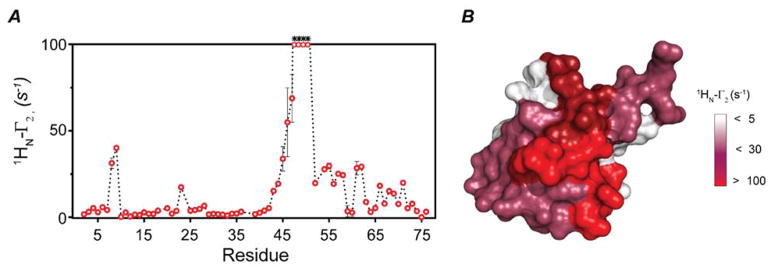
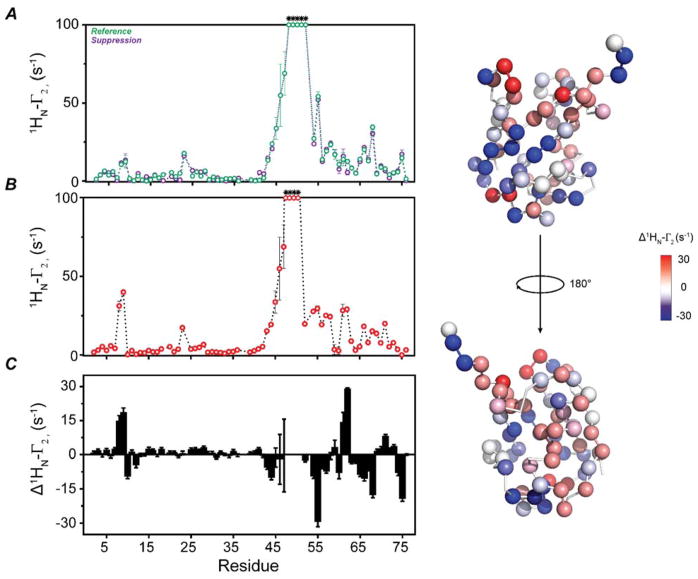
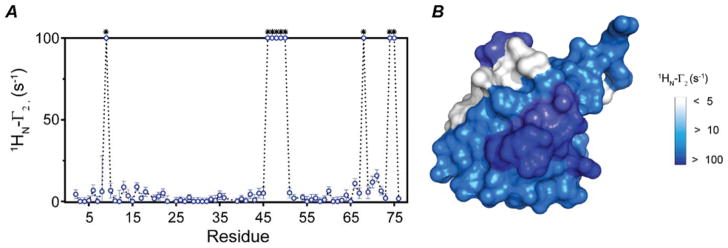
To test the performance of our new pulse sequence (Figure 2A), we first compared the transverse relaxation values obtained using the standard 1HN-Γ2 sequence 8 with those obtained with the new 1HN-Γ 2-CCLS experiment. As shown in Figure 2B, we observed a quantitative agreement between the transverse relaxation values obtained using these two experiments with at least a correlation coefficient of 0.98. We then proceeded to carried out the experiments on the U-13C,15N UbiWT and U-15N UbiK48C-MTSL complex. To estimate the PRE values, we recorded the two spectra with ΔT = 10 ms (4 and 14 ms). Figures S1 shows the spectra of the free ubiquitin and the corresponding non-covalent complexes used to estimate the 1HN-Γ2 rates. Figure 3 displays the intra-molecular PRE effects measured for the U-15N UbiK48C-MTSL in the presence of UbiWT. The plot of the 1HN-Γ2 rates versus residues shows the expected profiles, with the highest PRE effects centered at the labeling site (C48) and a gradual decrease of the relaxation effects as a function of the distance. PRE effects are also present for residues located at the C-terminal region of UbiK48C-MTSL as well as the N-terminal residues 8 and 9. We repeated these measurements for UbiK48C-MTSL in the absence of UbiWT (Figure 4). By comparing Figures 3 and 4, we found significant differences in the 1HN-Γ2 rates for the C-terminal residues (51–75) and N-terminal residues 8 and 9. These regions (the β1-β2 loop, residues 5–13, the β3-α2 loop, and the C-terminus) are extremely important for recognition of ubiquitin binding partners and display conformational dynamics in the low microsecond time scale 27. The intra-molecular PRE differences between the free and bound ubiquitin may be indicative of conformational or dynamic changes occurring upon non-covalent dimerization. Figure 5 displays the inter-molecular Γ2 rates measured on the UbiWT spectrum. These values are remarkably similar to those obtained for both non-covalent and covalent dimers previously reported 23,28. The slight differences in the extent of the Γ2 values are most likely due to the lower population of the dimer present in our sample. In fact, Liu et al. utilized an equimolar ratio of UbiWT and UbiK48C of 0.5 μM each for a total concentration of 1 mM 23. In contrast, we utilized a significantly lower total concentration of protein to avoid undesired non-specific binding effects. However, the protein surface plots as identified by the intra- and inter-molecular PRE (Figures 3B and 5B) show a similar dimerization interface as reported by Tang and co-workers 23,28.
Figure 3. Intramolecular PRE measurements of UbiK48C obtained with the 1HN-Γ2-CCLS experiment.
(A) 1HN-γ2 rate plot calculated for K48C mutant conjugate with MTSL in presence of UbiWT. (B) Surface plot of UbiK48C (PDB code 1UBQ) showing the residues that are affected by MTSL. Residues that are completely broadened out are indicated with asterisks.
Figure 4. Intra-molecular PRE measurements on UbiK48C-MTSL.
(A) 1HN-γ2 rate plot calculated for UbiK48C-MTSL alone using the new pulse sequence. (B) 1HN-γ2 rate plot calculated for UbiK48C-MTSL in presence of WT ubiquitin (same of figure 3). (C) Plot of the difference between the 1HN-γ2 rates of UbiK48C-MTSL in complex with WT and alone. (D) Mapping the difference in 1HN-γ2 rates on UbiK48C-MTSL structure (PDB code 1UBQ).
Figure 5. Inter-molecular PRE measurements between UbiK48C-MTSL and UbiWT.
(A) 1HN-γ2 rate plot calculated for WT ubiquitin in presence of UbiK48C-MTSL. B) Surface plot of the PRE effects on the UbiWT (PDB code 1UBQ). Asterisks denote residues completely broadened.
PRE measurements are emerging as a necessary tool to complement the short-range NOE distances with long-range distances that are crucial to model protein-protein or protein-DNA complexes accurately 7. However, to obtain non-redundant distances from both binding partners, it is often necessary to produce multiple samples that would improve the precision and accuracy of the modeled complexes and enable a better convergence in the structure calculations 29. The implementation of PRE-derived distances into structure refinement protocols present several hurdles due to ambiguities in the estimation of inter-molecular PRE effects as well as the dynamics of the spin labels. Often, NMR spectroscopy relies on the use of multiple spin labels at different positions and wide ranges for upper and lower bounds for distance restraints in the structure determination protocols 4,30. Clore and co-workers proposed a more accurate approach based on ensemble structure calculations using an harmonic function minimized against the Γ2 relaxation values directly 31,32. This method is necessary in the presence of substantial molecular motions and intrinsically disordered domains or proteins 15,33,34. The strategy presented here has the advantage to calibrate inter-molecular distances using the intra-molecular distances as a ruler and has the potential to improve the accuracy and quality of the structures obtained using the ensemble structure calculations.
CONCLUSIONS
In conclusion, we presented a new strategy to measure both intra- and inter-molecular PRE effects on backbone amides in two binding partners simultaneously. The methods utilizes a combination of an asymmetric labeling scheme for binding partners and a CCLS modified version of the 1HN-Γ2 experiment to edit each of the amide fingerprints of the binding partners independently. In addition to reducing the number of samples required for measuring intermolecular PREs, this strategy enables the the identification of structural changes occurring in both binding partners upon formation of transient and permanent interactions.
Acknowledgments
This research was supported by the National Institute of Health (GM 100310 and 1S10OD021536 to G.V.). We authors would like to thank Dr. G. Li for helping in the initial setting of the experiments. The experiments were carried out at the Minnesota NMR Center.
References
- 1.Nooren IM, Thornton JM. Diversity of protein-protein interactions. EMBO J. 2003;22:3486–92. doi: 10.1093/emboj/cdg359. [DOI] [PMC free article] [PubMed] [Google Scholar]
- 2.Nooren IM, Thornton JM. Structural characterisation and functional significance of transient protein-protein interactions. J Mol Biol. 2003;325:991–1018. doi: 10.1016/s0022-2836(02)01281-0. [DOI] [PubMed] [Google Scholar]
- 3.Zuiderweg ER. Mapping protein-protein interactions in solution by NMR spectroscopy. Biochemistry. 2002;41:1–7. doi: 10.1021/bi011870b. [DOI] [PubMed] [Google Scholar]
- 4.Walters KJ, et al. Characterizing protein-protein complexes and oligomers by nuclear magnetic resonance spectroscopy. Methods Enzymol. 2001;339:238–58. doi: 10.1016/s0076-6879(01)39316-3. [DOI] [PubMed] [Google Scholar]
- 5.Solomon I. Relaxation Processes in a System of Two Spins. Physical Review. 1955;99:559–565. [Google Scholar]
- 6.Bloembergen N, Morgan LO. Proton Relaxation Times in Paramagnetic Solutions. Effects of Electron Spin Relaxation. The Journal of Chemical Physics. 1961;34:842–850. [Google Scholar]
- 7.Clore GM, Iwahara J. Theory, practice, and applications of paramagnetic relaxation enhancement for the characterization of transient low-population states of biological macromolecules and their complexes. Chem Rev. 2009;109:4108–39. doi: 10.1021/cr900033p. [DOI] [PMC free article] [PubMed] [Google Scholar]
- 8.Iwahara J, Tang C, Clore GM. Practical Aspects of (1)H Transverse Paramagnetic Relaxation Enhancement Measurements on Macromolecules. Journal of magnetic resonance (San Diego, Calif: 1997) 2007;184:185–195. doi: 10.1016/j.jmr.2006.10.003. [DOI] [PMC free article] [PubMed] [Google Scholar]
- 9.Clore GM. Visualizing lowly-populated regions of the free energy landscape of macromolecular complexes by paramagnetic relaxation enhancement. Molecular bioSystems. 2008;4:1058–1069. doi: 10.1039/b810232e. [DOI] [PMC free article] [PubMed] [Google Scholar]
- 10.Kosen PA. Spin labeling of proteins. Methods Enzymol. 1989;177:86–121. doi: 10.1016/0076-6879(89)77007-5. [DOI] [PubMed] [Google Scholar]
- 11.Bertini I, et al. Paramagnetism-based versus classical constraints: an analysis of the solution structure of Ca Ln calbindin D9k. J Biomol NMR. 2001;21:85–98. doi: 10.1023/a:1012422402545. [DOI] [PubMed] [Google Scholar]
- 12.Bertini I, Luchinat C, Piccioli M. Paramagnetic probes in metalloproteins. Methods Enzymol. 2001;339:314–40. doi: 10.1016/s0076-6879(01)39320-5. [DOI] [PubMed] [Google Scholar]
- 13.Bernini A, Venditti V, Spiga O, Niccolai N. Probing protein surface accessibility with solvent and paramagnetic molecules. Progress in Nuclear Magnetic Resonance Spectroscopy. 2009;54:278–289. [Google Scholar]
- 14.Venditti V, Fawzi NL. Probing the Atomic Structure of Transient Protein Contacts by Paramagnetic Relaxation Enhancement Solution NMR. In: Ghose R, editor. Protein NMR: Methods and Protocols. Springer; New York, New York, NY: 2018. pp. 243–255. [DOI] [PMC free article] [PubMed] [Google Scholar]
- 15.Clore GM, Tang C, Iwahara J. Elucidating transient macromolecular interactions using paramagnetic relaxation enhancement. Current Opinion in Structural Biology. 2007;17:603–616. doi: 10.1016/j.sbi.2007.08.013. [DOI] [PMC free article] [PubMed] [Google Scholar]
- 16.Brutscher B, et al. NMR Methods for the Study of Instrinsically Disordered Proteins Structure, Dynamics, and Interactions: General Overview and Practical Guidelines. Adv Exp Med Biol. 2015;870:49–122. doi: 10.1007/978-3-319-20164-1_3. [DOI] [PubMed] [Google Scholar]
- 17.Salmon L, et al. NMR characterization of long-range order in intrinsically disordered proteins. J Am Chem Soc. 2010;132:8407–18. doi: 10.1021/ja101645g. [DOI] [PubMed] [Google Scholar]
- 18.Dominguez C, Boelens R, Bonvin AM. HADDOCK: a protein-protein docking approach based on biochemical or biophysical information. J Am Chem Soc. 2003;125:1731–7. doi: 10.1021/ja026939x. [DOI] [PubMed] [Google Scholar]
- 19.van Zundert GC, Melquiond AS, Bonvin AM. Integrative Modeling of Biomolecular Complexes: HADDOCKing with Cryo-Electron Microscopy Data. Structure. 2015;23:949–60. doi: 10.1016/j.str.2015.03.014. [DOI] [PubMed] [Google Scholar]
- 20.Banci L, et al. Paramagnetism-based restraints for Xplor-NIH. J Biomol NMR. 2004;28:249–61. doi: 10.1023/B:JNMR.0000013703.30623.f7. [DOI] [PubMed] [Google Scholar]
- 21.Schwieters CD, Kuszewski JJ, Tjandra N, Clore GM. The Xplor-NIH NMR molecular structure determination package. J Magn Reson. 2003;160:65–73. doi: 10.1016/s1090-7807(02)00014-9. [DOI] [PubMed] [Google Scholar]
- 22.Tonelli M, Masterson LR, Hallenga K, Veglia G, Markley JL. Carbonyl carbon label selective (CCLS) 1H-15N HSQC experiment for improved detection of backbone 13C-15N cross peaks in larger proteins. J Biomol NMR. 2007;39:177–85. doi: 10.1007/s10858-007-9185-3. [DOI] [PMC free article] [PubMed] [Google Scholar]
- 23.Liu Z, et al. Noncovalent dimerization of ubiquitin. Angew Chem Int Ed Engl. 2012;51:469–72. doi: 10.1002/anie.201106190. [DOI] [PMC free article] [PubMed] [Google Scholar]
- 24.Chao FA, Shi L, Masterson LR, Veglia G. FLAMEnGO: a fuzzy logic approach for methyl group assignment using NOESY and paramagnetic relaxation enhancement data. J Magn Reson. 2012;214:103–10. doi: 10.1016/j.jmr.2011.10.008. [DOI] [PMC free article] [PubMed] [Google Scholar]
- 25.Masterson LR, Tonelli M, Markley JL, Veglia G. Simultaneous detection and deconvolution of congested NMR spectra containing three isotopically labeled species. J Am Chem Soc. 2008;130:7818–9. doi: 10.1021/ja802701w. [DOI] [PMC free article] [PubMed] [Google Scholar]
- 26.Tonelli M, Masterson LR, Cornilescu G, Markley JL, Veglia G. One-sample approach to determine the relative orientations of proteins in ternary and binary complexes from residual dipolar coupling measurements. J Am Chem Soc. 2009;131:14138–9. doi: 10.1021/ja904766g. [DOI] [PMC free article] [PubMed] [Google Scholar]
- 27.Lange OF, et al. Recognition dynamics up to microseconds revealed from an RDC-derived ubiquitin ensemble in solution. Science. 2008;320:1471–5. doi: 10.1126/science.1157092. [DOI] [PubMed] [Google Scholar]
- 28.Liu Z, et al. Lys63-linked ubiquitin chain adopts multiple conformational states for specific target recognition. Elife. 2015;4 doi: 10.7554/eLife.05767. [DOI] [PMC free article] [PubMed] [Google Scholar]
- 29.Schmitz C, Bonvin AM. Protein-protein HADDocking using exclusively pseudocontact shifts. J Biomol NMR. 2011;50:263–6. doi: 10.1007/s10858-011-9514-4. [DOI] [PMC free article] [PubMed] [Google Scholar]
- 30.Battiste JL, Wagner G. Utilization of site-directed spin labeling and high-resolution heteronuclear nuclear magnetic resonance for global fold determination of large proteins with limited nuclear overhauser effect data. Biochemistry. 2000;39:5355–65. doi: 10.1021/bi000060h. [DOI] [PubMed] [Google Scholar]
- 31.Iwahara J, Schwieters CD, Clore GM. Ensemble approach for NMR structure refinement against (1)H paramagnetic relaxation enhancement data arising from a flexible paramagnetic group attached to a macromolecule. J Am Chem Soc. 2004;126:5879–96. doi: 10.1021/ja031580d. [DOI] [PubMed] [Google Scholar]
- 32.Iwahara J, Clore GM. Structure-independent analysis of the breadth of the positional distribution of disordered groups in macromolecules from order parameters for long, variable-length vectors using NMR paramagnetic relaxation enhancement. J Am Chem Soc. 2010;132:13346–56. doi: 10.1021/ja1048187. [DOI] [PMC free article] [PubMed] [Google Scholar]
- 33.Newby FN, et al. Structure-Free Validation of Residual Dipolar Coupling and Paramagnetic Relaxation Enhancement Measurements of Disordered Proteins. Biochemistry. 2015;54:6876–86. doi: 10.1021/acs.biochem.5b00670. [DOI] [PubMed] [Google Scholar]
- 34.Salmon L, Bouvignies G, Markwick P, Blackledge M. Nuclear magnetic resonance provides a quantitative description of protein conformational flexibility on physiologically important time scales. Biochemistry. 2011;50:2735–47. doi: 10.1021/bi200177v. [DOI] [PubMed] [Google Scholar]
- 35.Emsley L, Bodenhausen G. Optimization of Shaped Selective Pulses for Nmr Using a Quaternion Description of Their Overall Propagators. Journal of Magnetic Resonance. 1992;97:135–148. [Google Scholar]


