Abstract
The isolation and sorting of cells is an important process in research and hospital labs. Most large research and commercial labs incorporate fluorescently or magnetically labeled antibodies adherent to cell surface antigens for cell identification and separation. In this paper, a process is described that merges biochemical labeling with ultrasound-based separation. Instead of lasers and fluorophore tags, or magnets and magnetic particle tags, the technique uses ultrasound and microbubble tags. Streptavidin-labeled microbubbles were mixed with a human acute lymphoblastic leukemia cell line, CCL 119, conjugated with biotinylated anti-CD7 antibodies. Tagged cells were forced under ultrasound, and their displacement and velocity quantified. Differential displacement in a flow stream was quantified against erythrocytes, which showed almost no displacement under ultrasound. A model for the acoustic radiation force on the conjugated pairs compares favorably with observations. This technology may improve on current time-consuming and costly purification procedures.
I. INTRODUCTION
Cell therapies (e.g., cell-based immunotherapies, stem cells) require the isolation and/or purification of cells. Standard technologies that use cell surface antigens include fluorescently activated cell sorters (FACS), which rely on fluorescent particle labeling,1 or magnetically activated cell sorters (MACS), which rely on magnetic particle labeling.2 Amos et al. provide an excellent review of purification strategies.3 Cells with unique cluster of differentiation (CD) cell surface antigens are markers that can be exploited for highly selective labeling and thus, isolation and purification. FACS allows for separation based on several markers, but requires relatively large sample volumes, and is not available in most small labs because of cost. Magnetic bead sorting is less expensive, but there are fewer antibodies available for conjugation, and enzymatic digestion is needed to remove the magnetic particles. We propose a novel ultrasound-based technique that labels cells with antibody-conjugated microbubbles (MBs) and sorts using ultrasound, which we call microbubble cell sorting (MiCS). After sorting, MBs can be removed by applying a small over-pressure to dissolve the gas. If successful, MiCS may overcome the lengthy and costly enrichment and purification processes currently employed, allowing for high-throughput inexpensive solutions that can be economically scaled. As a potential platform technology, additional benefits include rare cell detection and isolation, as well as low sample volume sorting.
Some of the seminal work on ultrasound-based cell separation was originally performed by Coakley and colleagues.4,5 In that work, and in most subsequent ultrasound-based separation strategies, cells are separated by utilizing standing waves.6–9 Under these conditions, cells are attracted to, and align with, the pressure node (a commercial application of this technology is the Attune® flow cytometer, which adds a standing acoustic wave to assist with the hydrodynamic focusing of cells10–12). A motivation for using standing waves is that forces acting on particles can be much greater with standing waves than with traveling waves.13 An added advantage of these systems is that in some cases the separation can be performed label-free. The disadvantage to these acoustic label-free techniques is that there must be a relatively significant difference in either density, compressibility or morphology between the particles to efficiently separate them. Traveling waves also allow sorting or isolating cells over a distance larger than half an acoustic wavelength. An example of a traveling wave for separating bubbles of different sizes is provided in Ref. 14.
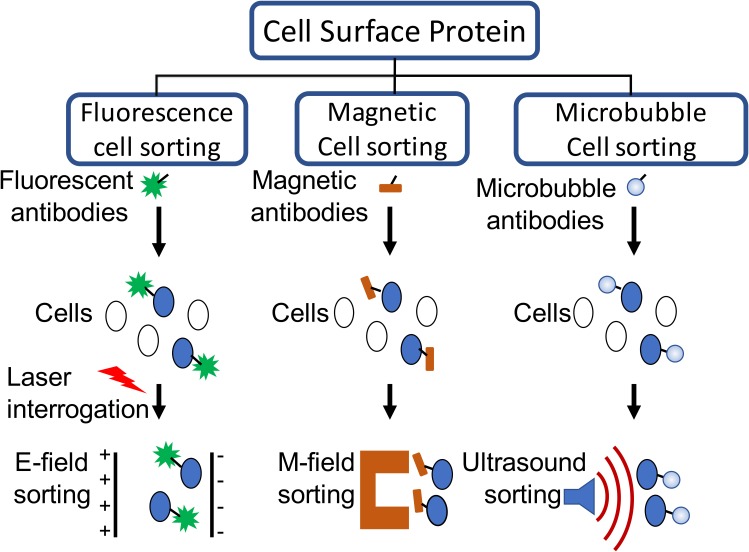
In this paper, we propose the use of ultrasound-based tags, namely, MBs, which are highly reactive to acoustic waves, to facilitate separating cells. Instead of relying on lasers and fluorophores (or magnets and magnetic particles), ultrasound transducers and MBs are used (Fig. 1). Cells can be incubated with MBs and appropriate intermediate ligands for binding, and once the MBs are conjugated to the cells, small amplitude ultrasound pulses can effectively displace the cell-MB conjugates relative to unbound or unconjugated cells. The proof of principle for this technique is presented here. There is a similar technique that uses MB conjugation, but separation is performed by buoyancy, not by ultrasound.15 (We recently became aware of an independent publication that uses cell-MB conjugates and standing waves to separate cells.16)
FIG. 1.
(Color online) Cell purification methods based on cell surface antigen expression. Fluorescently activated cell sorters (FACS) rely on fluorophores to bind to cells, and then use electric fields to sort them. Magnetic cell sorters rely on magnetic particles to bind to cells, and magnetic fields to isolate them. Microbubble cell sorters (MiCS) use microbubbles (MBs) to bind to cells and rely on ultrasound to sort them. Figure adapted from Ref. 3.
The paper is organized as follows. Models for the translational (Sec. II A) and rotational (Sec. II B) acoustic radiation forces (ARFs) are developed considering the specific conditions of the experiments. A model for the translational ARF is developed for a conjugated cell-MB pair. The rotational ARF is derived for a pair of bubbles conjugated to a single cell which rotates in response to the ARF. This model is developed based on a data set where a cell is adherent to a microscope glass slide. Afterwards, the mode is used to estimate the ARF and resulting velocity of the conjugated pair by comparison with data.
Section III describes the cell and MB preparation (Sec. III A), and details of the fixture for taking data under a microscope (Sec. III B). Included in this section is the pressure calibration in a free-field, provided as an upper bound estimate for the pressure amplitude at the cell-MB position.
The results are divided into three subsections. Section IV A describes the observation of the ARF causing a cell to rotate. The cell is conjugated with two MBs, so the theory for the rotational ARF (Sec. II B) was developed specifically for this case. Section IV B describes observations of conjugated cell-MB pairs translating in a stationary (no flow) field. Section IV C describes the ARF under flow with erythrocytes. Only the leukemia cell is deflected, as erythrocytes are not conjugated to MBs expressing anti-CD7 antibodies.
Section V describes some additional features and observations, and some constraints associated with the experiment. For completeness, the ARF for a traveling wave and a standing wave is compared.
II. THEORY
The problem of interest is the motion of a system of a bubble attached to a cell in response to an ARF at MHz frequencies. The MB (size order ∼1 μm) is assumed to be in direct contact with the cell (size order ∼10 μm). Actual separation distances are on the order of nanometers. Section II A describes translational movement, and Sec. II B describes rotational movement.
A. Translational movement
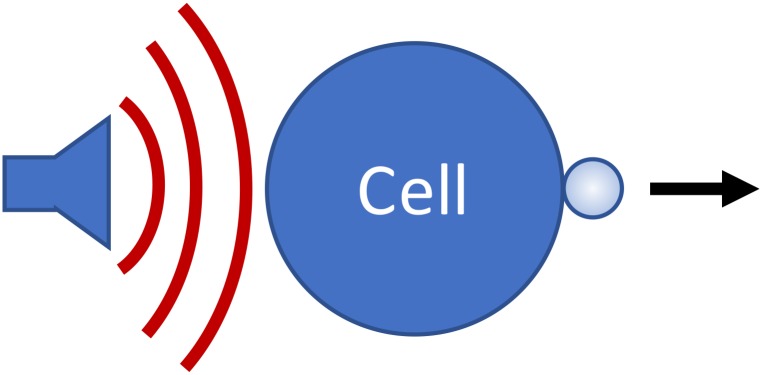
Figure 2 illustrates the system of interest. Our goal is to derive a simple expression that describes how the cell-MB conjugate responds to traveling wave ultrasound pulses.
FIG. 2.
(Color online) Cartoon illustrating the cell-MB system. Under the influence of an acoustic radiation force, the cell-MB conjugate is pushed in the direction of the force.
1. Free cell
Let us first consider the action of the acoustic radiation force on a free, assumed spherical, cell. According to Gor'kov,17 a harmonic traveling plane wave acts on a small (relative to the wavelength) spherical particle embedded in a fluid with the radiation force that is directed along the wave propagation direction and has the following expression:
| (1) |
Here is the spherical particle radius, is sound velocity in the fluid, is the acoustic wave number, is the angular frequency, is the wave intensity, is the complex acoustic pressure amplitude, is the fluid density, and
| (2) |
are constants which characterize the relative compressibility and density of the sphere material as compared with the surrounding fluid. In Eq. (2), and are the sound velocity and density of the particle material.
The velocity under steady-state motion (for small particles the latter is established quickly) is defined by the balance of the ARF and Stokes friction:
| (3) |
where is the fluid viscosity. For estimates we take and . Actually, the sound velocities in cancerous cells can differ from that in water,18 but it would not radically change the result. For , (water), and for a particle of radius = 10 μm at a frequency of = 1 MHz we obtain m/s, where is given in Pa. Hence, for = 100 kPa, m/s = 0.0855 nm/s. This motion is most likely not observable.
Note that in a standing wave the effect can be significantly stronger since the force is proportional to rather than to .17 It can be shown that for the same wave amplitude the ARF from the standing wave is on the order of higher than that of the traveling wave. In the example above this factor is ∼104, i.e., the corresponding velocity is on the order of μm/s, which can more readily be detected. In this paper, however, we only consider traveling waves, and thus the ARF acting on the free cell can be considered negligible.
2. Free microbubble
We now consider a free MB insonated with an ultrasonic pulse. Acoustic radiation forces acting on bubbles are called Bjerknes forces.19 “Primary” Bjerknes forces refer to the interaction between a single bubble and the sound field, and “secondary” Bjerknes forces apply to bubble−bubble interactions when neighbor bubbles attract or repel one another. For bubbles that are small in comparison with the wavelength (i.e., MBs), the primary Bjerknes force can be represented as20
| (4) |
where is the bubble volume that oscillates in time , is acoustic pressure that depends both on time and spatial coordinate , and denotes the time average over the wave period. Equation (4) defines a nonlinear interaction between the monopole pulsation and translational (dipole) oscillations of a bubble. This process was considered in detail in Ref. 20. Our application involves low pressure amplitudes, and thus linear variations of bubble volume and pressure in Eq. (4). The acoustic pressure in the harmonic wave can be expressed as follows:
| (5) |
where the asterisk denotes the complex conjugate. The radius and volume are perturbations about equilibrium, , where , and thus . In the linear approximation, the bubble radius perturbation in response to the acoustic pressure Eq. (5) also has harmonic behavior:
| (6) |
where is complex amplitude of . The value of can be expressed through the pressure amplitude using the linearized Rayleigh equation. That gives
| (7) |
Here is the total damping constant that accounts for radiation, thermal, and viscous dissipation, and is the resonance angular frequency of the bubble. In the case of encapsulated bubbles Eq. (7) can be also used, if the resonance frequency and damping constant are defined from the shell properties.21–24 Using the above expressions, the Bjerknes force Eq. (4) then can be expressed as follows:
| (8) |
In the case of a traveling wave, , where is distance along the wave propagation direction. Then from Eq. (8) it follows that the vector force has only a component along the x-direction, which is expressed as follows:19
| (9) |
Here and is the bubble oscillation quality factor.
In practice it is not important to know what the radiation force is per se, but rather to know the bubble translation caused by that force. Strictly speaking, the full description of the bubble movement should be performed by considering the oscillatory translation of the bubble center due to the instantaneous force caused by the pressure gradient .25–27 In that description, it is important to account for the fact that the bubble and surrounding fluid move with different velocities.28–30 However, at low acoustic pressures, the oscillatory displacement of the bubble center is small. More important is the drift that accumulates over time due to interaction between the monopole and dipole oscillations.31 This drift of the bubble center can be calculated by averaging the displacement over the wave period. Such an analysis shows that, similar to what we described for a small spherical particle, the bubble drift velocity of the steady-state motion is defined by the balance of the ARF and Stokes friction. For simplicity we assume that the Stokes' drag force for encapsulated bubbles can be expressed as for rigid spheres. As a result, the bubble drift velocity is also described by Eq. (3), with the change of the particle radius by the bubble radius . From Eq. (9) we get the corresponding bubble drift velocity:
| (10) |
It is noteworthy that for weak losses () far from resonance, the bubble velocity is proportional to , i.e., in the case of low losses the bubble translation is fairly small in a traveling wave field. However, at resonance () the translational velocity is proportional to , suggesting that it is more advantageous to operate near the bubble's resonance frequency.
3. Cell-bubble conjugate
Now consider the main problem; viz., the motion of the cell-MB coupled system. In this case the driving force is still associated with the bubble, but the viscous drag is due mainly to the much larger cell (we still consider it non-deformable, so that the classic Stokes force should be used). At first glance, the acoustic flow around a bubble attached to a cell is different from that for a free bubble. For instance, if the cell were absolutely rigid, then the resonance frequency of a bubble would decrease: 28 The cell, however, is not rigid but instead behaves as a “soft solid,” whose Young's modulus is below 10 kPa.30 Under such conditions, the gelatinous cell influences the bubble oscillation as if it were a fluid.29 Therefore, it is reasonable to consider the bubble oscillation being identical to that of a free bubble. In particular, if one bubble is attached to a cell, the steady motion of the cell has the following drift velocity [see Eqs. (3) and (9)]:
| (11) |
which differs from the free bubble expression, Eq. (10), by the ratio of the bubble size to cell size.
Parenthetically, we consider briefly the case where two or more MBs are attached to the cell. If the MBs are separated by a distance much larger than their radii, each MB contributes to the driving force independently and the driving forces can be summed. However, if the separation distance between MBs is comparable with their radii, their interaction can affect such parameters as the bubble resonance frequency,28 the added mass in the average translational motion,32 and the mutual MB attraction due to the secondary Bjerknes force (e.g., Refs. 31 and 33). Although such cases were sometimes observed in our experiments, we did not consider them here.
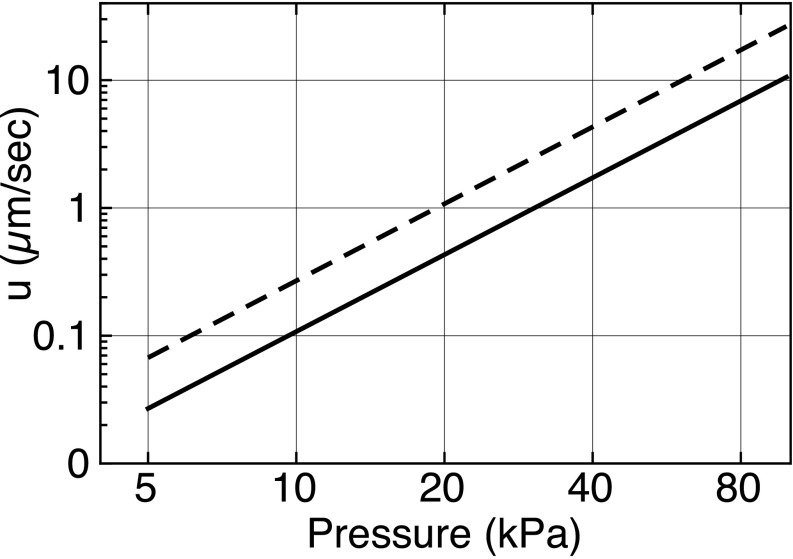
Equation (11) is plotted in Fig. 3 for pressure amplitudes ranging from 5 to 100 kPa, with the following parameters: = 1 μm, = 5.7 μm, = 1000 kg/m3, = 1500 m/s, = 1 MHz, 5 MHz, = 0.001 Pa s, = 5. The choice of resonance frequency was informed by Fig. 6 of Ref. 34—smaller shelled MBs have higher resonance frequencies. That same paper (Figs. 5 and 7) provides us with a range of estimates for Q. For an R0 = 1.9 μm, Q ≈ 4, while for an R0 = 1.2 μm, Q ≈ 10. Both values are plotted, providing a range of drift velocities for a given pressure amplitude.
FIG. 3.
Log-log plot of the cell-MB system drift velocity as a function of ultrasonic pressure amplitude. Solid line for Q = 10, dashed line for Q = 4.
FIG. 5.
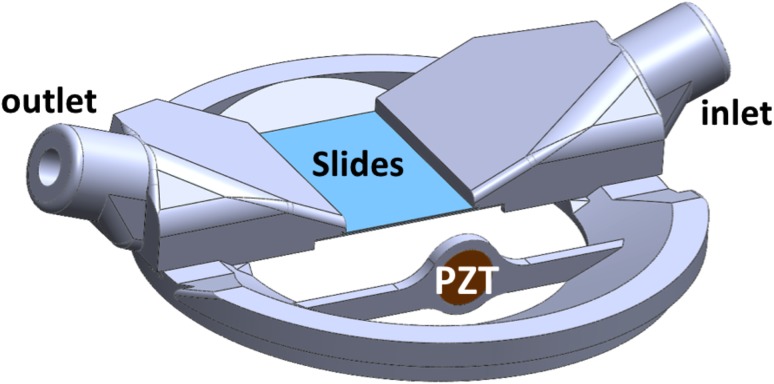
(Color online) Microscope coverslips were sandwiched together, separated by 87-μm wires attached at the corners. The slips were mounted to a 3-D printed fixture so that a suspension of cells could flow between them. A PZT transducer operating at 1 MHz generated pulses of ultrasound that displaced cell-MB conjugates. The entire housing was submerged in degassed water and aligned under a microscope for imaging.
FIG. 7.
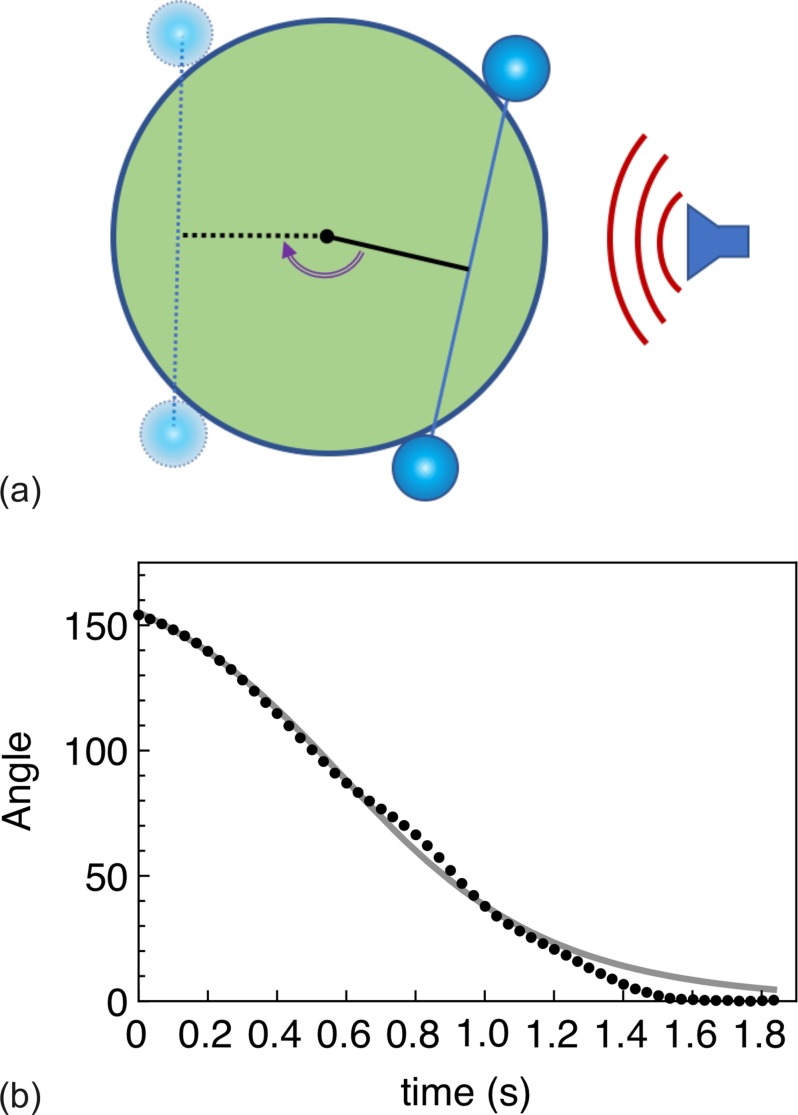
(Color online) The cell-MB conjugate rotates until the pair is aligned to the ultrasound field. (a) Illustration of cell rotation. (b) Quantification of cell rotation from Mm. 1. The solid line is the solution to Eq. (11). The final angle is arbitrarily labeled as 0 degrees.
B. Cell rotation
The following model was developed to describe an experimental observation, the rotation of a cell with two conjugated MBs. Let us assume that (1) there are two identical bubbles and that they occupy the central cross-sectional plane, (2) the radiation forces acting on the bubbles are equal, and (3) those forces are parallel to that plane, as illustrated in Fig. 4. As for the force direction, let us assume that the final position of the cell-MB conjugate corresponds to the equilibrium when the line that connects the two bubbles is perpendicular to the force direction.
FIG. 4.
(Color online) Geometry of system. The midplane shows two bubbles sitting against a spherical cell of radius a. An arm (black line) bisects the midpoint of the line connecting the bubbles. The arm length is a · cos (γ /2), where angle γ is the angle between the lines that connect the center of each bubble with the center of the cell. Both bubbles experience the same radiation force F shown by red arrow. The corresponding torque acting the cell from each bubble is expressed as a product of the force projection F · sinφ and the arm length, which results in the net torque T = −2 Fa· sinφ· cos (γ /2).
A bubble's acceleration or deceleration causes movement of some volume of the surrounding fluid. The correspondent fluid mass (added mass) is equal to half the volume of the sphere times the density of the fluid. The bubbles are much smaller than the cell, so as with the previous case, that added mass can be considered to be negligible.
Let us consider the midplane geometry shown in Fig. 4, where two MBs are adherent to a spherical cell of radius a. An arm (black line) bisects the midpoint of the line connecting the bubbles. The corresponding angle is marked by φ. The length of the arm is , where is angle between the radius-vectors of the bubbles. Both bubbles experience the same radiation force F shown by red arrow. The projection of these forces perpendicular to the arm is F sinφ. The net torque is thus .
A sphere of radius a rotating with angular velocity is influenced by the viscous torque35
| (12) |
The mass moment of inertia of a solid sphere of radius a and mass M is given by
| (13) |
The equation of motion is
| (14) |
This gives
| (15) |
which describes a classical pendulum. It is convenient to rewrite Eq. (15) in the following form:
| (16) |
where
| (17) |
Later, by comparing solutions of Eqs. (16) and (17) with data, we will extract the ARF, F. Also, it is worth noting that if the angle, φ, changes slowly, it is reasonable to neglect the first term in the left-hand-side of Eq. (16), so that
| (18) |
This first-order differential equation can be easily integrated:
| (19) |
or, in terms of the rotation angle,
| (20) |
We compare the solutions, Eqs. (16), (19), and (20) with experimental data in Sec. IV A.
III. EXPERIMENTAL DESIGN
A. Cell and microbubble preparation
Leukemia cells were selected for these proof-of-principle studies because of the well-known antigens expressed on them; for example, CCL 119 cells have the following antigens with variable frequencies of occurrence on individual cells within a population: CD3 B (37%), CD 4 (50%), CD5 (95%), and CD7 (77%), where the percentages express the frequency of occurrence of that particular antigen. Note that the cell must express a surface marker, it cannot be an intracellular marker, as the MBs are too large to penetrate the cell membrane.
TargeStar-SA MBs (Targeson, San Diego, CA) were used for these studies. The MBs are lipid-shelled and labelled by the manufacturer with streptavidin. Typical MB concentrations are 1.9−2.5 × 10⁹ MBs/mL, with an average diameter of about 2 μm and an average streptavidin loading of 1 × 10⁵ molecules/MB.36 The manufacturer's preparation instructions called for labelling the contents of an entire vial of MBs with the biotinylated antibody of choice. For our purposes, this approach would use unnecessarily large amounts of antibody, and so we took the different approach of first washing, concentrating and incubating the cells with biotinylated anti-CD7, washing them again, and then incubating the antibody-labelled cells with the streptavidin-labelled MBs. Very conservative quantities of antibody were used, and cell-MB conjugation rates were very high (294 of 295 observed cells were conjugated with at least 1 MB).
CCL-119 human leukemia cells were obtained from the American Type Culture Collection (ATCC, Manassas, VA). They were cultured in suspension at 37 oC under a 5% CO2 atmosphere in a high glucose formulation of RPMI 1640 medium containing L-glutamine and HEPES, supplemented with 10% fetal bovine serum and 1% penicillin-streptomycin solution (ATCC, Manassas, VA). For experimental use, cell concentrations were measured using a Z1 Coulter Counter (Beckman-Coulter, Brea, CA). Five to six million cells were concentrated by centrifugation (300 g × 5 min, 3 oC) in 15 mL centrifuge tubes. The pellets were re-suspended in 500 μL of Dulbecco's phosphate buffered saline containing 10% FBS, and the cells transferred to microcentrifuge tubes. Four 250 μL rinses of the 15 mL tube followed, pooling the recovered rinsate with the contents of the microcentrifuge tube, and the resultant 1.5 mL of cell suspension was re-centrifuged to wash the cells. This wash step was repeated once. The last supernatant was then drawn off as completely as possible without loss of the pelleted cells (∼50 μL remaining), and an aliquot delivering between 0.5–1.0 μg of biotinylated mouse monoclonal anti-CD7 antibody (Abcam, Cambridge, MA) per million cells was added, bringing the total volume to 100–150 μL. The cell and antibody mixture was allowed to react for 30–45 min at 3 oC. The cells were then washed twice as described above to remove any unbound antibody and this reduce potential competition between unbound- and MB-bound anti-CD7 for CD7 binding sites on the cell surface. Following labeling the cells with anti-CD7, the concentrated cells were then reacted with TargeStar SA MBs using a 1:1 volume ratio. This preparation went directly (i.e., without further washing) to the microscopy and micro cinematography lab, where they were diluted with PBS as necessary to produce optical fields containing many cells but not so many as to obscure the view of individual cells.
B. Apparatus
The experimental apparatus is illustrated in Fig. 5. It was designed to use with an inverted microscope to image the cell-MB pairs. The viewing chamber was made from two microscope slide coverslips that were brought together to form a small rectangular volume. A strand of 87 μm diameter wire was placed at each corner with a small amount of epoxy to bond the coverslips together while creating a small gap between them. In addition, a small amount of epoxy was placed along the length of the coverslips (proximal and distal to the transducer) under a microscope to create a seal. This allowed fluid (viz., cell suspensions) to flow from the input port, through the gap between the coverslips, and to drain through the output port. The bonded viewing chamber was then affixed to a three-dimensional (3-D) printed housing. In particular, the round ports reshaped into flat slits to more readily allow the suspensions to flow through the flat view chamber. A 9 mm diameter PZT was press-fitted into a slot orthogonal to the flow direction, centered in the same plane as the coverslips. The total exposed area of the slides was approximately 2 × 2 cm (the imaging field of view under a 10× objective was less than 12 × 1 mm). The PZT was driven by a function generator (model HP 33120A). Notably, there was no amplification, no matching network, nor a matching layer applied to the transducer. At different times, the transducer was driven by a voltage from 1 to 10 V (pk-pk). Specific voltages used are listed below.
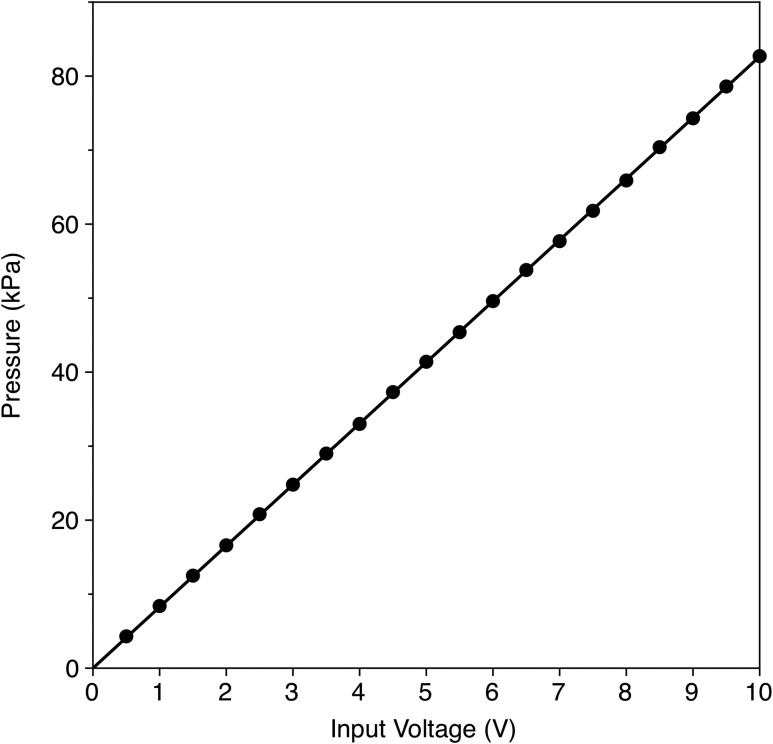
The pressure amplitudes inside the 80 μm gap between the coverslips could not be measured. Instead, after the study, the inlet and outlet ports, as well as the coverslips, were removed. The PZT, still in the fixture, was placed in a degassed water tank for pressure measurements at various driving voltages. A calibrated Onda HGL-0200 hydrophone was used with an AH-2020 preamp (Onda Corp., Sunnyvale, CA). The hydrophone was mounted on a three-axis translation stage, while the transducer apparatus was fixed in place. The hydrophone was scanned until the maximum pressure was measured. Pressure amplitudes were then recorded for voltages ranging from 0.5 to 10 V (pk-pk). The results are shown in Fig. 6, along with a linear best-fit curve.
FIG. 6.
Calibration of the PZT transducer output. An Onda hydrophone, model HGL-0200 was used to measure the pressure amplitude at the focus in free field as a function of input voltage (pk-pk).
Although it was impossible to measure the acoustic field between the coverslips, we used COMSOL to estimate the uniformity of the pressure field. The results (not shown here) suggest that the pressure field was relatively uniform within the microscope's field of view of approximately 1 × 1 mm.
IV. RESULTS
A. Initial response—cell rotation
As described in Sec. II, a MB is much more susceptible to an ultrasound pulse than is a cell, whereas a cell conjugated with a MB acts predominantly to induce a drag on the MB's motion. Because of this, when the coupled cell-MB pair is initially insonated, the pair will orient itself to the direction of the ultrasound pulse. That is, the cell will rotate until the cell-MB conjugate is aligned with the ultrasound beam. A particularly impressive display of this is shown in the supplemental video (Mm. 1), and quantified below. A leukemia cell was observed with two MBs attached. Under CW insonation with 2 Vpk-pk (ultrasound direction given by arrow), the cell rotated around its center of mass. From this observation, it was possible to calculate the rotation angle as a function of time, shown in Fig. 7 (the angle is relative, the final position was labeled as 0°). After about 1.5 s, the cell-MB conjugate aligned with the ultrasound field, and no further rotation was observed.
Mm. 1.
Video of cell rotation due to acoustic radiation force. This is a file of type “mov” (1.1 Mb).
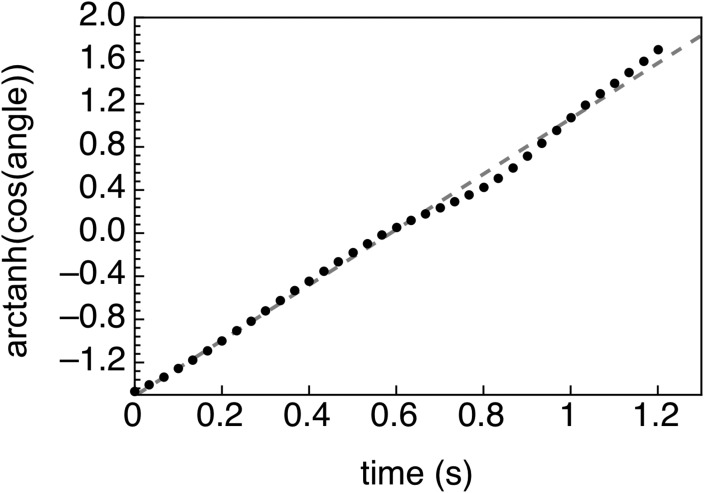
From Eq. (19) it follows that the radiation force can be extracted from the observations by considering the following linear dependence:
| (21) |
Equation 12 is compared with the data by plotting the as a function of time (Fig. 8), along with a best fit straight line. There is a very good correlation (R2 = 0.9956). The straight line corresponds to , which gives F ≈ 1.7 ×10⁻¹² N. Here the following parameters were used: γ = 104°, η = 0.001 Pa s, and a = 5.7 μm. The cell radius a was taken as half of the average cell diameter calculated from individual measurements of 163 living CCL119 cells (11.37 ± 1.94 μm). It is worth comparing the ARF extracted from the data with a calculation of the ARF from Eq. (9). We can ignore the contribution of the cell because the ARF is dominated by the MB. Using R0 = 1 μm, P = 80 kPa, and Q = 4, we find the ARF acting on the cell-MB conjugate to be F = 1.85 × 10⁻¹² N. The model compares well with the data-extracted value, especially given the uncertainties in the model variables.
FIG. 8.
The data from Fig. 7(b) is re-plotted here using the linear Eq. (12). The best fit line to this equation is y = 2.572 x −1.51, with an R2 = 0.9956. Comparing to Eq. (12), the force can be extracted, in this case, F ≈ 1.7×10⁻¹² N.
Finally, let us estimate the cell velocity when it is moving under the radiation force that acts only on the MBs but not on the cell. According to Stokes's law, , from where . For we obtain u = 31.6 μm/s.
B. Translation without flow
If the cell is not fixed in space, not only will it rotate, but in a traveling wave it will also translate in the direction of the ultrasound pulse. This is shown in Mm. 2. Observations show the cell rotates to align with the sound field. The stable equilibrium position is such that the MB is dragging the cell behind it.
Mm. 2.
Cell rotation and translation due to acoustic radiation force. This is a file of type “mp4” (5.6 Mb).
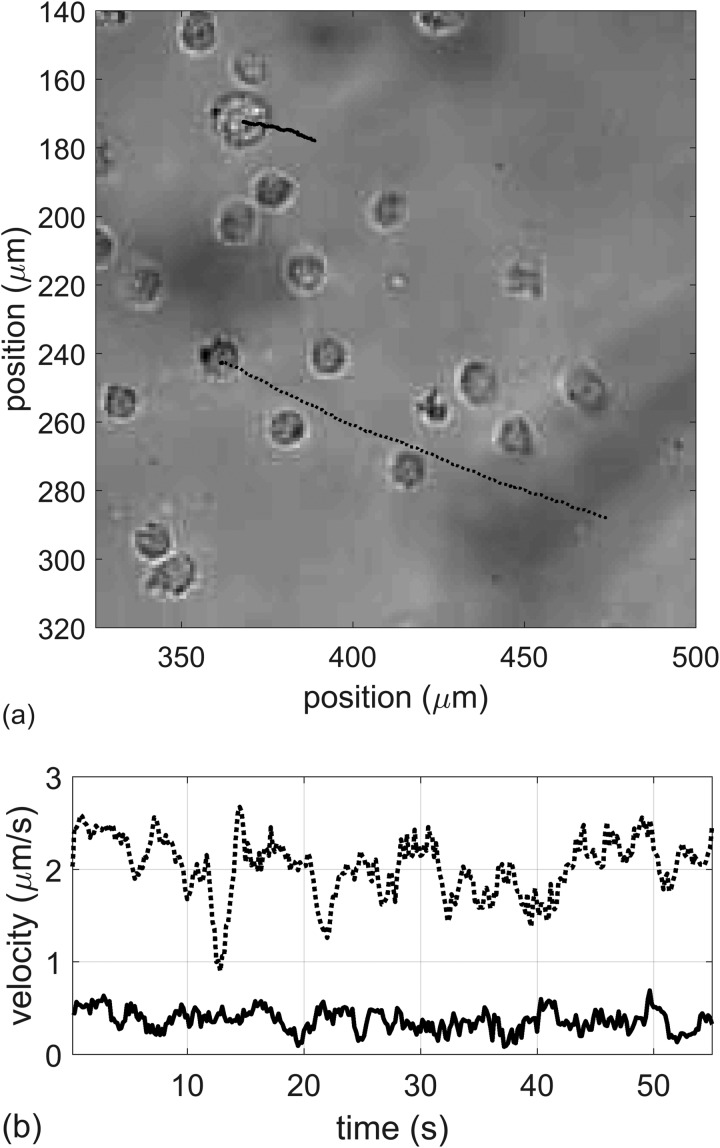
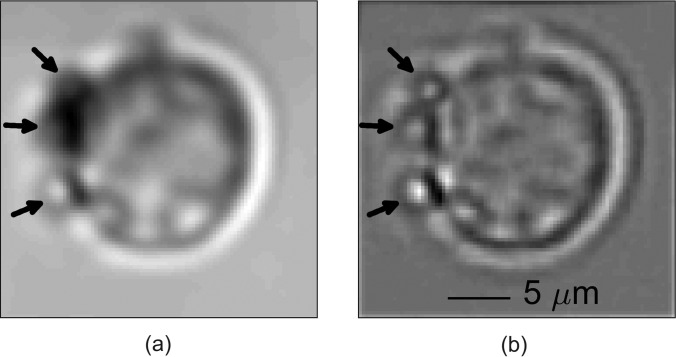
The translational velocity of the pair depends not only on the pressure amplitude, but also on the number of attached MBs. This is illustrated in Fig. 9, where an analyzed imaged is shown with two cell-MB pairs being pushed through a field of other cells. The corresponding movie is shown in Mm. 3. From the video, one can observe two cells being pulled by attached MBs under the ARF. The upper cell's motion is highlighted in blue, while the lower cell is highlighted in red. Noticeably, the lower cell moves about 5x faster than the upper cell. The difference in velocity is partly due to the size difference in cells, and also to the number of MBs attached to the cells. The upper cell has one attached MB. The lower cell appears to have three attached MBs, as shown in Fig. 10. Assuming the MBs are acting independently, the lower cell would be expected to move 3x faster than the top cell. But the velocity is also proportional to (1/size), and the bottom cell is about 3/5 the size of the upper cell. Therefore, the relative difference in the velocities is 3x(5/3x) = 5x, which agrees with the video analysis.
FIG. 9.
(a) Analysis of cell-MB pair movement in response to an ultrasound pulse. (b) Corresponding velocities of the two pairs. The smaller cell with 3 MBs moves 5x faster than the bigger cell with one attached MB.
FIG. 10.
(a) Image of leukemia cell with attached MBs (shown by arrows). (b) Filtered image appears to show three attached MBs. The cell image is a composite image of 20 frames during which time the cell was relatively stable as ultrasound was not on. Translational and rotational cross-correlation was used to align the image frames prior to averaging. The composite image was high-pass filtered using a Gaussian kernel. The average cell diameter was about 11 ± 2 μm.
Mm. 3.
Video of translating cells due to acoustic radiation force. This is a file of type “mp4” (1.7 Mb).
For these preliminary studies, we quantified the average drift velocity of 7 cell-MB conjugates at either 40 - or 80-kPa, shown in Table I. Recall that the listed pressure is the maximum free-field amplitude. The actual amplitudes at the location of the conjugates are unknown (i.e., doubling the pressure amplitude should increase the velocity by 4x). Other factors that may influence the results are discussed later (Sec. V).
TABLE I.
Averaged drift velocities of cell-MB conjugates.
Maximum pressure measured in the free field, not between the coverslips.
C. Translation under flow
In cell sorting applications, the goal is to isolate different cell types according to the presence or absence of unique cell surface characteristics. In FACS systems and some MACS systems, this is accomplished under flow. Indeed, our goal is to develop the technology so that tagged cells are forced out of the main flow for isolation or sorting. To determine the feasibility of separating tagged cells from untagged ones, we mixed leukemia and anticoagulated erythrocytes in a vial and injected the cell suspension into the view chamber apparatus (Fig. 5).
During operation, a syringe pump would flush the system with saline prior to adding the cells. Once the saline started to flow from the output port, the saline-filled syringe would be replaced by a syringe containing the mixed cell suspension, and the operator would view a region of interest (ROI) until cells began to flow by. The operator would then begin collecting video data and manually activate ultrasound pulses. After a few minutes, the ROI would often become congested with cells sticking to the glass coverslips, so the ROI would be moved until a new area with sparse adherent cells was found. This was repeated over approximately 10 min. Several of these studies were performed over several days. Movies were downloaded for later processing.
Most movies showed incomplete events; in some cases, the action of the ultrasound pulse occurred when the coupled cell-MB conjugates were out of focus, making it difficult to clearly observe how they responded. In other cases, the conjugates were too close to the upper coverslip and their ultrasound-induced translation was impeded or arrested when they interacted with the coverslip. In still other cases, the translating conjugates collided with other, untagged cells that were blocking the path.
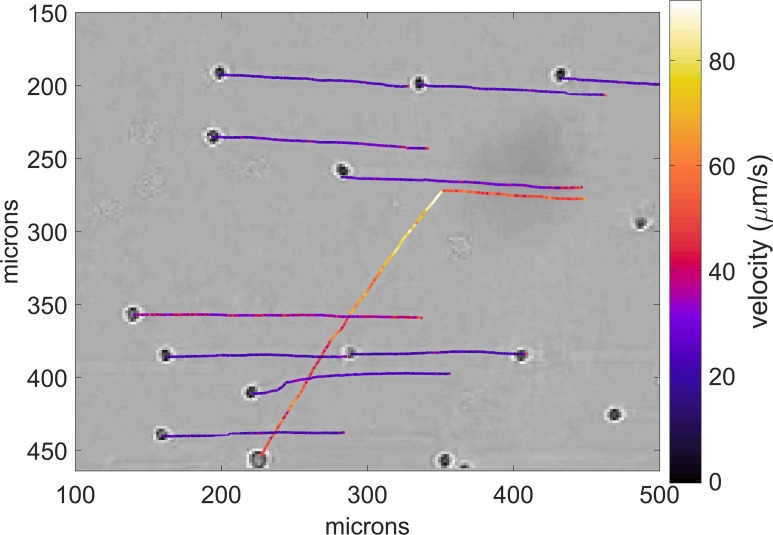
The data shown in Fig. 11 illustrate one example where video evidence was not compromised. The corresponding video is shown in Mm. 4. In this data, a relatively sparse number of erythrocytes are seen traversing the field of view in response to flow. Then, a leukemia cell enters from the right. It is traveling faster than the erythrocytes. When the cell nearly reaches the midpoint of the field of view, the ultrasound is turned on, and the cell is displaced relative to the erythrocytes. In the video, the change in direction of the cell is immediate and significant. The dimensions and velocities were obtained by calibrating the microscope against a 10-μm calibration slide. Video analysis was used to track the motion of the cells. Cells were manually selected in the first frame in the video series and tracked using translational cross-correlation over the remaining frames in the series. Some, but not all of the erythrocytes were tracked to show their paths before and after the ultrasound was turned on. The cell locations shown correspond to the end of the highlighted path.
FIG. 11.
(Color online) Paths of individual cells (erythrocytes and leukemia) under flow, obtained from the video clip. The cell locations shown correspond to the end of the highlighted path. The erythrocytes flow horizontally right to left and are barely disturbed when the ultrasound is turned on. The leukemia cell, on the other hand, changes direction and displaces in the direction of the ultrasound pulse. The calibrated images show the actual velocities. The erythrocytes flow at a velocity of about 20 μm/s. The leukemia cell initially flows at about 40 μm/s. When the ultrasound is turned on, its velocity increases to about 90 μm/s before slowing down to about 50 μm/s. For analysis, cells were manually selected in the first frame in the video series and tracked using translational cross-correlation over the remaining frames in the series. The resulting correlation was fit to a paraboloid to compute sub-pixel resolution displacements.
Mm. 4.
ARF-generated deflection of tagged cell in a flow with untagged erythrocytes. This is a file of type “mp4” (7.0 Mb).
D. High-throughput sorting
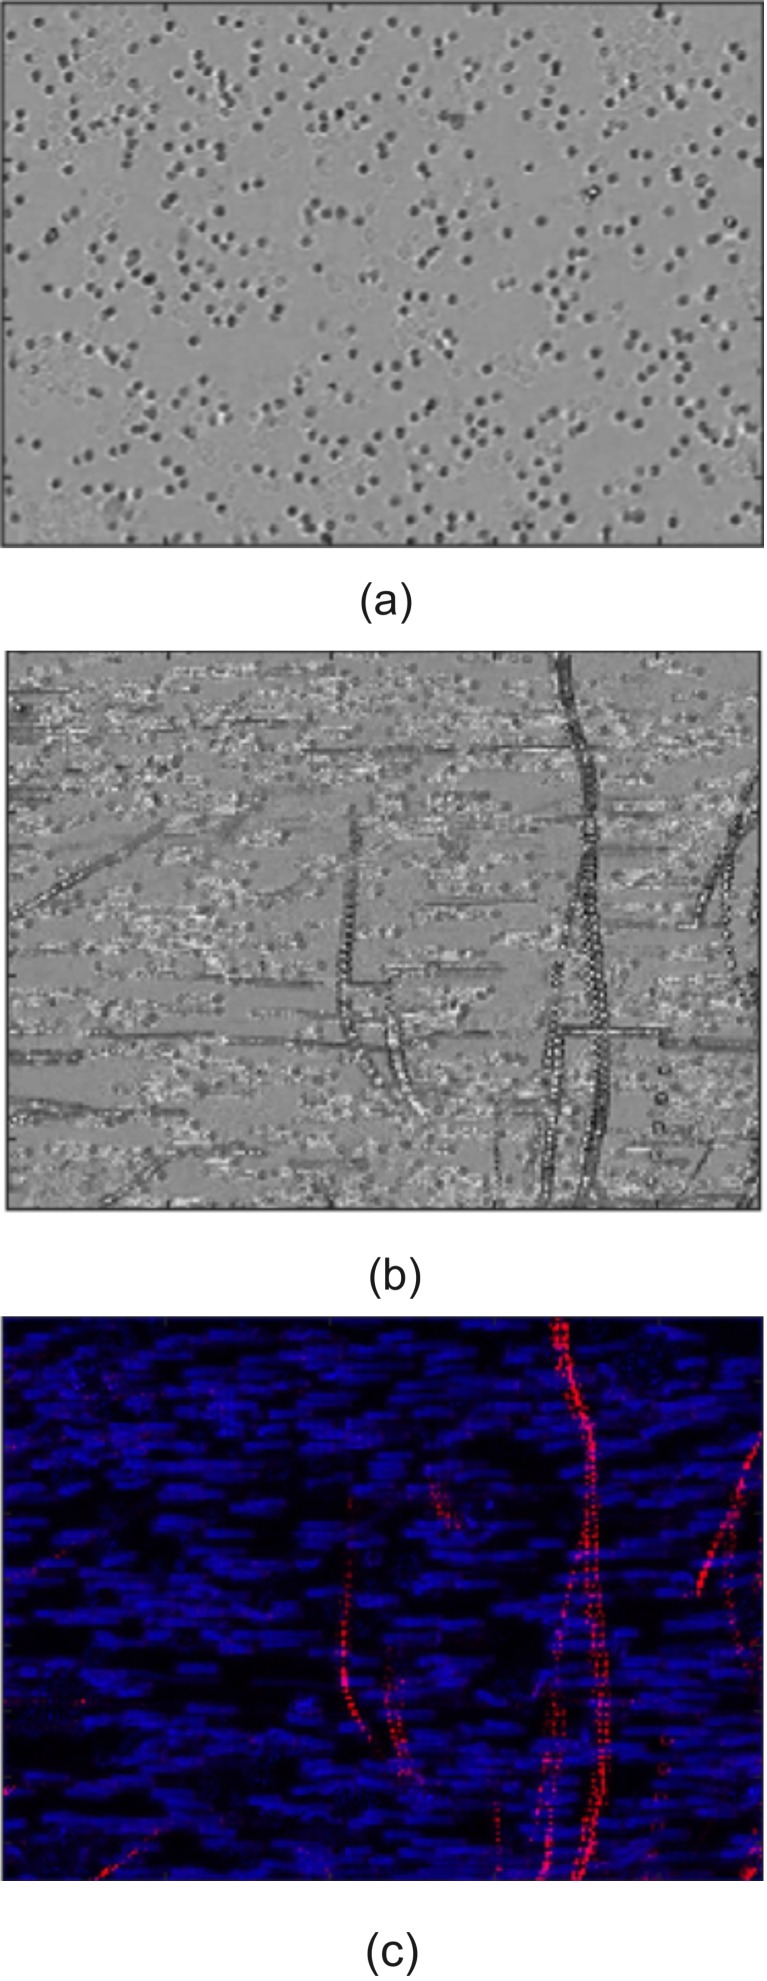
The application of this technology may be useful for large scale (positive or negative) sorting, as well as rare cell sorting. We performed a simple test with a much more concentrated suspension of leukemia cells and erythrocytes (see Fig. 12). In this case, the concentration is approximately 100× higher than that shown in Fig. 11. Figure 12(a) shows a still image of a mixture of erythrocytes and leukemia cells, before the ultrasound was turned on. Figures 12(b) and 12(c) shows a set of stacked images from the video file (see Mm. 5) that includes the images before and during ultrasound activation.
FIG. 12.
(Color online) Image processing of video data. (a) Raw microscope video image of cells (leukemia and erythrocytes). (b) Stacking all the images from the video shows cell tracks (movement was from top to bottom). Non-horizontal tracks are leukemia cells tagged with MBs) being pushed by an ultrasound pulse coming from above the image. (c) Processed data using velocity filtering so that high (relative) velocity is red, low velocity is blue. The tracks of individual leukemia cells can be distinguished from a multitude of untagged cells moving horizontally. Image is approximately 1 mm wide.
Mm. 5.
Video of deflection of tagged cells in a flow with untagged erythrocytes. This is a file of type “mp4” (10.0 Mb).
The basic cross-correlation tracking method used on the cell-sparse video in Fig. 11 could not track individual cells in this cell-dense video. As such, a filtering approach based on velocity was implemented to visually differentiate tagged and untagged cells; tagged cells moved significantly faster than untagged cells when ultrasound was applied. High velocity tagged cells were filtered out of the video sequence using a low-pass Butterworth filter applied to each pixel across all video frames. The average residual powers for each pixel were then assigned to the blue channel of an RGB image. Low velocity cells were similarly filtered out using a high-pass Butterworth filter with the residual power assigned to the image's red channel.
One can clearly see the displacement of tagged leukemia cells. In some cases, the paths are not straight lines. We presume that the cells collided with untagged cells, causing distortion of the path. In addition, the secondary Bjerknes force will cause an attraction between two MBs of nearly the same size. Note that these images are too coarse to resolve MBs; only erythrocytes and leukemia cells can be seen; i.e., none of the paths are MBs.
V. DISCUSSION
In this work, we wanted to determine the feasibility of pushing conjugated cell-MB pairs via ultrasound pulses in a flow system under propagating (not standing) waves. For a model system, we chose leukemia cells, and targeted the MBs with anti CD7 antibodies. Our objectives were broadly met. We showed displacement of the conjugated pairs relative to non-conjugated (erythrocyte and/or leukemia) cells in a model system under both stationary and flow conditions. Our simplified model for the velocity of the coupled pair from Eq. (11) is not expected to agree quantitatively with the data, as there are several unknown parameters. However, the calculated drift velocity obtained from the rotation data had good agreement with the experimental observations.
A. Standing vs traveling waves
It is worth examining the differences between a system employing a traveling wave mode, and one with standing waves. As discussed in Sec. II A, the Bjerknes force for a traveling wave follows from Eq. (8) using :
| (22) |
Here is the real amplitude of the traveling wave . For a standing wave, the complex acoustic pressure amplitude changes to , and Eq. (8) results in the corresponding radiation force:
| (23) |
According to Eq. (22) and its approximate version, Eq. (9), a traveling wave always pushes the bubble along the propagation direction; i.e., away from the source. For a standing wave, Eq. (23) shows that the force is equal to zero at pressure nodes and antinodes, and the force is directed toward a pressure antinode for small bubbles (smaller than the resonance size: ), and the force is toward a pressure node for large bubbles (larger than the resonance size: ). It is interesting to compare the absolute values of these forces. Let's use the bubble oscillation quality factor , the wave frequency normalized by the bubble resonance frequency , and a characteristic value for the force:
| (24) |
Then the expressions for the forces become dimensionless and thus easier to compare:
| (25) |
| (26) |
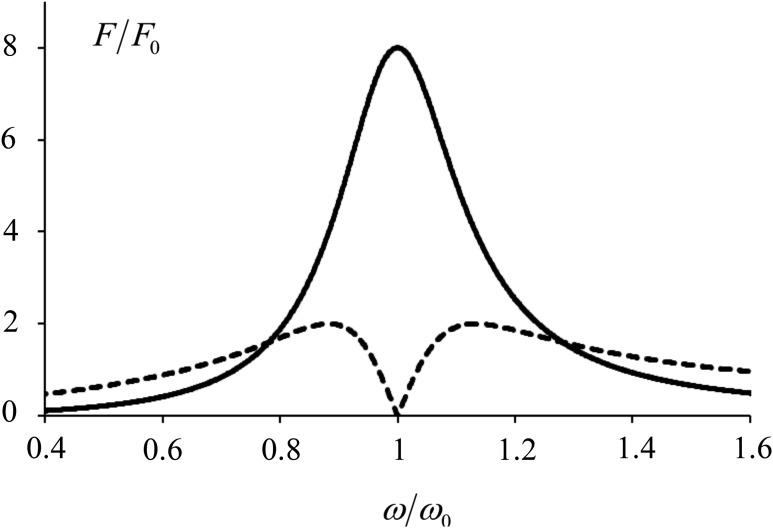
Typically, a gas bubble quality factor is around . Using that assumption, the frequency dependence of forces is plotted in Fig. 13. From these curves the following conclusions can be made: (1) In both cases the most efficient forcing happens when the frequency is close to the resonance frequency. In the best case, the propagating wave creates a radiation force four times higher than does the standing wave. (2) For a propagating wave, it is best to be near resonance. (3) If one chooses the near-resonance case for the standing wave, it is more efficient to be a little bit off resonance: the best case is when = 0.95 or 1.05. Here is the driving frequency, and is the bubble resonance frequency. When the drive frequency is exactly at resonance, the force is equal to zero. (4) When the bubble is driven far from the resonance, the standing wave becomes more efficient.
FIG. 13.
Plot of magnitude of the normalized radiation force on a bubble with Q = 4 versus normalized frequency in a standing or traveling wave: is shown with a solid line and is shown with a dashed line. The standing wave has a null exactly at resonance, but far from resonance, the force is larger than for traveling waves.
These results suggest that the most efficient paradigm for acoustic forcing of cell-MB conjugates is a traveling wave system using MBs with a very narrow size distribution and driven near their resonance frequency. An added advantage of traveling waves is the ability to displace the cell-MB conjugates over larger distances than a half-wavelength. Also, standing waves require a tighter control of tuning.
B. Faster vs slower movement
One would expect that, in the absence of other forces, all particles should flow with the fluid at approximately the same velocity. However, the initial velocity (prior to initiating the acoustic pulse) of tagged leukemia cells was noticeably higher than the erythrocytes. Variations in fluid velocity within the <1 mm field of view is probably precluded, given the slow (and presumably laminar) flow. A probable explanation is that the particles are not located at the same plane. In the experimental system, we assumed that the cross-sectional flow was parabolic, and the coverslips presented no-slip boundary conditions. The microscope was focused near the upper coverslip. The leukemia cells may be slightly below the erythrocytes, putting them in a faster flow stream. Further, our system's depth of field was relatively narrow. The depth of field is given by37
| (27) |
where d is the depth of field, n is the index of refraction (in our case, air = 1), and NA is the numerical aperture. We used a Nikon CFI Plan Fluor 10× objective which has an NA = 0.3. For an average optical wavelength of λ = 500 nm, d = 5.3 μm. This is about the diameter of an erythrocyte (6 −8 μm), and less than half the diameter of a leukemia cell. The leukemia cells are slightly less focused than erythrocyte, suggesting they were in a slightly different (lower) plane, and thus subject to a slightly different (higher) flow velocity.
C. Conjugate velocities
Table I lists the drift velocity from several observations. Although quantitative, there are several issues which limit the interpretation of these values. First, the actual pressure amplitude at the location of the cell-MB conjugate is unknown. Only the maximum free-field amplitude is known. The conjugates most likely experienced a different pressure amplitude. Second, in some cases the conjugates may have experienced additional drag from sticking, or being close to, the coverslip surface. Finally, the actual number of MBs conjugated to the cell is unknown. There may have been other attached MBs that were out of the image plane, and thus not seen. The drift velocity would be affected by these additional MBs, as described in Sec. IV B. Among future refinements will be to better control the number of MBs conjugated to cells, allowing for more accurate comparative studies.
VI. CONCLUSION
The isolation and sorting of cells is an important process in research and hospital labs for purifying cell lines. Although FACS and MACS are available, they can be unwieldy to use, expensive, or time consuming. We have undertaken a study to determine the feasibility of using ultrasound and tagged MBs as a means to isolate, enrich, sort and purify cells with specific cell surface antigens as a first step in developing a high-throughput, easy-to-use and inexpensive MiCS cell sorter. Initial studies focused on determining how the cell-MB pair initially responds to an ultrasound pulse, and their displacement relative to untagged cells. Future work will focus on developing a two-port input and output system to allow us to sort the coupled pairs and optimize sorting sensitivity and specificity, cell viability, recovery rate, and tagging efficiency.
ACKNOWLEDGMENT
This work was supported in part by the Life Sciences Development Fund Agency, Grant No. 3292512, RBBR 17-02-00261, NIH P01 DK43881, and NSBRI through NASA NCC 9-58. The authors wish to thank Camilo Perez for discussions on cell tagging and flow cells, Alicia Clark for her help with the experimental setup, and Chris Hunter for his help with calibration.
References
- 1. Julius M. H., Masuda T., and Herzenberg L. A., “ Demonstration that antigen-binding cells are precursors of antibody-producing cells after purification with a fluorescence-activated cell sorter,” Proc. Natl. Acad. Sci. U.S.A. 69, 1934–1938 (1972). 10.1073/pnas.69.7.1934 [DOI] [PMC free article] [PubMed] [Google Scholar]
- 2. Miltenyi S., Muller W., Weichel W., and Radbruch A., “ High-gradient magnetic cell-separation with Macs,” Cytometry 11, 231–238 (1990). 10.1002/cyto.990110203 [DOI] [PubMed] [Google Scholar]
- 3. Amos P. J., Cagavi Bozkulak E., and Qyang Y., “ Methods of cell purification: A critical juncture for laboratory research and translational science,” Cells Tissues Organs 195, 26–40 (2012). 10.1159/000331390 [DOI] [PMC free article] [PubMed] [Google Scholar]
- 4. Coakley W. T., Bardsley D. W., Grundy M. A., Zamani F., and Clarke D. J., “ Cell manipulation in ultrasonic standing wave fields,” J. Chem. Technol. Biot 44, 43–62 (1989). 10.1002/jctb.280440106 [DOI] [Google Scholar]
- 5. Coakley W. T., “ Ultrasonic separations in analytical biotechnology,” Trends Biotechnol. 15, 506–511 (1997). 10.1016/S0167-7799(97)01122-0 [DOI] [PubMed] [Google Scholar]
- 6. Hawkes J. J. and Coakley W. T., “ Force field particle filter, combining ultrasound standing waves and laminar flow,” Sens. Actuators, B 75, 213–222 (2001). 10.1016/S0925-4005(01)00553-6 [DOI] [Google Scholar]
- 7. Petersson F., Nilsson A., Holm C., Jonsson H., and Laurell T., “ Separation of lipids from blood utilizing ultrasonic standing waves in microfluidic channels,” Analyst 129, 938–943 (2004). 10.1039/B409139F [DOI] [PubMed] [Google Scholar]
- 8. Laurell T., Petersson F., and Nilsson A., “ Chip integrated strategies for acoustic separation and manipulation of cells and particles,” Chem. Soc. Rev. 36, 492–506 (2007). 10.1039/B601326K [DOI] [PubMed] [Google Scholar]
- 9. Antfolk M., Magnusson C., Augustsson P., Lija H., and Laurell T., “ Acoustofluidic, label-free separation and simultaneous concentration of rare tumor cells from white blood cells,” Anal. Chem. 87, 9322–9328 (2015). 10.1021/acs.analchem.5b02023 [DOI] [PubMed] [Google Scholar]
- 10. Goddard G. and Kaduchak G., “ Ultrasonic particle concentration in a line-driven cylindrical tube,” J. Acoust. Soc. Am. 117, 3440–3447 (2005). 10.1121/1.1904405 [DOI] [PubMed] [Google Scholar]
- 11. Goddard G., Martin J. C., Graves S. W., and Kaduchak G., “ Ultrasonic particle-concentration for sheathless focusing of particles for analysis in a flow cytometer,” Cytometry, Part A 69a, 66–74 (2006). 10.1002/cyto.a.20205 [DOI] [PubMed] [Google Scholar]
- 12. Kaduchak G. and Ward M. D., “ Application of acoustic radiation pressure to align cells in a commercial flow cytometer,” Proc. Mtgs. Acoust. 19, 045014 (2013). 10.1121/1.4799425 [DOI] [Google Scholar]
- 13. King L. V., “ On the acoustic radiation pressure on spheres,” Proc. R. Soc. London, Ser. A 147, 212–240 (1934). 10.1098/rspa.1934.0215 [DOI] [Google Scholar]
- 14. Segers T. and Versluis M., “ Acoustic bubble sorting for ultrasound contrast agent enrichment,” Lab Chip 14, 1705–1714 (2014). 10.1039/C3LC51296G [DOI] [PubMed] [Google Scholar]
- 15. Hsu C. H., Chen C. C., Irimia D., and Toner M., “ Isolating cells from blood using buoyancy activated cell sorting (BACS) with glass microbubbles,” in 14th International Conference on Miniaturized Systems for Chemistry and Life Sciences, edited by Verpoorte S. ( Chemical and Biological Microsystems Society Groningen, The Netherlands, 2010). [Google Scholar]
- 16. Faridi M. A., Ramachandraiah H., Iranmanesh I., Grishenkov D., Wiklund M., and Russom A., “ MicroBubble activated acoustic cell sorting,” Biomed. Microdevices 19, 23–30 (2017). 10.1007/s10544-017-0157-4 [DOI] [PMC free article] [PubMed] [Google Scholar]
- 17. Gor'kov L. P., “ On the forces acting on a small particle in an acoustical field in an ideal fluid,” Sov. Phys. Dokl. 6, 773–775 (1962). [Google Scholar]
- 18. Hartono D., Liu Y., Tan P. L., Then X. Y. S., Yung L. Y. L., and Lim K. M., “ On-chip measurements of cell compressibility via acoustic radiation,” Lab Chip 11, 4072–4080 (2011). 10.1039/c1lc20687g [DOI] [PubMed] [Google Scholar]
- 19. Leighton T. G., The Acoustic Bubble ( Academic, London, 1994). [Google Scholar]
- 20. Doinikov A., “ Bjerknes forces and translational bubble dynamics,” in Bubble and Particle Dynamics in Acoustic Fields: Modern Trends and Applications, edited by Doinikov A. ( Research Signpost, Kerala, India, 2005), pp. 1–49. [Google Scholar]
- 21. Church C. C., “ The effects of an elastic solid-surface layer on the radial pulsations of gas-bubbles,” J. Acoust. Soc. Am. 97, 1510–1521 (1995). 10.1121/1.412091 [DOI] [Google Scholar]
- 22. Hoff L., Sontum P. C., and Hovem J. M., “ Oscillations of polymeric microbubbles: Effect of the encapsulating shell,” J. Acoust. Soc. Am. 107, 2272–2280 (2000). 10.1121/1.428557 [DOI] [PubMed] [Google Scholar]
- 23. Chatterjee D. and Sarkar K., “ A Newtonian rheological model for the interface of microbubble contrast agents,” Ultrasound Med. Biol. 29, 1749–1757 (2003). 10.1016/S0301-5629(03)01051-2 [DOI] [PubMed] [Google Scholar]
- 24. Marmottant P., van der Meer S., Emmer M., Versluis M., de Jong N., Hilgenfeldt S., and Lohse D., “ A model for large amplitude oscillations of coated bubbles accounting for buckling and rupture,” J. Acoust. Soc. Am. 118, 3499–3505 (2005). 10.1121/1.2109427 [DOI] [Google Scholar]
- 25. Landau L. D. and Lifshitz E. M., Fluid Mechanics, 2nd ed.: Volume 6 (Course of Theoretical Physics) ( Pergamon Press, Oxford, 1987). [Google Scholar]
- 26. Reddy A. J. and Szeri A. J., “ Coupled dynamics of translation and collapse of acoustically driven microbubbles,” J. Acoust. Soc, Am. 112, 1346–1352 (2002). 10.1121/1.1502899 [DOI] [PubMed] [Google Scholar]
- 27. Matula T. J., “ Bubble levitation and translation under single-bubble sonoluminescence conditions,” J. Acoust. Soc. Am. 114, 775–781 (2003). 10.1121/1.1589753 [DOI] [PubMed] [Google Scholar]
- 28. Kobelev Y. A. and Ostrovskii L. A., “ Acoustic electrostatic analogy and the interaction of gas-bubbles in a liquid,” Sov. Phys. Acoust. 30, 427–428 (1984). [Google Scholar]
- 29. Emelianov S. Y., Hamilton M. F., Ilinskii Y. A., and Zabolotskaya E. A., “ Nonlinear dynamics of a gas bubble in an incompressible elastic medium,” J. Acoust. Soc. Am. 115, 581–588 (2004). 10.1121/1.1621858 [DOI] [PubMed] [Google Scholar]
- 30. Guz N., Dokukin M., Kalaparthi V., and Sokolov I., “ If cell mechanics can be described by elastic modulus: Study of different models and probes used in indentation experiments,” Biophys. J. 107, 564–575 (2014). 10.1016/j.bpj.2014.06.033 [DOI] [PMC free article] [PubMed] [Google Scholar]
- 31. Kobelev Y. A. and Ostrovsky L. A., “ Nonlinear acoustic phenomena due to bubble drift in a gas−liquid mixture,” J. Acoust. Soc. Am. 85, 621–629 (1989). 10.1121/1.397586 [DOI] [Google Scholar]
- 32. Beguin C., Pelletier E., and Etienne S., “ Void fraction influence on added mass in a bubbly flow,” Eur. J. Mech. B-Fluid 56, 28–45 (2016). 10.1016/j.euromechflu.2015.11.008 [DOI] [Google Scholar]
- 33. Crum L. A., “ Bjerknes forces on bubbles in a stationary sound field,” J. Acoust. Soc. Am. 57, 1363–1370 (1975). 10.1121/1.380614 [DOI] [Google Scholar]
- 34. van der Meer S. M., Dollet B., Voormolen M. M., Chin C. T., Bouakaz A., de Jong N., Versluis M., and Lohse D., “ Microbubble spectroscopy of ultrasound contrast agents,” J. Acoust. Soc. Am. 121, 648–656 (2007). 10.1121/1.2390673 [DOI] [PubMed] [Google Scholar]
- 35. Lamb H., Hydrodynamics ( Dover, New York, 1945). [Google Scholar]
- 36. Rychak J. (personal communication, 2017).
- 37. Shillaber C. P., Photomicrography in Theory and Practice ( Wiley, Chapman & Hall, New York, 1944). [Google Scholar]


