

Abstract
• PURPOSE:
To estimate the prevalence of vision impairment and blindness in 2014 among older adults in rural China with comparisons with the 2006 Nine-Province Survey.
• DESIGN:
Population-based, cross-sectional study.
• METHODS:
Geographical cluster sampling was used in randomly selecting residents from a rural county or semi-rural district within 9 provinces: Beijing, Jiangsu, Guangdong, Heilongjiang, Jiangxi, Hebei, Ningxia, Chongqing, and Yunnan. Persons 50 years of age or older were enumerated through household visits and invited to examination sites for visual acuity testing and examination. Vision impairment and blindness in 2014 was compared with data from the 2006 survey.
• RESULTS:
Among 51 310 examined persons, the prevalence of presenting vision impairment (<20/63 to ≥20/400) in the better-seeing eye ranged from 6.05% to 15.3% across the 9 study sites, with presenting blindness (<20/400) ranging from 0.66% to 5.35%. With best-corrected visual acuity, the prevalence of vision impairment ranged from 1.96% to 8.74%, and blindness from 0.47% to 5.01%. Vision impairment was associated with older age, female sex, and little or no education. The overall prevalence of presenting vision impairment and blindness decreased during the 2006–2014 interval by 6.31% and 29.0%, respectively; and by 16.1% and 38.0%, respectively, after standardization of 2006 prevalence rates to the 2014 population.
• CONCLUSIONS:
Substantial progress has been made in the reduction of vision impairment in rural China. Nevertheless, vision impairment remains an important public health problem with substantial geographic disparities and with older age, female sex, and illiteracy as risk factors.
With 1.36 Billion People in China, and an aging population, age-related eye diseases are expected to increase. In response, the Chinese government has initiated several coordinated efforts in addressing vision impairment and blindness: 5-year plans for prevention of blindness and eye health—the most recent of which is the fourth plan, covering the 2016–2020 period; Universal Medical Insurance, launched in 2003 with joint funding by central and local governments, improved affordability of eye care in rural areas, and achieved 95% coverage of the Chinese population in 2012; the “One Million Cataract Blindness Project,” with 1.65 million cataract surgeries performed over the 5-year period from 2009 through 2013; the SightFirst China Action Program initiated jointly with Lions Club International in 1997—the first and second phases (1997–2007) of the program focused on increasing cataract surgery rates and the third phase (2010–2015) focused on the elimination of blinding trachoma. Nongovernmental organizations, such as ORBIS International, the Fred Hollows Foundation, and the Chinese Ophthalmologic Society, have also been active in cataract surgery projects in rural areas, with the number of cataract surgeries performed by the private sector increasing to the extent that it is now comparable to that in the public sector (unpublished data, National Cataract Surgery Registry Network).
A number of population-based surveys on the prevalence and causes of vision impairment and blindness have been conducted, beginning with a national survey in 1987.1 In the mid-1990s localized surveys were carried out in urban and rural areas, including Shunyi district in the Beijing municipality,2 Doumen county in southern Guangdong province,3 Haidian and Daxing districts in the Beijing municipality,4 Kunming in Yunnan province,5 and Yongnian county in Heibei province.6 In addressing the need for updated, comparative data among the rural populations of China, the Ministry of Health commissioned a ‘‘China Nine-Province Survey’’ in 2006.7,8 This survey was carried out in 9 rural areas within the 4 municipalities, 22 provinces, and 5 autonomous regions of mainland China: 1 municipality (Beijing) and 2 provinces (Jiangsu and Guangdong) in the East Coast region; 3 provinces (Heilongjiang, Jiangxi, and Hebei) in the inland Middle region; and 1 autonomous region (Xinjiang), 1 municipality (Chongqing), and 1 province (Yunnan) in the West region.
Subsequent to the 2006 Nine-Province Survey, additional local surveys were carried out in the provinces of Guangdong,9,10 Heilongjiang,11,12 Sichuan,13 Jiangxi,14 Yunnan,15 Hainan,16 and Jiangsu.17,18 Although these more recent studies provided useful information on the magnitude and burden of vision impairment and blindness in localized areas, they did not offer an adequate basis for representative estimates regarding the prevalence of vision impairment and blindness among adult populations across rural China. With continuing urbanization and lifestyle changes, along with increasingly modern medical care, there was recognition within the Chinese government of the need for an updated assessment of vision impairment and blindness among rural adult populations in China. Accordingly, a new Nine-Province Survey was launched in 2014 by the National Health and Family Planning Commission, with administrative oversight by the National Institute of Hospital Administration and technical expertise provided by Peking University Medical College (PUMC) Hospital. To facilitate the assessment of changes in the prevalence of vision impairment and blindness since the 2006 survey, the 2014 survey was to be carried out in the same counties and districts as the earlier survey, and with the same study methods. However, because of the social situation in Xinjiang, successful implementation of the 2014 survey could not be guaranteed, and it was replaced with the Ning-xia Hui autonomous region.
Here we present results of the repeat China Nine-Province Survey conducted in 8 of the 9 original provinces in 2014 with comparisons of data from the earlier 2006 survey.
METHODS
The study design was a population-based cross sectional study of the prevalence of vision impairment and blindness in previously studied rural sites using the same study protocol. Human subject research approval of the original study protocol and the scripted consent form for obtaining written informed consent was cleared by the World Health Organization Secretariat Committee on Research Involving Human Subjects. The PUMC Hospital Committee on Ethics in Research approved implementation of the current study.
A rural county or semi-rural district within each of 9 provinces/municipalities/autonomous regions was identified for the 2006 China Nine-Province Survey in collaboration with local academic personnel interested in prevention of blindness efforts and community health authorities. The selected sites were geographically accessible and considered socioeconomically representative of rural eye care, and with a local community willing to actively participate in the survey. Shunyi district was chosen in Beijing municipality, Qidong county in Jiangsu province, Yangxi county in Guangdong province, Shuangcheng county in Heilongjiang province, Jian county in Jiangxi province, Longrao county in Hebei province, Changji county in Xinjiang Uygar autonomous region, Yongchuan district in Chongqing municipality, and Luxi county in Yunnan province.
The Xinjiang study site was replaced in 2014 by Tongxin county in Ningxia Hui autonomous region. Ningxia, with similar Muslim and other ethnic minorities, is located in the northwest and upstream area of the Yellow River. The geographic locations of the 9 study sites in 2014 are shown in Figure 1. A Supplemental Table (Supplemental Material available at AJO.com) provides summary demographic and socioeconomic information for the study sites.
FIGURE 1.

Study sites in the 2014 China Nine-Province Survey: Shunyi district in Beijing municipality (BJ); Qidong county in Jiangsu province (JS); Yangxi county in Guangdong province (GD); Shuangcheng county in Heilongjiang province (HL); Jian county in Jiangxi province (JX); Longrao county in Hebei province (HB); Tongxin county in Ningxia Hui autonomous region (NX); Yongchuan district in Chongqing municipality (CQ); and Luxi county in Yunnan province (YN). The geographic location of the study site within each province is indicated by a star symbol.
The protocol for the 2014 Nine-Province Survey was adapted from that used in the previous 2006 survey using essentially the same survey and examination methods summarized below.7,8,19
The survey was carried out in a randomly selected sample of individuals from each study site, excluding the central commercial area within each county/district. Geographically defined clusters from the 2006 survey were used as the study sampling frame. (Cluster boundaries were defined such that each cluster would have a population of approximately 1000 individuals of all ages.) The study clusters for the 2014 survey were randomly selected from this previously created sampling frame, except in Beijing, Jiangxi, and Yunnan, where the clusters selected for the 2006 survey were resurveyed with an intent to estimate the incidence of blindness and vision impairment.
Sample size was based on estimating an anticipated 3.65% prevalence for vision impairment less than 20/200 in the better-seeing eye (based on results from the 2006 survey) within an error bound of 20% with 95% confidence, along with assuming an examination response rate of 85% and a design effect of 1.5 to account for inefficiencies associated with the cluster sampling design. Selecting 2025 clusters generally fulfilled the sample size requirement for each site.
Fieldwork was carried out over a 6-month period, beginning in November 2014. Listings of households within each study cluster with the names of residents 50 years of age or older were obtained from village registers, followed by door-to-door visits conducted by enumeration teams. Residents were enumerated by name, sex, age, education (using graduation levels), and spectacle usage. Individuals temporarily absent at the time of the household visit were included in the enumeration. Unregistered adults 50 years of age or older were enumerated and included in the study sample if they had been living in the household for at least 6 months.
Study participants were examined at local community facilities according to a prescheduled date established at the time of enumeration. Those who did not appear at the examination site were revisited, repeatedly if necessary, by a member of the enumeration team to encourage participation. Examination teams were encouraged to achieve 90% participation within each cluster. The physically disabled and those failing to come to the examination site after repeated contact were offered an ocular examination using portable equipment in their home, scheduled toward the end of the fieldwork period. Presenting distance visual acuity (PVA) was measured using a retroilluminated logMAR tumbling E chart (Precision Vision, Villa Park, Illinois, USA) at a 4-meter distance, and at 1 meter for those failing to read the top line (20/200). Visual acuity was recorded as the smallest line read with 1 or no errors. Testing for counting fingers, hand movement, or light perception was performed on those unable to read the top line at 1 meter. Each eye was tested separately, with glasses if worn for distance correction. Participants presenting with PVA 20/40 or worse in either eye were refracted with subjective refraction to achieve best-corrected visual acuity (BCVA). For those in whom subjective refraction was not possible (particularly the elderly or those examined in their home), BCVA was assumed to be the same as PVA if pinhole vision combined with examination findings indicated a principal cause of impairment other than refractive error, including “undetermined cause.” Refractive error was assigned as the cause if pinhole visual acuity was 20/32 or better.
Ophthalmic examination of the eyelid, globe, pupillary reflex, and lens was carried out by a study ophthalmologist. Pupils of eyes with BCVA 20/40 or worse were dilated for direct ophthalmoscopy and slit-lamp examination, followed by fundus photography. Examination findings were documented using a detailed and standardized format. Fundus images were sent to a reading center at PUMC Hospital, where they were assessed for the presence and severity of retinal abnormalities. Intraocular pressure measurement by applanation tonometry was performed on an optional basis, primarily for glaucoma suspects with optic disc abnormalities.
A principal cause of blindness or vision impairment for eyes with PVA 20/40 or worse was determined by the examining ophthalmologist using a 14-item list: refractive error, amblyopia, cataract, posterior capsule opacification, corneal opacity or scar, phthisical or disorganized or absent globe, glaucoma, other optic atrophy, macular degeneration (age-related, myopic, or other), diabetic retinopathy, retinal detachment, other retinal or choroidal changes, other cause, undetermined cause. When multiple causes appeared to be involved, the examiner favored the most treatable cause. Refractive error was assigned as the cause for eyes with PVA 20/40 or worse that improved to 20/32 or better with refractive correction, or with pinhole vision when subjective refraction was not possible because of age or disability.
Participants with PVA 20/40 or worse in the better-seeing eye correctable with refraction were provided with a prescription for spectacles. Treatment for minor ophthalmic problems was provided, free of charge, at the time of examination. Those with PVA worse than 20/200 because of cataract were referred for surgery. Others requiring further management were given an explanation of the problem and referred to the hospital/clinic nearest their home.
A listing of the 2014 study team members for each site is provided in a Supplemental Appendix (Supplemental Material available at AJO.com).
• DATA MANAGEMENT AND ANALYSIS:
Computerized data entry was carried out at each study site using standardized programs. Original data forms and files were transferred to the data management and analysis center at the PUMC Hospital, where measurement data ranges, frequency distributions, and consistency among related measurements were checked with data-cleaning programs.
Visual acuity was categorized as follows: normal vision, ≥20/32; mild vision impairment, 20/40 to 20/63; vision impairment (moderate or severe), <20/63 to 20/400; and blindness, <20/400. Age- and sex-specific prevalence rates of vision impairment and blindness were calculated using PVA and BCVA in the better-seeing eye. Multiple logistic regression was used to investigate the association of age, sex, and education with presenting and best-corrected vision impairment and blindness.
The prevalence of vision impairment and blindness in 2014 was compared to that in 2006 using actual crude rates, along with 2006 prevalence rates age- and sex-standardized to the 2014 population. Changes in the prevalence of vision impairment and blindness during the 2006–2014 interval were expressed as a percentage of the 2006 prevalence rate. The association of survey year with vision impairment and blindness within each site was also investigated with multiple logistic regression modeling using combined 2006 and 2014 data and with survey year included as a covariate.
Statistical analyses were performed using Stata/SE Data Analysis and Statistical Software: Release 12.0 (StataCorp, College Station, Texas, USA). Confidence intervals (CI) and P values (significant at the P ≤ .05 level) for prevalence rates and multiple logistic regression odds ratios were calculated with adjustment for clustering effects associated with the sampling design.
RESULTS
• 2014 STUDY DATA:
The enumerated 2014 study population of 56 630 persons aged 50 years or older with distribution across age, sex, and education level within each study site is shown in Table 1.
TABLE 1.
Distribution of the Study Population in the 2014 Study Sites by Sex, Age Category, and Education Level
| Sex | Age (y) | Education Level | |||||||||
|---|---|---|---|---|---|---|---|---|---|---|---|
| Site | Male | Female | 50–59 | 60–69 | 70–79 | 80+ | None | Less Than Primary | Primary | Secondary or More | All |
| Beijing | |||||||||||
| Enumerated | 2653 (44.4) | 3321 (55.6) | 2451 (41.0) | 2188 (36.6) | 1003 (16.8) | 332 (5.56) | 136 (2.28) | 98 (1.64) | 1459 (24.4) | 4281 (71.7) | 5974 (100.0) |
| Examined | 2317 (43.6) | 2993 (56.4) | 2240 (42.2) | 2022 (38.1) | 854 (16.1) | 194 (3.65) | 87 (1.64) | 74 (1.39) | 1252 (23.6) | 3897 (73.4) | 5310 (100.0) |
| % Examined | 87.3 | 90.1 | 91.4 | 92.4 | 85.1 | 58.4 | 64.0 | 75.5 | 85.8 | 91.0 | 88.9 |
| Jiangsu | |||||||||||
| Enumerated | 2255 (36.1) | 3996 (63.9) | 1740 (27.8) | 2348 (37.6) | 1606 (25.7) | 557 (8.91) | 700 (11.2) | 1727 (27.6) | 2005 (32.1) | 1819 (29.1) | 6251 (100.0) |
| Examined | 1977 (34.0) | 3846 (66.0) | 1541 (26.5) | 2205 (37.9) | 1545 (26.5) | 532 (9.14) | 671 (11.5) | 1643 (28.2) | 1879 (32.3) | 1630 (28.0) | 5823 (100.0) |
| % Examined | 87.7 | 96.3 | 88.6 | 93.9 | 96.2 | 95.5 | 95.9 | 95.1 | 93.7 | 89.6 | 93.2 |
| Guangdong | |||||||||||
| Enumerated | 3174 (49.4) | 3251 (50.6) | 1961 (30.5) | 2055 (31.2) | 1495 (23.3) | 914 (14.2) | 3010 (46.9) | 2056 (32.0) | 721 (11.2) | 638 (9.93) | 6425 (100.0) |
| Examined | 2772 (49.2) | 2866 (50.8) | 1726 (30.6) | 1896 (33.6) | 1309 (23.2) | 707 (12.5) | 2707 (48.0) | 1918 (34.0) | 487 (8.64) | 526 (9.33) | 5638 (100.0) |
| % Examined | 87.3 | 88.2 | 88.0 | 92.3 | 87.6 | 77.4 | 89.9 | 93.3 | 67.6 | 82.5 | 87.8 |
| Heilongjiang | |||||||||||
| Enumerated | 2597 (41.5) | 3660 (58.5) | 2751 (44.0) | 2528 (40.4) | 826 (13.2) | 152 (2.43) | 489 (7.82) | 817 (13.1) | 3845 (61.5) | 1106 (17.7) | 6257 (100.0) |
| Examined | 2076 (38.6) | 3305 (61.4) | 2326 (43.2) | 2222 (41.3) | 720 (13.4) | 113 (2.10) | 417 (7.75) | 659 (12.3) | 3365 (62.5) | 940 (17.5) | 5381 (100.0) |
| % Examined | 79.9 | 90.3 | 84.6 | 87.9 | 87.2 | 74.3 | 85.3 | 80.7 | 87.5 | 85.0 | 86.0 |
| Jiangxi | |||||||||||
| Enumerated | 2508 (41.5) | 3534 (58.5) | 1886 (31.2) | 2396 (39.7) | 1322 (21.9) | 438 (7.25) | 1838 (30.4) | 1585 (26.2) | 1914 (31.7) | 705 (11.7) | 6042 (100.0) |
| Examined | 2170 (39.4) | 3341 (60.6) | 1578 (28.6) | 2264 (41.1) | 1259 (22.9) | 410 (7.44) | 1735 (31.5) | 1474 (26.8) | 1703 (30.9) | 599 (10.9) | 5511 (100.0) |
| % Examined | 86.5 | 94.5 | 83.7 | 94.5 | 95.2 | 93.6 | 94.4 | 93.0 | 89.0 | 85.0 | 91.2 |
| Hebei | |||||||||||
| Enumerated | 3173 (45.4) | 3818 (54.6) | 2729 (39.0) | 2817 (40.3) | 1140 (16.3) | 305 (4.36) | 2636 (37.3) | 585 (8.37) | 1730 (24.8) | 2040 (29.2) | 6991 (100.0) |
| Examined | 2681 (42.7) | 3601 (57.3) | 2447 (39.0) | 2571 (40.9) | 1013 (16.1) | 251 (4.00) | 2427 (38.6) | 536 (8.53) | 1524 (24.3) | 1795 (28.6) | 6282 (100.0) |
| % Examined | 84.5 | 94.3 | 89.7 | 91.27 | 88.9 | 82.3 | 92.1 | 91.6 | 88.1 | 88.0 | 89.9 |
| Ningxia | |||||||||||
| Enumerated | 2737 (49.8) | 2757 (50.2) | 2302 (41.9) | 2020 (36.8) | 997 (18.2) | 175 (3.19) | 3831 (69.7) | 234 (4.26) | 704 (12.8) | 725 (13.2) | 5494 (100.0) |
| Examined | 2491 (50.0) | 2491 (50.0) | 2136 (42.9) | 1876 (37.7) | 846 (17.0) | 124 (2.49) | 3350 (67.2) | 226 (4.54) | 692 (13.9) | 714 (14.3) | 4982 (100.0) |
| % Examined | 91.0 | 90.4 | 92.8 | 92.9 | 84.9 | 70.9 | 87.4 | 96.6 | 98.3 | 98.5 | 90.7 |
| Chongqing | |||||||||||
| Enumerated | 3547 (49.3) | 3650 (50.7) | 2483 (34.5) | 2695 (37.5) | 1490 (20.7) | 529 (7.35) | 2048 (28.5) | 2473 (34.4) | 1373 (19.1) | 1303 (18.1) | 7197 (100.0) |
| Examined | 3360 (49.5) | 3431 (50.5) | 2298 (33.8) | 2550 (37.6) | 1441 (21.1) | 502 (7.39) | 1942 (28.6) | 2330 (34.3) | 1294 (19.1) | 1225 (18.0) | 6791 (100.0) |
| % Examined | 94.7 | 94.0 | 92.6 | 94.6 | 96.7 | 94.9 | 94.8 | 94.2 | 94.3 | 94.0 | 94.4 |
| Yunnan | |||||||||||
| Enumerated | 2599 (43.3) | 3400 (56.7) | 2155 (35.9) | 1905 (31.8) | 1291 (21.5) | 648 (10.8) | 4336 (72.3) | 1040 (17.3) | 449 (7.48) | 174 (2.90) | 5999 (100.0) |
| Examined | 2401 (42.9) | 3191 (57.1) | 1932 (34.6) | 1829 (32.7) | 1231 (22.0) | 600 (10.7) | 4087 (73.1) | 978 (17.5) | 390 (6.97) | 137 (2.45) | 5592 (100.0) |
| % Examined | 92.4 | 93.9 | 89.7 | 96.0 | 95.4 | 92.6 | 94.3 | 94.0 | 86.9 | 78.7 | 93.2 |
The study population was enumerated through door-to-door household visits and examined in community facilities. Data are given as the number (percentage) of enumerated and examined participants and the percent examined within each study site.
Overall, 90.6% (51 310) of the enumerated population was examined, including measurement of visual acuity. As shown, the examination response rate ranged from 86.0% in Heilongjiang to 94.4% in Chongqing. In multiple logistic regression modeling with age, sex, education, and study site as covariates, higher examination rates were associated with older age (except for those in the 80 years or greater age category) and female sex. Compared to those with no education (the regression reference), education level was not significant except for a lower response rate among those with education at the primary level. The relatively high examination response rates in Jiangsu, Chongqing, and Yunnan, along with the relatively low response rate in Heilongjiang, were statistically significant when compared to Beijing (the regression reference).
The examined population had an overall mean age of 64.0 years, ranging from 61.7 years in Heilongjiang to 66.2 years in Jiangsu; 43.4% were male, ranging from 34.0% in Jiangsu to 50.0% in Ningxia. One-third of those examined were without any education, ranging from 1.64% in Beijing to 73.1% in Yunnan, while education at the secondary level or higher was 22.3%, ranging from 2.45% in Yunnan to 73.4% in Beijing.
Table 2 shows the distribution of presenting and bestcorrected visual acuity by sex and age group within each study site. The overall prevalence of presenting vision impairment (<20/63 to ≥20/400) was 10.3% (95% CI: 9.88%–10.7%), ranging from 6.05% (95% CI: 5.35%–6.747%) in Beijing to 14.7% (95% CI: 13.2%–16.2%) in Yunnan. Presenting blindness (<20/400) was 1.66% (95% CI: 1.50%–1.83%) overall, ranging from 0.66% (95% CI: 0.48%–0.84%) in Beijing to 5.35% (95% CI: 4.49%–6.20%) in Yunnan. With BCVA, the prevalence of vision impairment was 4.45% (95% CI: 4.18%–4.72%) overall, ranging from 1.96% (95% CI: 1.44%–2.48%) in Beijing to 8.74% (95% CI: 7.67%–9.81%) in Yunnan. Blindness with best correction was 1.40% (95% CI: 1.25%–1.55%) overall, ranging from 0.47% (95% CI: 0.28%–0.67%) in Beijing to 5.01% (95% CI: 4.21%–5.81%) in Yunnan.
TABLE 2.
Prevalence of Mild Vision Impairment (20/40 to 20/63), Moderate or Severe Vision Impairment (<20/63 to 20/400), and Blindness (<20/400) in the Better-seeing Eye Within Sex and Age Categories in the 2014 Study Sites
| Sex | Age (y) | ||||||
|---|---|---|---|---|---|---|---|
| Study Site | Male | Female | 50–59 | 60–69 | 70–79 | 80+ | Alla |
| Beijing | |||||||
| 20/40 to 20/63 | 19.8; 5.96 | 23.0; 7.32 | 13.0; 1.47 | 21.4; 4.90 | 37.5; 16.0 | 52.6; 45.4 | 21.6 (20.0, 23.2); 6.72 (5.89, 7.56) |
| <20/63 to 20/400 | 5.27; 1.64 | 6.65; 2.21 | 2.95; 0.49 | 4.10; 0.99 | 13.5; 5.85 | 29.4; 11.9 | 6.05 (5.35, 6.74); 1.96 (1.44, 2.48) |
| <20/400 | 0.78; 0.69 | 0.57; 0.30 | 0.27; 0.27 | 0.45; 0.30 | 1.64; 1.05 | 3.09; 2.06 | 0.66 (0.48, 0.84); 0.47 (0.28, 0.67) |
| Jiangsu | |||||||
| 20/40 to 20/63 | 19.8; 11.8 | 23.2; 12.9 | 8.96; 2.14 | 17.1; 6.17 | 35.7; 22.5 | 41.0; 40.1 | 22.1 (19.6, 24.5); 12.5 (10.8, 14.2) |
| <20/63 to 20/400 | 9.71; 5.92 | 10.1; 5.33 | 3.63; 1.69 | 5.40; 2.13 | 14.2; 7.77 | 34.6; 24.3 | 9.94 (8.78, 11.1); 5.53 (4.82, 5.85) |
| <20/400 | 1.72;1.62 | 1.04; 0.94 | 0.19; 0.13 | 0.63; 0.59 | 1.75; 1.49 | 5.64; 5.65 | 1.27 (0.90, 1.64); 1.17 (0.83, 1.51) |
| Guangdong | |||||||
| 20/40 to 20/63 | 26.9; 16.4 | 28.5; 18.7 | 13.4; 2.09 | 25.0; 9.36 | 42.9; 33.5 | 41.6; 48.7 | 27.7 (26.0, 29.4); 17.6 (16.2, 19.0) |
| <20/63 to 20/400 | 11.8; 3.59 | 16.7; 6.53 | 3.24; 0.93 | 9.44; 1.69 | 24.3; 7.55 | 43.4; 20.1 | 15.3 (14.3, 16.2); 5.08 (4.32, 5.85) |
| <20/400 | 1.15; 0.94 | 2.34; 1.69 | 0.58; 0.29 | 1.00; 0.79 | 2.22; 1.54 | 5.80; 4.91 | 1.76 (1.26, 2.25); 1.32 (0.97, 1.67) |
| Heilongjiang | |||||||
| 20/40 to 20/63 | 15.4; 8.64 | 23.3; 12.3 | 11.6; 4.17 | 24.6; 11.3 | 32.2; 27.9 | 37.2; 35.2 | 20.3 (18.8, 21.8); 10.9 (9.58, 12.2) |
| <20/63 to 20/400 | 6.41; 3.67 | 8.80; 4.29 | 4.30; 1.38 | 6.71; 3.62 | 19.2; 11.2 | 32.7; 23.2 | 7.88 (7.00, 8.77); 4.05 (3.73, 5.27) |
| <20/400 | 1.11; 0.97 | 1.57; 1.37 | 0.47; 0.43 | 1.67; 1.36 | 2.08; 1.82 | 10.6; 11.1 | 1.39 (1.14, 1.65); 1.21 (0.98, 1.44) |
| Jiangxi | |||||||
| 20/40 to 20/63 | 15.1; 7.01 | 20.4; 12.1 | 8.49; 1.20 | 14.9; 4.42 | 31.3; 22.1 | 35.6; 39.2 | 18.3 (17.3, 19.4); 10.1 (9.48, 10.8) |
| <20/63 to 20/400 | 8.85; 3.00 | 13.4; 5.48 | 2.66; 1.01 | 5.26; 1.86 | 23.0; 8.27 | 45.9; 21.1 | 11.6 (10.5, 12.7); 4.50 (3.73, 5.27) |
| <20/400 | 0.88; 0.83 | 1.47; 1.29 | 0.57; 0.38 | 0.53; 0.49 | 2.14; 1.99 | 4.88; 4.66 | 1.23 (0.87, 1.60); 1.11 (0.79, 1.42) |
| Hebei | |||||||
| 20/40 to 20/63 | 19.7; 5.34 | 31.4; 11.1 | 14.2; 2.00 | 30.3; 6.23 | 43.6; 23.0 | 36.7; 39.8 | 26.4 (24.8, 28.0); 8.63 (7.18, 10.1) |
| <20/63 to 20/400 | 6.23; 1.68 | 9.83; 3.64 | 2.21; 0.45 | 6.07; 1.60 | 19.0; 6.42 | 47.4; 23.5 | 8.29 (7.22, 9.37); 2.80 (2.26, 3.35) |
| <20/400 | 0.56; 0.45 | 0.81; 0.58 | 0.20; 0.12 | 0.58; 0.43 | 1.48; 0.99 | 3.59; 3.59 | 0.70 (0.52, 0.88); 0.53 (0.36, 0.69) |
| Ningxia | |||||||
| 20/40 to 20/63 | 16.5; 5.06 | 18.6; 5.78 | 10.5; 1.73 | 18.0; 4.16 | 32.3; 14.7 | 33.1; 25.2 | 17.6 (16.1, 19.0); 5.42 (4.67, 6.16) |
| <20/63 to 20/400 | 8.51; 2.65 | 9.67; 3.57 | 5.85; 2.06 | 8.16; 2.29 | 16.6; 6.27 | 28.2; 12.2 | 9.09 (7.85, 10.3); 3.11 (2.49, 3.73) |
| <20/400 | 0.72; 0.52 | 1.61; 0.88 | 0.47; 0.09 | 1.33; 0.85 | 2.01; 1.42 | 4.84; 4.07 | 1.16 (0.79, 1.54); 0.70 (0.48, 0.93) |
| Chongqing | |||||||
| 20/40 to 20/63 | 19.2; 8.48 | 23.3; 11.5 | 8.27; 1.52 | 21.5; 7.18 | 35.5; 21.3 | 38.5; 31.2 | 21.2 (19.5, 23.0); 10.1 (8.40, 11.6) |
| <20/63 to 20/400 | 8.13; 3.33 | 11.7; 5.02 | 2.65; 0.96 | 7.14; 2.35 | 18.6; 7.50 | 32.3; 18.8 | 9.91 (8.07, 11.8); 4.18 (3.44, 4.93) |
| <20/400 | 1.01; 0.89 | 1.89; 1.37 | 0.35; 0.26 | 1.06; 0.59 | 1.94; 1.39 | 7.17; 7.20 | 1.46 (1.06, 1.86); 1.13 (0.80, 1.47) |
| Yunnan | |||||||
| 20/40 to 20/63 | 6.83; 6.91 | 7.65; 6.02 | 5.43; 2.43 | 8.64; 6.18 | 7.96; 10.5 | 7.83; 11.5 | 7.30 (6.50, 8.09); 6.40 (5.53, 7.28) |
| <20/63 to 20/400 | 14.9; 8.62 | 14.5; 8.84 | 5.75; 2.59 | 10.9; 4.87 | 23.5; 14.3 | 37.0; 29.0 | 14.7 (13.2, 16.2); 8.74 (7.67, 9.81) |
| <20/400 | 5.33; 4.87 | 5.36; 5.11 | 1.29; 1.14 | 2.57; 2.46 | 6.17; 5.69 | 25.2; 23.8 | 5.35 (4.49, 6.20); 5.01 (4.21, 5.81) |
| All study sites | |||||||
| 20/40 to 20/63 | 17.9; 8.44 | 22.3; 11.0 | 10.6; 2.12 | 20.5; 6.67 | 33.1; 21.5 | 34.2; 35.0 | 20.4 (19.8, 21.1); 9.88 (9.44, 10.3) |
| <20/63 to 20/400 | 9.13; 3.71 | 11.2; 5.01 | 3.68; 1.25 | 6.89; 2.34 | 19.3; 8.38 | 38.2; 21.8 | 10.3 (9.88, 10.7); 4.45 (4.18, 4.72) |
| <20/400 | 1.44; 1.28 | 1.82; 1.50 | 0.48; 0.34 | 1.05; 0.83 | 2.43; 1.98 | 9.06; 8.57 | 1.66 (1.49, 1.82); 1.40 (1.25, 1.55) |
Data are given as the prevalence, in percent, with presenting visual acuity followed by the prevalence with best-corrected visual acuity.
Prevalence (95% confidence interval) with presenting visual acuity followed by prevalence (95% confidence interval) with best-corrected visual acuity. Best-corrected visual acuity was not available in either eye for 71 of the 16 624 persons with presenting vision impairment: 2 in Jiangsu, 32 in Guangdong, 24 in Heilongjiang, 4 in Jiangxi, 4 in Hebei, 2 in Ningxia, and 3 in Chongqing.
The age-specific prevalence of presenting vision impairment and blindness within each study site is plotted in Figure 2. As shown, the prevalence of vision impairment increased dramatically with increasing age, affecting 35%–50% of those over 80 years of age.
FIGURE 2.
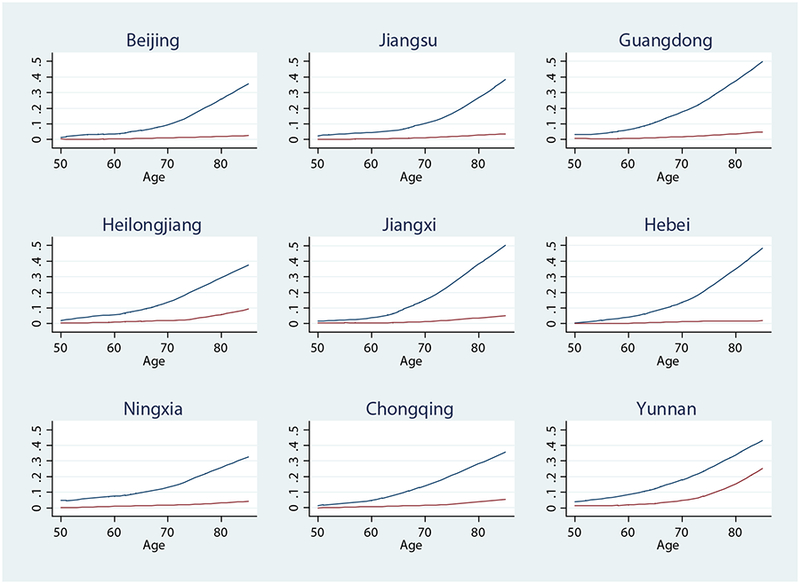
The prevalence of age-specific vision impairment and blindness in the better-seeing eye in the 2014 China Nine-Province Survey study sites. Prevalence was graphed as a function of age using local linear smoothed (Lowess) plots. Presenting vision impairment (< 20/63 to 20/400) is represented by the top curve and presenting blindness (< 20/400) by the bottom curve.
The prevalence of vision impairment and blindness with both PVA and BCVA were associated with older age overall, and within each of the 9 study sites (Table 3). Female subjects had a higher prevalence of presenting vision impairment overall and within each site, except the higher prevalence in Ningxia and Yunnan was not statistically significant. Presenting blindness in female subjects was also significantly higher overall, as well as in Guangdong, Heilongjiang, Ningxia, and Chongqing. With best correction, the prevalence of vision impairment in female subjects was higher overall and in Guangdong Heilongjiang, Jiangxi, Hebei, and Chongqing, while the prevalence of blindness in female subjects was not significant overall, but was significantly higher for female subjects in Guangdong and Heilongjiang.
TABLE 3.
Multiple Logistic Regression Odds of Vision Impairment and Blindness in the 2014 Study Sites by Sex, Age, and Education Level
| Presenting Visual Acuity | Best-Corrected Visual Acuitya | |||||
|---|---|---|---|---|---|---|
| Degree of Impairment, by Site | Female Sex | Age (y) | Education Level | Female Sex | Age (y) | Education Level |
| Beijing | ||||||
| <20/63 to 20/400 | 1.43 (1.12–1.83)** | 1.10 (1.08–1.13)** | 0.92 (0.72–1.18) | 1.58 (0.98–2.56) | 1.14 (1.12–1.17)** | 1.01 (0.78–1.32) |
| <20/400 | 0.72 (0.33–1.57) | 1.08 (1.02–1.15)* | 0.66 (0.37–1.17) | 0.43 (0.18–1.02) | 1.07 (1.00–1.14)* | 0.68 (0.40–1.16) |
| Jiangsu | ||||||
| <20/63 to 20/400 | 1.26 (1.09–1.47)** | 1.10 (1.09–1.12)** | 0.85 (0.76–0.95)** | 1.05 (0.79–1.40) | 1.12 (1.09–1.14)** | 0.77 0.66–0.90)** |
| <20/400 | 0.72 (0.40–1.29) | 1.13 (1.07–1.18)** | 0.87 (0.65–1.16) | 0.70 (0.35–1.38) | 1.14 (1.08–1.21)** | 0.90 (0.62–1.32) |
| Guangdong | ||||||
| <20/63 to 20/400 | 1.32 (1.10–1.60)** | 1.11 (1.10–1.12)** | 0.85 (0.77–0.93)** | 2.09 (1.65–2.66)** | 1.13 (1.11–1.14)** | 1.02 (0.85–1.22) |
| <20/400 | 2.07 (1.46–2.93)** | 1.09 (1.06–1.11)** | 0.88 (0.64–1.20) | 1.80 (1.23–2.63)** | 1.10 (1.07–1.13)** | 0.86 (0.65–1.14) |
| Heilongjiang | ||||||
| <20/63 to 20/400 | 1.70 (1.34–2.15)** | 1.10 (1.08–1.11)** | 0.90 (0.80–1.02) | 1.43 (1.05–1.94)* | 1.12 (1.10–1.14)** | 0.80 (0.69–0.92)** |
| <20/400 | 1.58 (1.02–2.43)* | 1.09 (1.05–1.12)** | 0.74 (0.56–0.97)* | 1.65 (1.02–2.66)* | 1.10 (1.06–1.14)** | 0.79 (0.61–1.02) |
| Jiangxi | ||||||
| <20/63 to 20/400 | 1.53 (1.20–1.94)** | 1.13 (1.12–1.15)** | 0.83 (0.73–0.94)** | 1.75 (1.07–2.86)* | 1.12 (1.10–1.15)** | 0.88 (0.74–1.06) |
| <20/400 | 1.61 (0.99–2.60) | 1.10 (1.06–1.14)** | 0.97 (0.75–1.25) | 1.45 (0.86–2.47) | 1.11 (1.07–1.15)** | 0.96 (0.73–1.25) |
| Hebei | ||||||
| <20/63 to 20/400 | 1.46 (1.12–1.92)** | 1.14 (1.12–1.15)** | 0.91 (0.81–1.03) | 1.96 (1.38–2.78)** | 1.16 (1.14–1.18)** | 0.93 (0.78–1.11) |
| <20/400 | 1.19 (0.58–2.46) | 1.10 (1.07–1.14)** | 0.89 (0.62–1.27) | 0.99 (0.41–2.39) | 1.11 (1.07–1.16)** | 0.83 (0.53–1.30) |
| Ningxia | ||||||
| <20/63 to 20/400 | 1.17 (0.93–1.48) | 1.06 (1.05–1.07)** | 0.87 (0.78–0.96)* | 1.11 (0.94–2.22) | 1.08 (1.05–1.10)** | 0.88 (0.70–1.11) |
| <20/400 | 2.22 (1.18–4.17)* | 1.09 (1.04–1.13)** | 0.73 (0.50–1.07) | 1.88 (0.79–4.47) | 1.12 (1.06–1.17)** | 0.81 (0.50–1.31) |
| Chongqing | ||||||
| <20/63 to 20/400 | 1.38 (1.11–1.71)** | 1.09 (1.08–1.10)** | 0.70 (0.60–0.81)** | 1.43 (1.05–1.95)* | 1.10 (1.09–1.11)** | 0.75 (0.61–0.92)** |
| <20/400 | 1.65 (1.07–2.53)* | 1.09 (1.07–1.12)** | 0.63 (0.48–0.82)** | 1.30 (0.83–2.04) | 1.11 (1.08–1.15)** | 0.54 (0.36–0.81)** |
| Yunnan | ||||||
| <20/63 to 20/400 | 1.03 (0.87–1.21) | 1.09 (1.07–1.10)** | 1.15 (1.00–1.32)* | 1.09 (0.86–1.40) | 1.11 (1.09–1.12)** | 1.14 (0.87–1.51) |
| <20/400 | 1.08 (0.84–1.39) | 1.14 (1.12–1.17)** | 1.49 (0.92–2.40) | 1.13 (0.84–1.51) | 1.14 (1.12–1.17)** | 1.43 (0.95–2.18) |
| All study sites | ||||||
| <20/63 to 20/400 | 1.29 (1.20–1.38)** | 1.10 (1.09–1.10)** | 0.80 (0.77–0.84)** | 1.41 (1.26–1.57)** | 1.11 (1.10–1.12)** | 0.82 (0.77–0.87)** |
| <20/400 | 1.21 (1.05–1.40)** | 1.10 (1.09–1.11)** | 0.70 (0.64–0.76)** | 1.12 (0.95–1.32) | 1.11 (1.10–1.13)** | 0.70 (0.63–0.76)** |
Data are given as odds ratios (95% confidence intervals) with age and education level as continuous variables in modeling vision impairment (<20/63–20/400) and blindness (<20/400). Statistical significance at the P ≤ .05 level is indicated by 1 asterisk (*) and significance at the P ≤ .01 level by 2 asterisks (**).
Best-corrected visual acuity was not available in either eye for 71 of the 16 624 persons with presenting vision impairment: 2 in Jiangsu, 32 in Guangdong, 24 in Heilongjiang, 4 in Jiangxi, 4 in Hebei, 2 in Ningxia, and 3 in Chongqing.
With respect to education, those with more education had a significantly lower prevalence of presenting vision impairment overall and in Jiangsu, Guangdong, Jiangxi, Ningxia, and Chongqing, but a significantly higher prevalence in Yunnan. Presenting blindness was also significantly lower overall among those with more education, as well as in Heilongjiang and Chongqing, while the higher prevalence in Yunnan was no longer statistically significant. (Cataract surgery projects targeting the illiterate poor in the Yunnan study area may account, at least in part, for this relatively lower risk of vision impairment and blindness among those with little or no education.) With best correction, the prevalence of vision impairment among those with more education was significantly lower overall and in Jiangsu, Heilongjiang, and Chongqing, while blindness was lower overall and in Chongqing.
With study site included as a risk factor in multiple logistic regression modeling, compared to Beijing (the regression reference site) the prevalence of vision impairment and blindness was significantly higher with both PVA and BCVA in Heilongjiang and Yunnan; higher in Guangdong for presenting vision impairment; and higher in Jiangsu for blindness with best correction. The prevalence of presenting and best-corrected blindness was lower in Hebei compared to Beijing, but not at statistically significant levels.
• COMPARISON OF 2006 AND 2014 SURVEY DATA:
Data on the prevalence of vision impairment and blindness for the 45 747 adults 50 years of age or older examined in the 9 2006 study sites were presented in a previous article.7 The provincial counties and municipality districts sampled in the 2014 survey were the same as those sampled in the 2006 survey, except for Changji county in Xinjiang (n = 5250), which was replaced in 2014 by Tongxin county in Ningxia (n = 4982).
The mean age of those examined in 2014 was significantly higher than in 2006 in all study sites except for Shunyi district in Beijing; and the female percentage was significantly higher in 2014 for study sites in Jiangsu, Heilongjiang, Jiangxi, Hebei, and Yunnan provinces and significantly lower in the study site in the Chongqing municipality (Table 4).
TABLE 4.
Percentage of Female Subjects and Mean Age Among Those Examined in the 2006 and 2014 Surveys
| Sex | Age (y) | |||
|---|---|---|---|---|
| % Female | P Value | Mean ± SD | P Value | |
| Beijing | ||||
| 2006 survey | 57.2 | .418 | 62.3 ± 9.21 | .580 |
| 2014 survey | 56.4 | 62.4 ± 8.18 | ||
| Jiangsu | ||||
| 2006 survey | 58.6 | <.001 | 64.0 ± 9.80 | <.001 |
| 2014 survey | 66.0 | 66.2 ± 9.27 | ||
| Guangdong | ||||
| 2006 survey | 50.1 | .446 | 64.5 ± 10.1 | <.001 |
| 2014 survey | 50.8 | 66.1 ± 10.1 | ||
| Heilongjiang | ||||
| 2006 survey | 52.8 | <.001 | 60.5 ± 8.56 | <.001 |
| 2014 survey | 61.4 | 61.7 ± 7.66 | ||
| Jiangxi | ||||
| 2006 survey | 58.2 | .012 | 62.7 ± 9.22 | <.001 |
| 2014 survey | 60.6 | 65.3 ± 8.96 | ||
| Hebei | ||||
| 2006 survey | 54.1 | .001 | 61.0 ± 8.86 | <.001 |
| 2014 survey | 57.3 | 62.9 ± 8.23 | ||
| Xinjiang/Ningxia | ||||
| 2006 survey (Xinjiang) | 51.4 | .143 | 58.6 ± 8.18 | <.001 |
| 2014 survey (Ningxia) | 50.0 | 61.9 ± 8.25 | ||
| Chongqing | ||||
| 2006 survey | 53.7 | <.001 | 62.1 ± 9.18 | <.001 |
| 2014 survey | 50.5 | 64.4 ± 9.36 | ||
| Yunnan | ||||
| 2006 survey | 51.6 | <.001 | 63.6 ± 10.1 | <.001 |
| 2014 survey | 57.1 | 65.1 ± 10.2 | ||
P values for differences in the percentage of female subjects were determined by tests on equality of proportions, and for differences in mean age by tests on equality of means.
Prevalence rates of presenting visual impairment and blindness in 2006 and 2014, along with 2006 rates age- and sex-standardized with the 2014 population, are shown in Table 5. The prevalence of presenting vision impairment decreased −6.31% overall between 2006 and 2014, with changes ranging from +44.3% in Jiangsu to −27.3% in Beijing. With standardized 2006 rates, overall vision impairment decreased −16.1%, ranging from +22.0% in Jiangsu to −32.6% in Jiangxi. Presenting blindness decreased across all study sites, ranging from −0.93% in Yunnan to −52.7% in Hebei, and from −19.1% to −57.6%, respectively, with standardized 2006 rates.
TABLE 5.
Changes in the Prevalence of Presenting Vision Impairment (<20/63 to 20/400) and Blindness (<20/400) Between the 2006 and 2014 Surveys
| Presenting Visual Acuity | |||||
|---|---|---|---|---|---|
| Prevalence (95% Confidence Interval) | Prevalence Changea | ||||
| Degree of Impairment, by Site | 2006 Survey Actual | 2006 Survey Standardizedb | 2014 Survey Actual | % Actual Change | % Standardized Change |
| Beijing | |||||
| <20/63 to 20/400 | 8.32 (6.99, 9.66) | 7.95 (7.21,8.68) | 6.05 (5.35, 6.74) | −27.3%* | −23.9%* |
| <20/400 | 1.25 (0.80, 1.70) | 1.15 (0.87, 1.42) | 0.66 (0.48, 0.84) | −47.2% | −42.6%* |
| Jiangsu | |||||
| <20/63 to 20/400 | 6.89 (6.03, 7.74) | 8.15 (7.34,8.96) | 9.94 (8.78, 11.1) | +44.3%* | +22.0% |
| <20/400 | 2.20 (1.59, 2.81) | 2.59 (2.10,3.08) | 1.27 (0.90, 1.64) | −42.3% | −51.0%* |
| Guangdong | |||||
| <20/63 to 20/400 | 18.2 (16.7, 19.6) | 19.8 (18.6, 20.9) | 15.3 (14.3, 16.2) | −15.9%* | −22.7%* |
| <20/400 | 2.68 (2.18, 3.18) | 2.79 (2.30, 3.29) | 1.76 (1.26, 2.25) | −34.3% | −36.9%* |
| Heilongjiang | |||||
| <20/63 to 20/400 | 7.23 (6.00, 8.47) | 7.95 (7.13,8.76) | 7.88 (6.99, 8.77) | +8.99% | −0.88% |
| <20/400 | 1.90 (1.44, 2.36) | 1.86 (1.46, 2.26) | 1.39 (1.14, 1.65) | −26.8% | −25.3% |
| Jiangxi | |||||
| <20/63 to 20/400 | 14.5 (13.2, 15.8) | 17.2 (16.1, 18.2) | 11.6 (10.5, 12.7) | −20.0%* | −32.6%* |
| <20/400 | 1.88 (1.67, 2.19) | 2.27 (1.82,2.71) | 1.23 (0.87, 1.60) | −34.6%* | −45.8%* |
| Hebei | |||||
| <20/63 to 20/400 | 7.94 (7.10, 8.77) | 8.89 (8.07,9.71) | 8.29 (7.22, 9.37) | +4.41% | −6.75% |
| <20/400 | 1.48 (1.09, 1.88) | 1.65 (1.26,2.04) | 0.70 (0.52, 0.88) | −52.7%* | −57.6%* |
| Chongqing | |||||
| <20/63 to 20/400 | 10.7 (9.62, 11.8) | 12.4 (11.5, 13.4) | 9.91 (8.07, 11.8) | −7.38% | −20.1% |
| <20/400 | 2.49 (1.97, 3.00) | 3.03 (2.53, 3.53) | 1.46 (1.06, 1.86) | −41.4%* | −51.8%* |
| Yunnan | |||||
| <20/63 to 20/400 | 15.8 (14.6, 17.1) | 17.2 (16.1, 18.2) | 14.7 (13.2, 16.2) | −6.96% | −14.5% |
| <20/400 | 5.40 (4.20, 6.60) | 6.61 (5.92, 7.31) | 5.35 (4.49, 6.20) | −0.93% | −19.1% |
| All study sites | |||||
| <20/63 to 20/400 | 11.1 (10.5, 11.7) | 12.4 (12.1, 12.8) | 10.4 (9.94, 10.9) | −6.31% | −16.1%* |
| <20/400 | 2.41 (2.18, 2.64) | 2.76 (2.60,2.93) | 1.71 (1.52, 1.90) | −29.0%* | −38.0%* |
Change in prevalence was calculated as a proportional percentage of the 2006 (actual) prevalence rate and as a proportional percentage of the 2006 prevalence rate after age and sex standardization to the 2014 population.
The change in prevalence was considered statistically significant at the P < .05 level, indicated by an asterisk (*), if 95% confidence intervals for the 2006 and 2014 prevalence rates did not overlap.
Prevalence in 2006 projected to an age- and sex-standardized 2014 population.
None of the prevalence changes in either presenting vision impairment or presenting blindness were statistically significant in Heilongjiang and Yunnan, nor were the changes in presenting vision impairment in Hebei and Chongqing.
Prevalence rates with best-corrected vision in 2006 and 2014, along with 2006 rates age- and sex-standardized with the 2014 population, are shown in Table 6. Vision impairment with best correction decreased −16.4% overall between 2006 and 2014, with changes ranging from +63.6% in Jiangsu to −46.2% in Guangdong. With standardized 2006 rates, best-corrected vision impairment decreased −26.0%, ranging from +35.5% in Jiangsu to −50.7% in Guangdong. Best-corrected blindness decreased −28.8% overall and in all sites except Yunnan, ranging from +1.21% in Yunnan to −56.9% in Beijing With standardized 2006 rates, best-corrected blindness decreased in all study sites, ranging from −17.7% in Yunnan to −56.9% in Chongqing. None of the prevalence changes in best-corrected vision impairment and blindness were statistically significant in Heilongjiang, nor were the changes in best-corrected vision impairment in Beijing and Hebei or best-corrected blindness in Yunnan.
TABLE 6.
Changes in the Prevalence of Best-Corrected Vision Impairment (<20/63 to 20/400) and Blindness (<20/400) Between the 2006 and 2014 Surveys
| Best-Corrected Visual Acuitya | |||||
|---|---|---|---|---|---|
| Prevalence (95% Confidence Interval) | Prevalence Changeb | ||||
| Degree of Impairment, by Site | 2006 Survey Actual | 2006 Survey Standardizedc | 2014 Survey Actual | % Change in Actual | % Change in Standardized |
| Beijing | |||||
| <20/63 to 20/400 | 3.13 (2.44, 3.81) | 2.90 (2.45, 3.36) | 1.96 (1.44, 2.48) | −37.4% | −32.4% |
| <20/400 | 1.09 (0.65, 1.54) | 1.02 (0.76, 1.27) | 0.47 (0.28, 0.67) | −56.9% | −53.9%* |
| Jiangsu | |||||
| <20/63 to 20/400 | 3.38 (2.78, 3.98) | 4.08 (3.49, 4.67) | 5.53 (4.82, 6.24) | +63.6%* | +35.5% |
| <20/400 | 1.77 (1.25, 2.29) | 2.09 (1.65,2.54) | 1.17 (0.83, 1.51) | −33.9% | −44.0%* |
| Guangdong | |||||
| <20/63 to 20/400 | 9.44 (8.46, 10.4) | 10.3 (9.42, 11.2) | 5.08 (4.32, 5.85) | −46.2%* | −50.7%* |
| <20/400 | 2.38 (1.96,2.79) | 2.52 (2.04, 2.99) | 1.32 (0.97, 1.67) | −44.5% | −47.6%* |
| Heilongjiang | |||||
| <20/63 to 20/400 | 4.70 (3.84, 5.55) | 4.95 (4.30, 5.60) | 4.05 (3.50, 4.60) | −13.8% | −18.2% |
| <20/400 | 1.72 (1.26, 2.18) | 1.66 (1.28,2.04) | 1.21 (0.98, 1.44) | −29.7% | −27.1% |
| Jiangxi | |||||
| <20/63 to 20/400 | 5.29 (4.54, 6.04) | 6.59 (5.85, 7.32) | 4.50 (3.73, 5.27) | −14.9% | −31.7%* |
| <20/400 | 1.56 (1.29, 1.82) | 1.89 (1.48,2.30) | 1.11 (0.79, 1.42) | −28.8% | −41.3%* |
| Hebei | |||||
| <20/63 to 20/400 | 3.46 (2.88, 4.05) | 3.72 (3.21, 4.24) | 2.80 (2.26, 3.35) | −19.1% | −24.7% |
| <20/400 | 1.05 (0.76, 1.34) | 1.09 (0.79, 1.39) | 0.53 (0.36, 0.69) | −49.5%* | −51.4%* |
| Chongqing | |||||
| <20/63 to 20/400 | 5.40 (4.61,6.19) | 6.44 (5.73, 7.16) | 4.18 (3.44, 4.93) | −22.6% | −35.1%* |
| <20/400 | 2.12 (1.63, 2.60) | 2.62 (2.15, 3.09) | 1.13 (0.80, 1.47) | −46.7%* | −56.9%* |
| Yunnan | |||||
| <20/63 to 20/400 | 9.51 (8.66, 10.4) | 10.8 (9.93, 11.6) | 8.74 (7.67, 9.81) | −8.10% | −19.1%* |
| <20/400 | 4.95 (3.81,6.09) | 6.09 (5.43, 6.76) | 5.01 (4.21, 5.81) | +1.21% | −17.7% |
| All study sites | |||||
| <20/63 to 20/400 | 5.49 (5.15, 5.84) | 6.20 (5.95, 6.44) | 4.59 (4.28, 4.90) | −16.4%* | −26.0%* |
| <20/400 | 2.08 (1.87,2.30) | 2.39 (2.23,2.54) | 1.48 (1.30, 1.65) | −28.8%* | −38.1%* |
The change in prevalence was calculated as a proportional percentage of the 2006 (actual) prevalence rate and as a proportional percentage of the 2006 prevalence rate after age and sex standardization to the 2014 population.
Best-corrected visual acuity was not available in either eye for 71 of the 16 624 persons examined in 2014 with presenting vision impairment: 2 in Jiangsu, 32 in Guangdong, 24 in Heilongjiang, 4 in Jiangxi, 4 in Hebei, 2 in Ningxia, and 3 in Chongqing.
The change in prevalence was considered statistically significant at the P < .05 level, indicated by an asterisk (*), if 95% confidence intervals for the 2006 and 2014 prevalence rates did not overlap.
Prevalence in 2006 projected to an age- and sex-standardized 2014 population.
Table 7 shows age- and sex-adjusted odds ratios for survey-year in multiple logistic regression modeling of vision impairment and blindness using combined 2006 and 2014 data. Overall, the odds of presenting vision impairment and blindness in 2014 was significantly lower as compared to 2006. At the site-specific level, the odds of presenting vision impairment in 2014 was significantly lower as compared to 2006 in Beijing, Guangdong, Jiangxi, Chongqing and Yunnan, but significantly higher in Jiangsu. For presenting blindness, the odds were lower in 2014 as compared to 2006 in all sites, although not at a statistically significant level in Beijing and Heilongjiang. Regression modeling with BCVA produced similar results (Table 7).
TABLE 7.
Multiple Logistic Regression Odds of Vision Impairment and Blindness in 2014 as Compared to 2006
| Presenting Visual Acuity | Best-Corrected Visual Acuity | |||
|---|---|---|---|---|
| Site | <20/63 to 20/400 | <20/400 | <20/63 to 20/400 | <20/400 |
| Beijing | 0.74 (0.58–0.95)* | 0.58 (0.34–1.01) | 0.67 (0.45–1.01) | 0.48 (0.25–0.92)* |
| Jiangsu | 1.30 (1.08–1.57)** | 0.49 (0.32–0.75)** | 1.49 (1.17–1.89)** | 0.57 (0.37–0.87)* |
| Guangdong | 0.66 (0.59–0.75)** | 0.55 (0.39–0.77)** | 0.40 (0.32–0.49)* | 0.45 (0.32–0.64)** |
| Heilongjiang | 1.03 (0.82–1.28) | 0.70 (0.51–0.96)* | 0.83 (0.65–1.05) | 0.69 (0.49–0.97)* |
| Jiangxi | 0.54 (0.48–0.60)** | 0.51 (0.35–0.75)** | 0.62 (0.52–0.74)** | 0.55 (0.37–0.80)** |
| Hebei | 0.90 (0.75–1.09) | 0.41 (0.27–0.61)** | 0.68 (0.52–0.90)** | 0.44 (0.27–0.71)** |
| Chongqing | 0.74 (0.57–0.96)* | 0.44 (0.31–0.64)** | 0.60 (0.46–0.78)** | 0.39 (0.26–0.59)** |
| Yunnan | 0.81 (0.67–0.98)* | 0.80 (0.54–1.18) | 0.77 (0.62–0.96)* | 0.81 (0.55–1.19) |
| All study sites | 0.79 (0.73–0.87)** | 0.59 (0.51–0.69)** | 0.69 (0.63–0.77)** | 0.59 (0.50–0.70)** |
Data are given as the survey year odds ratio (95% confidence interval) in modeling vision impairment (<20/63 to 20/400) and blindness (<20/400) using combined 2006 and 2014 data with sex, age, and survey year as covariates. Statistical significance at the P ≤ .05 level is indicated by 1 asterisk (*) and significance at the P ≤ .01 level by 2 asterisks (**).
It is important to note that because clusters originally selected for the 2006 survey in Beijing, Jiangxi, and Yunnan were resurveyed in 2014, some of those examined in the 2006 survey were reexamined in 2014. However, because of difficulties in accurately linking 2006 and 2014 examination records in the Jiangxi and Yunnan study sites brought about by inconsistencies in assigning participant identification numbers between the 2 survey years, assessment of changes in visual acuity at the individual level for those examined in both years was not possible. Further, this inability to determine whether those examined in the 2014 survey were also examined in the 2006 survey precluded investigation of whether longitudinal examination affected the odds of vision impairment and blindness in 2014, in comparison with those examined only in 2014. It is likely that a substantial percentage of the 2014 study participants in the resurveyed study sites were not previously examined: (1) a large number of those examined in the 2014 survey were below the age of 58 and thus were not previously examined because they were below the 50-year minimum age cutoff at the time of the 2006 survey; (2) the 8-year time interval between the 2 surveys provided ample opportunity for a reduction in the percentage of 2014 study participants with longitudinal examination because of deaths and out-migration among those examined in the 2006 survey, and because of in-migration adding to those eligible for examination in the 2014 survey but without previous examination; and (3) among those examined in the 2006 survey, not all would have accepted the reexamination invitation in the 2014 survey.
DISCUSSION
The strengths of the 2014 Nine-Province survey were a large, randomly selected, population-based sample of rural participants in 9 counties/districts throughout China; use of the same study protocol at each site; and examination response rates that exceeded 85% at each site. The random selection of the study samples enabled calculation of confidence intervals around parameter estimates, standardized measurement methods and definitions ensured that intersite data comparisons were valid, and high examination response rates minimized the effect of self-selection bias. The study sites were previously surveyed in 2006 using the same protocol and examination methods, which allowed for direct comparisons of changes in vision impairment and blindness during the 2006–2014 interval.
The prevalence of vision impairment and blindness across the 9 study sites varied considerably in 2014 with both PVA and BCVA. Excluding the unusually high blindness prevalence in Yunnan, variation between the lowest and highest rates was approximately 2- to 3-fold for both vision impairment and blindness. Although this geographic variation is reasonably consistent with variation in gross domestic product per capita as shown in the Supplemental Table, local service provider capacity and accessible eye care services within the catchment area are obviously influential. It is notable that the prevalence of presenting vision impairment and blindness across all 9 rural study sites—10.3% and 1.66%, respectively—was comparable to recent prevalence estimates for male and female subjects aged 50+ years in the East Asia region (China, Democratic People’s Republic of Korea, and Taiwan): 10.07% in male and 11.88% in female subjects for vision impairment, and 1.23% in male and 1.54% in female subjects for blindness.20
There was a significant decrease in the prevalence of presenting and best-corrected vision impairment and blindness in most study sites during the 2006–2014 interval, which was even more pronounced when the 2006 population was standardized to an older 2014 population. A notable exception was Jiangsu, with a significant increase in the prevalence of vision impairment but accompanied by a substantial decrease in blindness. After standardization with the 2014 population, the increase in vision impairment was much smaller and no longer statistically significant, while the decrease in blindness was greater and statistically significant.
The general decrease in the prevalence of vision impairment and blindness during the 2006–2014 interval was also evidenced by multiple logistic regression modeling with combined 2006 and 2014 data and including survey year as a covariate. Survey-year odds ratios, indicating a reduced risk of vision impairment and blindness during the 2006–2014 interval, were even more likely to be statistically significant than the percentage change in prevalence.
A limitation of the current study was that vision impairment was defined only on the basis of distance visual acuity, ignoring near vision impairment and visual field defects, for example. A weakness was that no attempt was made to query participants regarding accessibility and other barriers to the uptake of eye care services, particularly among those with potentially treatable vision impairment (eg, uncorrected refractive errors and cataract opacities). Such information might have helped, for example, to better understand reasons underlying the relatively high prevalence of vision impairment and blindness among the illiterate in rural Yunnan. Similarly, data regarding prevention of blindness outreach activities during or immediately before the survey could have been useful in explaining the relatively low prevalence of vision impairment in Jiangsu in 2006 compared to that in 2014. Considering the substantial geographic-based disparities that go beyond differences in the distributions of age and sex among study sites, weighted extrapolations of vision impairment prevalence rates to larger populations within China would not be particularly meaningful.
The SightFirst China Action Program, the “One Million Cataract Blindness Project,” and the monitoring of progress throughout China as part of regular 5-year Prevention of Blindness Plans are likely to have contributed to improvements in the prevalence of vision impairment and blindness. Equally important may have been rapid socioeconomic development, increased affordability of eye care under the expansion of government-funded medical insurance coverage, and the rapid growth of private-sector service providers. The Shunyi study site, with its relatively low prevalence of vision impairment and blindness, provides an example of the potential influence of urbanization: originally a rural agricultural county outside of Beijing, Shunyi is now a district within the expanding Beijing municipality with improved transportation and ready access to modern eye care services.
In summary, although substantial progress has been made in reducing vision impairment and blindness in rural areas of China, it continues to be a significant public health problem among elderly, female, and illiterate segments of the population. Further, as evidenced by the substantial decrease in the prevalence of vision impairment with best correction, outreach to high-risk populations should include refractive correction, which will become increasingly important as rural areas experience the technological development and demanding vision requirements for work and other activities common in urban settings. It is also apparent that sociodemographic risk factors alone are insufficient in accounting for substantial geographic variations in vision impairment. Additional study in a larger number of widely representative sites throughout China is needed to adequately characterize vision impairment and blindness in rural China and to better understand the numerous structural and behavioral factors underlying geographic disparities.
Supplementary Material
Acknowledgments
Funding/Support: Supported by the National Institute of Hospital Administration, National Health and Family Planning Commission, Beijing, China under contract number 1541 with ORBIS International North Asia, Beijing, China. ORBIS International did not have any role in study design, in the collection, analysis and interpretation of data, in writing the report, or in the decision to submit the article for publication. Financial Disclosures: Jialiang Zhao received research grant funding from Santen China (Shanghai, China). Leon B. Ellwein received travel support from the Chinese Medical Association (Beijing, China). Huaijin Guan received research grant funding from the National Natural Science Foundation of China (Beijing, China). Mingguang He received research grant funding from the Brien Holden Vision Institute (Sydney, Australia). Ping Liu received research grant funding from the National Natural Science Foundation of China (Beijing, China). Xunlun Sheng received research grant funding from the National Natural Science Foundation of China (Beijing, China). Peizeng Yang received research grant funding from the National Natural Science Foundation of China (Beijing, China). Xiaohu Ding received research grant funding from the Brien Holden Vision Institute (Sydney, Australia). Wenjuan Zhuang received research grant funding from the Ningxia Hui Autonomous Region Government (Yin Chung, China). The following authors have no financial disclosures: Xiao Xu, Ning Cai, Jianhua Lv, Jinglin Yi, Mei Yang, Rui Zhang, Liping Du, Fengrong Li, Hong Lu, Wenqiang Shao, Junwei Wang, Yuansheng Yuan, Rui Zhou, and Lei An.
Footnotes
Supplemental Material available at AJO.com.
REFERENCES
- 1.Zhang SY, Zou LH, Gao YQ, Di Y, Wang XD. National epidemiological survey of blindness and low vision in China. Chin MedJ (Engl) 1992;105(7):603–608. [PubMed] [Google Scholar]
- 2.Zhao J, Jia L, Sui R, Ellwein LB. Prevalence of blindness and cataract surgery in Shunyi County, China. Am J Ophthalmol 1998;126(4):506–514. [DOI] [PubMed] [Google Scholar]
- 3.Li S, Xu J, He M, et al. A survey of blindness and cataract surgery in Doumen County, China. Ophthalmology 1999;106(8): 1602–1608. [DOI] [PubMed] [Google Scholar]
- 4.Xu L, Wang Y, Li Y, et al. Causes of blindness and visual impairment in urban and rural areas in Beijing: the Beijing Eye Study. Ophthalmology 2006;113(7):1134.e1–1134.e11. [DOI] [PubMed] [Google Scholar]
- 5.Wu M, Yip JLY, Kuper H. Rapid assessment of avoidable blindness in Kunming, China. Ophthalmology 2008;115(6):969–974. [DOI] [PubMed] [Google Scholar]
- 6.Liang YB, Friedman DS, Wong TY, et al. Prevalence and causes of low vision and blindness in a rural Chinese adult population: the Handan Eye Study. Opthalmology 2008; 115(11):1965–1972. [DOI] [PubMed] [Google Scholar]
- 7.Zhao J, Ellwein LB, Cui H, et al. Prevalence of vision impairment in older adults in rural China. Opthalmology 2010; 117(3):409–416. [DOI] [PMC free article] [PubMed] [Google Scholar]
- 8.Zhao J, Ellwein LB, Cui H, et al. Prevalence and outcomes of cataract surgery in rural China. Opthalmology 2010;117(11): 2120–2128. [DOI] [PMC free article] [PubMed] [Google Scholar]
- 9.Huang S, Zheng Y, Foster PJ, et al. Prevalence and causes of visual impairment in Chinese adults in urban Southern China. Arch Ophthalmol 2009; 127(10): 1362–1367. [DOI] [PubMed] [Google Scholar]
- 10.Wang L, Huang W, He M, et al. Causes and five-year incidence of blindness and visual impairment in urban Southern China: the Liwan Eye Study. Invest Ophthalmol Vis Sci 2013; 54(6):4117–4121. [DOI] [PubMed] [Google Scholar]
- 11.Song W, Sun X, Shao Z, et al. Prevalence and causes of visual impairment in a rural North-east China adult population: a population based survey in Bin County, Harbin. Acta Ophthalmol 2010;88(6):669–674. [DOI] [PubMed] [Google Scholar]
- 12.Zhang Y, Wang H, Liu J, et al. Prevalence of blindness and low vision: a study in the rural Heilongjiang Province of China. Clin Experiment Ophthalmol 2012;40(5):484–489. [DOI] [PubMed] [Google Scholar]
- 13.Wei M, Chen H, Fan YC, Pathai S. Prevalence and causes of visual impairment and blindness in Sichuan province of China. Int J Ophthalmol 2010;3(1):83–88. [DOI] [PMC free article] [PubMed] [Google Scholar]
- 14.Xiao B, Kuper H, Guan C, Bailey K, Limburg H. Rapid assessment of avoidable blindness in three counties, Jiangxi Province, China. Br J Ophthalmol 2010;94(11):1437–1442. [DOI] [PubMed] [Google Scholar]
- 15.Li J, Zhong H, Cai N, et al. The prevalence and causes of visual impairment in an elderly Chinese Bai ethnic rural population: the Yunnan minority eye study. Invest Ophthalmol Vis Sci 2012;53(8):4498–4504. [DOI] [PubMed] [Google Scholar]
- 16.Li EY, Liu Y, Zhan X, et al. Prevalence of blindness and outcomes of cataract surgery in Hainan Province in South China. Ophthalmology 2013;120(11):2176–2183. [DOI] [PubMed] [Google Scholar]
- 17.Yao Y, Shao J, Sun W, et al. Prevalence of blindness and causes of visual impairment among adults aged 50 years or above in southern Jiangsu Province of China. Pak J Med Sci 2013;29(5):1203–1207. [DOI] [PMC free article] [PubMed] [Google Scholar]
- 18.Tang Y, Wang X, Wang J, et al. Prevalence and causes of visual impairment in a Chinese adult population: The Taizhou Eye Study. Ophthalmology 2015;122(7):1480–1488. [DOI] [PubMed] [Google Scholar]
- 19.Zhao JL, Wang Y, Gao XC, Ellwein LB, Liu H. Sampling and measurement methods of the protocol design of the China Nine-Province Survey for blindness, visual impairment and cataract surgery. Zhonghua Yan Ke Za Zhi 2011;47(9):779–784. [PubMed] [Google Scholar]
- 20.Bourne RRA, Flaxman SR, Braithwaite T, et al. ; on behalf of the Vision Loss Expert Group. Magnitude, temporal trends, and projections of the global prevalence of blindness and distance and near vision impairment: a systematic review and meta-analysis. Lancet Glob Health 2017;5:e888–e897. [DOI] [PubMed] [Google Scholar]
Associated Data
This section collects any data citations, data availability statements, or supplementary materials included in this article.