

Abstract
Purpose
Describe the prevalence of visual impairment/blindness among older adults in rural populations in China.
Design
Population-based, cross-sectional study.
Participants
We evaluated 45 747 adults ≥ 50 years of age.
Methods
Geographically defined cluster sampling was used in randomly selecting a cross-section of residents from a representative rural county within each of 9 provinces in mainland China. Participants were enumerated through village registers followed by door-to-door household visits. Eligible persons were invited to local examination sites for visual acuity (VA) testing and eye examination.
Main Outcome Measures
Presenting and best-corrected distance VA.
Results
Of 50 395 enumerated eligible persons, 45 747 (90.8%) were examined and tested for VA. The prevalence of presenting visual impairment <20/63 to ≥20/400 in the better eye was 10.8% and blindness (<20/400) was 2.29%. Across the 9 provinces, presenting visual impairment ranged from 6.89% to 15.8%, and blindness from 1.27% to 5.40%. With best-corrected VA, the prevalence of visual impairment was 5.30%, and 1.93% for blindness. The ranges across the 9 provinces were 3.13% to 9.51% for visual impairment and 0.74% to 4.95% for blindness. Visual impairment and blindness were associated with older age, female gender, lack of education, and geographic area (province) with both presenting and best-corrected VA.
Conclusions
Visual impairment and blindness are important public health problems in rural China, with significant regional variations in prevalence. Blindness prevention programs targeting the rural elderly should be expanded, particularly in areas with limited access and affordability of eye care services. Special emphasis should be given to reaching women and those without education. Greater attention should also be given to correction of refractive error.
China, with a population of 1.3 billion people, which accounts for 15% of the world’s population, is experiencing progressive urbanization, lifestyle changes, and increasingly modern medical care. As evidenced by the SightFirst China Action initiative established in 1997 by the State Council Coordination Committee on Disability in partnership with Lions Clubs International,1 and with the current government “One Million Cataract Program,” blindness (particularly from cataracts) is a high priority public health issue. Except for a national survey conducted in 1987,2 population-based data on the prevalence and causes of visual impairment/blindness for planning and implementation of local and national prevention strategies are limited to several localized surveys. Three were conducted in the relatively high socioeconomic status east coast region: a 1996 survey carried out in rural areas of Shunyi district in the Beijing municipality3; a 1997 survey in rural areas of Doumen county in southern Guangdong province4; and a 2001 survey in an urban area of Haidian district in northern Beijing combined with a rural area from Daxing district in southern Beijing.5 Two additional surveys were carried out in 2006, one combining rural and urban areas of Kunming in southwestern Yunnan province6 and one in rural areas of Yongnian county in Handan in northern Hebei province.7
To address the need for additional, representative data in characterizing the nature and magnitude of visual impairment and blindness, especially in the rural areas of China, the Ministry of Health commissioned the national “China Nine-Province Survey” in 2006 (before the recent surveys in Kunming and Handan). The emphasis on rural populations was motivated by several considerations. First, 60% of the population in China continues to live in rural areas.8 Second, the prevalence of visual impairment and blindness is comparatively high in rural populations with limited accessibility and affordability of eye care services.5,7 Third, the current prevention of blindness activities in China are targeted mainly toward populations in rural areas. Fourth, enumeration of older adults in rural areas is facilitated by official village resident registers, in contrast with younger age groups in areas with large migrant populations, as well as highly mobile urban communities.
The China Nine-Province Survey was conducted in 9 provinces representative of the different levels of socioeconomic development within the 4 municipalities and 27 provinces of mainland China: 1 municipality (Beijing) and 2 provinces (Jiangsu and Guangdong) in the East coast region, 3 provinces (Heilongjiang, Hebei and Jiangxi) in the inland Middle region, and 1 municipality (Chongqing) and 2 provinces (Xinjiang and Yunnan) in the West region. As reflected in annual consumption data for rural households, ranging from ¥1525 in Xinjiang to ¥4390 in Beijing, the selected study provinces were socioeconomically diverse.9
In collaboration with local health authorities, a rural county within each province was identified as the study area. The selected counties were socioeconomically representative of the rural areas of the province, engaged in prevention of blindness activities, and geographically accessible. The provinces and geographic location of the study counties are shown in the Figure 1: Shunyi district in Beijing municipality, Qidong county in Jiangsu province, and Yangxi county in Guangdong province in the East coast region; Shuangcheng county in Heilongjiang province, Longrao county in Hebei province, and Jian county in Jiangxi province in the inland Middle region; and Changji county in Xinjiang province, Yongchuan county in Chongqing municipality, and Luxi county in Yunnan province in the West region.
Figure 1.
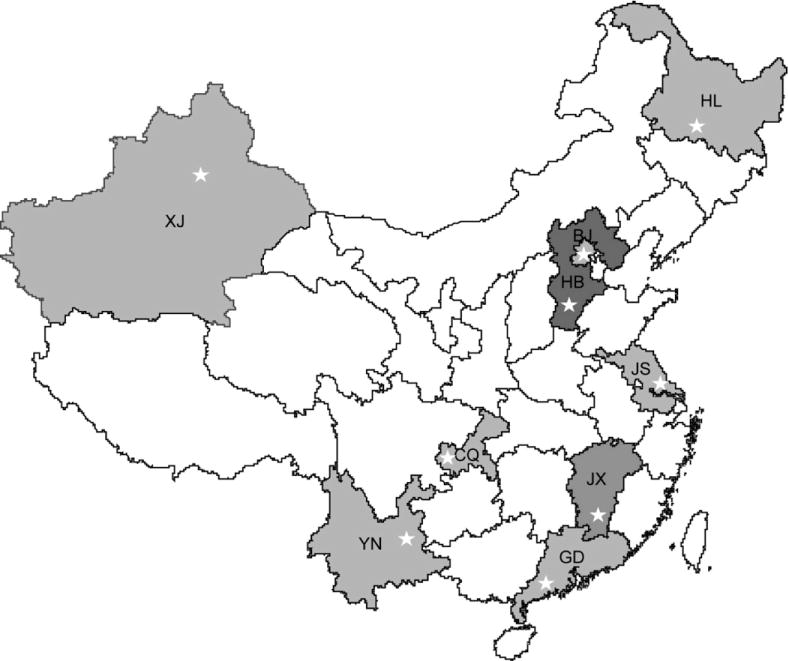
The 9 study provinces and the geographic location of the study site (◊). BJ = Beijing municipality; CQ = Chongqing province; GD = Guangdong province; HB = Hebei province; HL = Heilongjiang province; JS = Jiangsu province; JX = Jiangxi province; XJ = Xinjiang province; YN = Yunnan province.
The surveys were implemented by a local team at each site with oversight and technical supervision provided by a specially established Chinese Ophthalmological Society committee of study directors from each of the 9 surveys and chaired by the COS president (J.Z.).
This article presents data on the prevalence of visual impairment and blindness among adults ≥50 years of age in each of the 9 study areas. (Preliminary findings from the survey in Heilongjiang province were published previously.10) A subsequent article will report on the causes of visual impairment/blindness, and a companion article addresses the prevalence and visual acuity (VA) outcomes of cataract surgery.
Materials and Methods
The surveys were carried out in a randomly selected sample of individuals within each county. Major urban areas within the county were excluded. The sampling frame was constructed using geographically defined clusters based on village register data. Cluster boundaries were defined such that each cluster would have a population of approximately 1000 individuals (all ages).
Sample size was based on estimating an anticipated 4% prevalence for visual impairment <20/200 within an error bound (precision) of 20% with 95% confidence.3,4 Assuming an examination response rate of 85%, and a design effect of 1.5 to account for inefficiencies associated with the cluster sampling design, a sample of 4068 persons ≥50 years of age was required for each county. Depending on the percentage of population ≥50 years of age, 14 to 21 clusters were randomly selected (with equal probability) by the COS study headquarters from the sampling frame for each county.
Field work was carried out over a 6- to 8-month period, beginning in October 2006. Listing of households with the names of residents ≥50 years of age were obtained from the village registers, followed by door-to-door household visits conducted by enumeration teams. Those ≥50 years of age were enumerated by name, gender, age, education (using graduation levels), and spectacle usage. Individuals temporarily absent at the time of the household visit were included in the enumeration. Unregistered adults ≥50 years of age were enumerated and included in the study sample if they had been living in the household for ≥6 months.
Study participants were examined at local community facilities according to a prescheduled date established at the time of enumeration. Those who did not appear at the examination site were revisited, repeatedly if necessary, by a member of the enumeration team to encourage participation. (Examination teams were encouraged to achieve ≥90% participation within each cluster.) The physically disabled and those failing to come to the examination site after repeated contact were offered an ocular examination (using portable equipment) in their home, and scheduled toward the end of the field work period. Written informed consent using a scripted consent form was obtained at the examination site.
Distance VA was measured using a retro-illuminated logarithm of the minimum angle of resolution tumbling E chart at a distance of 4 meters, and at 1 meter for those failing to read the top line (20/200). Visual acuity was recorded as the smallest line read with 1 or no errors. Testing for counting fingers, hand movement, or light perception was performed on those unable to read the top line at 1 meter. Each eye was measured separately, with glasses if worn for distance correction. Those presenting with VA ≤20/40 in either eye were refracted to achieve best-corrected VA. The refraction was subjective and carried out without cycloplegia. (For those in whom subjective refraction was not possible, particularly the elderly examined in their home, best-corrected VA was assumed to be the same as presenting VA if pinhole vision combined with examination findings indicated a principal cause of impairment other than refractive error as described below.)
Ophthalmic examination of the eyelid, globe, pupillary reflex, and lens was carried out by a study ophthalmologist. For those with aphakia/pseudophakia, surgical history (year and place) was obtained, with clinical details pertaining to the type of surgery and surgical complications noted during the examination. Participants with best-corrected VA ≤20/40 had their pupils dilated for direct ophthalmoscopy and slit-lamp examination. Intraocular pressure measurement by applanation tonometry was performed on an optional basis for glaucoma suspects with optic disc abnormalities.
Eyes presenting with VA ≤20/40 were assigned a principal cause of visual impairment/blindness by the examining ophthalmologist using a 14-item list (refractive error, amblyopia, cataract, posterior capsule opacification, corneal opacity/scar, phthisical/disorganized/absent globe, glaucoma, other optic atrophy, macular degeneration, diabetic retinopathy, retinal detachment, other retinal/choroidal changes, other cause, and undetermined cause). Refractive error was assigned as the cause for eyes that improved to ≥20/32 with refractive correction, or with pinhole vision when subjective refraction was not possible. Cataract was assigned when lens opacity was commensurate with visual impairment and no other abnormality could account for the decrease in VA.
Human subject research approval of the protocol was cleared by the World Health Organization Secretariat Committee on Research Involving Human Subjects. The Peking Union Medical College Hospital Committee on Ethics on Research approved implementation of the survey protocol in China. The study adhered to the tenets of the Declaration of Helsinki.
The survey protocol and clinical methods were essentially the same as that used in the earlier Shunyi district and Doumen county surveys.3,4
Data Management and Analysis
Computerized data entry was carried out in each province using standardized programs. Original forms and data files were transferred to the data management and analysis center at the Peking Union Medical College Hospital, where measurement data ranges, frequency distributions, and consistency among related measurements were checked with data cleaning programs.
Visual acuity was categorized as: normal vision, ≥20/32; mild visual impairment (near normal vision), 20/40 to 20/63; moderate visual impairment, <20/63 to 20/200; severe visual impairment, <20/200 to 20/400; and blindness, <20/400. Prevalence rates of moderate and severe visual impairment (<20/63–20/400) and blindness were calculated on the basis of both presenting and best-corrected VA. Multiple logistic regressions were used to investigate the association of age (using 10-year categories), gender, education, and province with presenting and best-corrected visual impairment and blindness. Geographic location (province) was explicitly included as a regression variable to account for regional variation in the delivery of eye care.
Statistical analyses were performed using Stata Statistical Software, Release 9.0. (Stata Corp, College Station, TX). Confidence intervals (CI) and P values (significant at the P ≤0.05 level) were calculated with adjustment for clustering effects and stratification associated with the sampling design.
Results
A total of 50 395 persons aged ≥50 years were enumerated, with distribution across age, gender, education and province (Table 1). The mean age of the enumerated population was 62.1 years, ranging from 58.6 years in Xinjiang to 64.8 years in Guangdong. Overall, 45.8% were males, ranging from 42.7% in Jiangxi to 50.2% in Guangdong. Nearly 30% of those enumerated were without education, ranging from 3.69% in Hebei to 62.8% in Yunnan; education at the secondary level or higher was 18.3%, ranging from 1.04% in Jiangxi to 48.7% in Beijing.
Table 1.
Study Population by Age, Gender, Education, and Province
| Characteristic | Enumerated No. (%) |
Examined No. (%) |
% Examination Response Rate |
|---|---|---|---|
| Age (yrs) | |||
| 50–59 | 23 976 (47.4) | 21 670 (47.4) | 90.4 |
| 60–69 | 14 547 (28.9) | 13 345 (29.2) | 91.7 |
| 70–79 | 9120 (18.1) | 8351 (18.3) | 91.6 |
| ≥80 | 2752 (5.46) | 2381 (5.20) | 86.5 |
| Gender | |||
| Male | 23 484 (46.4) | 20 947 (45.8) | 89.2 |
| Female | 26 911 (53.4) | 24 800 (54.2) | 92.2 |
| Education | |||
| None | 15 073 (29.9) | 13 824 (30.2) | 91.7 |
| Less than primary | 8186 (16.2) | 7322 (16.0) | 89.5 |
| Primary | 17 918 (35.6) | 16 267 (35.6) | 90.8 |
| Secondary or higher | 9218 (18.3) | 8334 (18.2) | 90.4 |
| Province/municipality | |||
| Beijing | 5840 (11.6) | 5118 (11.2) | 87.6 |
| Jiangsu | 5662 (11.2) | 5141 (11.2) | 90.8 |
| Guangdong | 5531 (11.0) | 4589 (10.0) | 83.0 |
| Heilongjiang | 5481 (10.9) | 5047 (11.0) | 92.1 |
| Jiangxi | 5527 (11.0) | 5010 (11.0) | 91.4 |
| Hebei | 5402 (10.7) | 5051 (11.0) | 92.7 |
| Xinjiang | 5714 (11.3) | 5250 (11.5) | 91.9 |
| Chongqing | 5663 (11.2) | 5390 (11.7) | 95.2 |
| Yunnan | 5575 (11.1) | 5151 (11.3) | 92.4 |
| All | 50 395 (100.0) | 45 747 (100.0) | 90.8 |
As shown in Table 1, a total of 46 097 (91.5%) participants were examined and VA was available for 45 747 (90.8%), ranging from 83.0% in Guangdong to 95.2% in Chongqing. (One cluster in Beijing and 2 clusters in Guangdong were dropped from the study because examination response rates were <70%.) In logistic regression modeling with age, gender, education, and province as covariates, examination response was associated with older age (except for those ≥80 years of age), female gender, education at the primary level or higher, and province. The relatively high examination response rates in Jiangsu, Heilongjiang, Jiangxi, Hebei, Chongqing, and Yunnan were significant when compared with Beijing (the regression reference). Examination rates in Guangdong (low) and Xinjiang (high) were not significant.
The age and gender distribution of the examined population within each province is shown in Table 2. Overall, the mean age was 62.1 years—62.4 years in males and 61.9 years in females— and ranged from 58.6 years in Xinjiang to 64.5 years in Guangdong. The examined population was 45.8% male, ranging from 41.4% in Jiangsu to 49.9% in Guangdong.
Table 2.
Examined Population within Each Province by Age and Gender
| Province/municipality | No. (%) of Examined Participants
|
||||||
|---|---|---|---|---|---|---|---|
| 50–59 Years | 60–69 Years | 70–79 Years | ≥80 Years | Male | Female | All | |
| East coast provinces/municipalities | |||||||
| Beijing | 2348 (45.9) | 1519 (29.7) | 1032 (20.2) | 219 (4.28) | 2192 (42.8) | 2926 (57.2) | 5118 (100) |
| Jiangsu | 2058 (40.0) | 1570 (30.5) | 1105 (21.5) | 408 (7.94) | 2130 (41.4) | 3011 (58.6) | 5141 (100) |
| Guangdong | 1683 (36.7) | 1300 (28.3) | 1230 (26.8) | 376 (8.19) | 2291 (49.9) | 2298 (50.1) | 4589 (100) |
| Middle-inland provinces/municipalities | |||||||
| Heilongjiang | 2801 (55.5) | 1418 (28.1) | 660 (13.1) | 168 (3.33) | 2384 (47.2) | 2663 (52.8) | 5047 (100) |
| Jiangxi | 2250 (44.9) | 1531 (30.6) | 948 (18.9) | 281 (5.61) | 2095 (41.8) | 2915 (58.2) | 5010 (100) |
| Hebei | 2686 (53.2) | 1388 (27.5) | 774 (15.3) | 204 (4.04) | 2319 (45.9) | 2732 (54.1) | 5051 (100) |
| West provinces/municipalities | |||||||
| Xinjiang | 3172 (60.4) | 1462 (27.9) | 526 (10.0) | 90 (1.71) | 2549 (48.6) | 2701 (51.4) | 5250 (100) |
| Chongqing | 2487 (46.1) | 1722 (32.0) | 929 (17.3) | 252 (4.68) | 2494 (46.3) | 2896 (53.7) | 5390 (100) |
| Yunnan | 2186 (42.4) | 1435 (27.9) | 1147 (22.3) | 383 (7.44) | 2493 (48.4) | 2658 (51.6) | 5151 (100) |
| All | 21 670 (47.4) | 13 345 (29.2) | 8351 (18.3) | 2381 (5.20) | 20 947 (45.8) | 24 800 (54.2) | 45 747 (100) |
Table 3 shows the distribution within each province of presenting and best-corrected VA in the better-seeing eye. With presenting VA, the overall prevalence of moderate/severe visual impairment (<20/63–≥20/400) was 10.8% (95% CI, 10.3%–11.2%), ranging from 6.89% in Jiangsu to 18.2% in Guangdong. Presenting blindness (<20/400) was 2.29% (95% CI, 2.08%–2.50%), ranging from 1.27% in Beijing to 5.40% in Yunnan.
Table 3.
Distribution of Presenting and Best-Corrected Visual Acuity in the Better Eye within Each Province*
| Province/municipality | Better Eye Visual Acuity
|
||||
|---|---|---|---|---|---|
| >20/40 | 20/40–20/63 | <20/63–20/200 | <20/200–20/400 | <20/400 | |
| East coast provinces/municipalities | |||||
| Beijing | 3327 (65.0; 62.4–67.6) | 1298 (25.4; 23.5–27.2) | 395 (7.72; 6.41–9.03) | 33 (0.64; 0.46–0.85) | 65 (1.27; 0.80–2.30) |
| 4431 (86.6; 84.7–88.5) | 470 (9.18; 7.72–10.6) | 144 (2.81; 2.16–3.47) | 16 (0.31; 0.18–0.51)† | 57 (1.11; 0.65–1.58) | |
| Jiangsu | 3598 (70.0; 68.0–71.9) | 1076 (20.9; 19.3–22.5) | 338 (6.57; 5.77–7.38) | 16 (0.31; 0.18–0.50)† | 113 (2.20; 1.58–2.81) |
| 4245 (82.6; 80.9–84.2) | 631 (12.3; 11.0–13.6) | 165 (3.21; 2.66–3.76) | 9 (0.18; 0.08–0.33)† | 91 (1.77; 1.25–2.29) | |
| Guangdong | 2377 (51.8; 49.2–54.4) | 1256 (27.4; 25.4–29.3) | 768 (16.7; 15.4–18.1) | 65 (1.42; 1.11–1.73) | 123 (2.68; 2.18–3.18) |
| 2942 (64.1; 61.7–66.6) | 1105 (24.1; 22.1–26.1) | 396 (8.63; 7.74–9.52) | 37 (0.81; 0.50–1.11) | 109 (2.38; 1.96–2.79) | |
| Middle-inland provinces/municipalities | |||||
| Heilongjiang | 4042 (80.1; 77.5–82.7) | 544 (10.8; 8.89–12.7) | 317 (6.28; 5.14–7.43) | 48 (0.95; 0.71–1.19) | 96 (1.90; 1.44–2.36) |
| 4414 (87.5; 85.8–89.2) | 309 (6.12; 4.86–7.39) | 204 (4.04; 3.24–4.85) | 33 (0.65; 0.44–0.86) | 87 (1.72; 1.26–2.18) | |
| Jiangxi | 3215 (64.2; 62.5–65.9) | 975 (19.5; 18.4–20.6) | 602 (12.0; 10.9–13.1) | 124 (2.48; 1.91–3.04) | 94 (1.88; 1.57–2.19) |
| 4112 (82.1; 80.8–83.4) | 555 (11.1; 10.1–12.1) | 230 (4.59; 3.93–5.25) | 35 (0.70; 0.42–0.98) | 78 (1.56; 1.29–1.82) | |
| Hebei | 3547 (70.2; 68.5–71.9) | 1028 (20.4; 18.9–21.8) | 362 (7.17; 6.29–8.04) | 39 (0.77; 0.45–1.09) | 75 (1.48; 1.09–1.88) |
| 4385 (86.8; 85.9–87.7) | 438 (8.67; 7.92–9.42) | 145 (2.87; 2.30–3.45) | 30 (0.59; 0.31–0.88) | 53 (1.05; 0.76–1.34) | |
| West provinces/municipalities | |||||
| Xinjiang | 4100 (78.1; 75.4–80.8) | 659 (12.6; 10.8–14.3) | 389 (7.41; 5.99–8.83) | 32 (0.61; 0.37–0.85) | 70 (1.33; 0.99–1.68) |
| 4584 (87.3; 85.0–89.6) | 426 (8.11; 6.69–9.54) | 189 (3.60; 2.58–4.62) | 12 (0.23; 0.12–0.40)† | 39 (0.74; 0.49–1.00) | |
| Chongqing | 3564 (66.1; 64.2–68.1) | 1115 (20.7; 19.3–22.1) | 510 (9.46; 8.47–10.5) | 67 (1.24; 0.83–1.65) | 134 (2.49; 1.97–3.00) |
| 4409 (81.8; 80.3–83.3) | 576 (10.7; 9.62–11.8) | 253 (4.69; 4.03–5.36) | 38 (0.71; 0.45–0.96) | 114 (2.12; 1.63–2.60) | |
| Yunnan | 3491 (67.8; 65.6–69.9) | 566 (11.0; 9.46–12.5) | 616 (12.0; 10.7–13.2) | 200 (3.88; 2.60–5.17) | 278 (5.40; 4.20–6.60) |
| 4197 (81.5; 80.3–82.7) | 209 (4.06; 3.00–5.12) | 318 (6.17; 4.93–7.42) | 172 (3.34; 2.07–4.60) | 255 (4.95; 3.80–6.09) | |
| All | 31261 (68.3; 67.5–69.2) | 8517 (18.6; 18.0–19.3) | 4297 (9.39; 8.99–9.80) | 624 (1.36; 1.17–1.56) | 1048 (2.29; 2.08–2.50) |
| 37719 (82.5; 81.8–83.1) | 4719 (10.3; 9.78–10.8) | 2044 (4.47; 4.19–4.75) | 382 (0.84; 0.66–1.01) | 883 (1.93; 1.74–2.12) | |
Data are given as numbers of persons (prevalence percentage; 95% confidence interval). The first line under each province represents presenting vision and the second best corrected vision.
Confidence intervals were calculated using the exact binomial distribution instead of the normal approximation. Cluster design effects, ranging from 0.924 to 2.717, are not reflected in the confidence intervals for exact binomial estimates.
With best-corrected VA, the prevalence of moderate/severe visual impairment was 5.30% (95% CI, 5.01%–5.59%), ranging from 3.13% in Beijing to 9.51% in Yunnan. Blindness with best correction was 1.93% (95% CI, 1.74%–2.12%), ranging from 0.74% in Xinjiang to 4.95% in Yunnan.
Based on both presenting and best-corrected VA (Tables 4 and 5), visual impairment and blindness were associated with older age, female gender, lack of education, and province.
Table 4.
Presenting Visual Impairment (<20/63–20/400) and Blindness (<20/400) by Age, Gender, Education, and Province
| Characteristic | Presenting Visual Impairment
|
Presenting Blindness
|
||
|---|---|---|---|---|
|
Prevalence No. (%) |
Adjusted Odds Ratio (95% CI) |
Prevalence No. (%) |
Adjusted Odds Ratio (95% CI) |
|
| Age (yrs) | ||||
| 50–59 | 814 (3.76) | Reference | 109 (0.50) | Reference |
| 60–69 | 1245 (9.33) | 2.49 (2.23–2.78)† | 181 (1.36) | 2.61 (2.03–3.354)† |
| 70–79 | 1948 (23.3) | 6.82 (6.09–7.64)† | 405 (4.85) | 8.96 (6.95–11.6)† |
| ≥80 | 914 (38.4) | 13.8 (12.1–15.8)† | 353 (14.8) | 29.4 (22.2–39.0)† |
| Gender | ||||
| Male | 1950 (9.31) | Reference | 383 (1.83) | Reference |
| Female | 2971 (12.0) | 1.37 (1.28–1.47)† | 665 (2.68) | 1.50 (1.31–1.72)† |
| Education | ||||
| None | 2552 (18.5) | Reference | 629 (4.55) | Reference |
| Less than primary | 820 (11.2) | 0.88 (0.78–0.99)† | 154 (2.10) | 0.88 (0.70–1.12) |
| Primary | 1177 (7.24) | 0.77 (0.70–0.86)† | 211 (1.30) | 0.78 (0.62–0.98)* |
| Secondary or higher | 372 (4.46) | 0.61 (0.52–0.71)† | 54 (0.65) | 0.60 (0.43–0.86)† |
| Province/municipality | ||||
| Beijing | 428 (8.36) | Reference | 65 (1.27) | Reference |
| Jiangsu | 354 (6.89) | 0.62 (0.49–0.80) | 113 (2.20) | 1.29 (0.80–2.10) |
| Guangdong | 833 (18.2) | 1.94 (1.55–2.42)† | 123 (2.68) | 1.51 (0.97–2.35) |
| Heilongjiang | 365 (7.23) | 1.02 (0.78–1.34) | 96 (1.90) | 1.92 (1.20–3.08)† |
| Jiangxi | 726 (14.5) | 1.54 (1.22–1.96)† | 94 (1.88) | 1.16 (0.75–1.77) |
| Hebei | 401 (7.94) | 1.09 (0.86–1.37) | 75 (1.48) | 1.38 (0.84–2.27) |
| Xinjiang | 421 (8.02) | 1.31 (0.99–1.74) | 70 (1.33) | 1.64 (1.02–2.65)* |
| Chongqing | 577 (10.7) | 1.21 (0.95–1.53) | 134 (2.49) | 1.86 (1.20–2.88)† |
| Yunnan | 816 (15.8) | 1.58 (1.24–2.02)† | 278 (5.40) | 3.29 (2.05–5.30)† |
| All | 4921 (10.8) | — | 1048 (2.29) | — |
CI = confidence interval.
P ≤0.05.
P ≤0.01.
Table 5.
Best-Corrected Visual Impairment (<20/63–20/400) and Blindness (<20/400) by Age, Gender, Education, and Province
| Characteristic | Best-Corrected Visual Impairment | Best-Corrected Blindness | ||
|---|---|---|---|---|
|
Prevalence No. (%) |
Adjusted Odds Ratio (95% CI) |
Prevalence No. (%) |
Adjusted Odds Ratio (95% CI) |
|
| Age (yrs) | ||||
| 50–59 | 284 (1.31) | Reference | 70 (0.32) | Reference |
| 60–69 | 479 (3.59) | 2.65 (2.27–3.09)† | 129 (0.97) | 2.85 (2.10–3.86)† |
| 70–79 | 1047 (12.5) | 9.36 (8.12–10.8)† | 347 (4.16) | 11.5 (8.52–15.6)† |
| ≥80 | 616 (25.9) | 22.3 (19.0–26.2)† | 337 (14.2) | 42.1 (30.5–58.1)† |
| Gender | ||||
| Male | 937 (4.47) | Reference | 320 (1.53) | Reference |
| Female | 1489 (6.00) | 1.41 (1.28–1.55)† | 563 (2.27) | 1.51 (1.32–1.74)† |
| Education | ||||
| None | 1368 (9.90) | Reference | 556 (4.02) | Reference |
| Less than primary | 397 (5.42) | 0.84 (0.71–0.99)* | 124 (1.69) | 0.84 (0.65–1.10) |
| Primary | 522 (3.21) | 0.72 (0.63–0.82)† | 163 (1.00) | 0.79 (0.62–1.01) |
| Secondary or higher | 139 (1.67) | 0.55 (0.44–0.67)† | 40 (0.48) | 0.60 (0.43–0.85)† |
| Province/municipality | ||||
| Beijing | 160 (3.13) | Reference | 57 (1.11) | Reference |
| Jiangsu | 174 (3.38) | 0.82 (0.60–1.12) | 91 (1.77) | 1.16 (0.68–1.97) |
| Guangdong | 433 (9.44) | 2.46 (1.86–3.26)† | 109 (2.38) | 1.51 (0.93–2.46) |
| Heilongjiang | 237 (4.70) | 2.00 (1.46–2.74)† | 87 (1.72) | 2.05 (1.21–3.49)† |
| Jiangxi | 265 (5.29) | 1.34 (1.00–1.81) | 78 (1.56) | 1.09 (0.68–1.74) |
| Hebei | 175 (3.46) | 1.35 (0.98–1.86) | 53 (1.05) | 1.12 (0.65–1.94) |
| Xinjiang | 201 (383) | 1.88 (1.31–2.71)† | 39 (0.74) | 1.09 (0.62–1.90) |
| Chongqing | 291 (5.40) | 1.64 (1.22–2.21)† | 114 (2.12) | 1.82 (1.12–2.97)* |
| Yunnan | 490 (9.51) | 2.41 (1.82–3.19)† | 255 (4.95) | 3.42 (2.03–5.76)† |
| All | 2426 (5.30) | — | 883 (1.93) | — |
CI = confidence interval.
P≤ 0.05.
P≤ 0.01.
Of the 45 747 participants, 287 (0.63%) were with glasses for distance correction at the time of the examination, with 134 (46.7%) of these presenting with normal vision (VA<20/40) in 1 or both eyes. However, if everyone who was correctable to >20/40 in ≥1 eye with refraction had had glasses, the overall percentage with glasses (and normal vision) would have been 14.4%— the 134 plus another 6458. The source of the 6458 based on presenting visual impairment/blindness is as follows: 5449 (64.0%) of the 8517 with mild visual impairment (≤20/40–≥20/63), 1002 (20.4%) of the 4921 with moderate/severe visual impairment (<20/63–≥20/400), and 7 (0.67%) of the 1048 blind.
Discussion
The strengths of this survey were the large, randomly selected sample of participants and use of the same study protocol at each site. Examination response rates generally exceeded 90%, which was achieved by repeat household visits to seek participation and by offering examinations at home when necessary. The notably low examination response rate in Yangxi county (Guangdong) was due in part to the composition of the enumeration team, which was from the urban center of the county in Yangjiang and unable to speak the local dialect.
This study went beyond the previous surveys in China by explicitly including mild visual impairment (VA 20/40–20/63) as a category separate from normal vision. The prevalence of mild visual impairment was high, ranging from 10.8% in Heilongjiang to 27.4% in Guangdong with presenting vision and from 4.06% to 24.1% with best correction. Data such as these are increasingly important as visual requirements for work and other activities become more demanding, which is particularly true as rural areas begin to experience some of the rapid technological development seen in many of the larger urban areas throughout China.
Less than 1% of the examined population presented with spectacles for distance correction, which may be an underestimate of actual usage because participants were not explicitly told to bring glasses to the examination site. Nevertheless, the fact that 16.9% of those presenting with moderate/severe vision impairment, along with 64.0% of those with mild visual impairment, improved to normal vision in ≥1 eye with best correction is evidence that refractive correction is a significantly underutilized component of what should be standard eye care. If this level of refractive correction had been available, the prevalence of moderate/severe visual impairment would have been reduced to 8.6%, from 10.8%, but with essentially no influence on blindness (to 2.27% from 2.29%).
The prevalence of visual impairment/blindness across the 9 provinces varied more than what was expected. For visual impairment, the range represented a 2-fold variation with presenting VA and a 3-fold variation with best-corrected VA. For blindness, the variation was 5-fold with presenting VA, and 7-fold with best correction. This wide variation across the 9 study areas underscores the inadequacy of attempting to characterize visual impairment/blindness across the whole of China with a single, overall prevalence rate.11 Understanding the nature and magnitude of the problem is impeded when data from separate studies are lumped together.
In contrast to the significant interprovince differences, the prevalence of visual impairment and blindness in both Shunyi district (Beijing) and Yangxi county (Guangdong) were comparable with what was found in the earlier surveys in these 2 provinces/municipalities, as were prevalences from the current versus recently published surveys in Hebei and Yunnan provinces (Table 6).
Table 6.
Comparison of Visual Impairment (<20/63–20/400) and Blindness (<20/400) among Adults 50 Years of Age in Surveys Across China*
| Province/municipality | Presenting Visual Acuity
|
Best-Corrected Visual Acuity
|
||
|---|---|---|---|---|
| Visual Impairment | Blindness | Visual Impairment | Blindness | |
| Beijing municipality | ||||
| Shunyi county | 11.1% | 1.86% | — | — |
| Beijing | — | — | 2.28% (rural segment) | 0.73% (rural segment) |
| Shunyi district (current) | 8.36% (7.02–9.70) | 1.27% (0.80–2.30) | 3.13% (2.44–3.81) | 1.11% (0.65–1.58) |
| Guangdong province | ||||
| Doumen county | 19.9% | 2.67% | — | 2.37% (pinhole vision) |
| Yangxi county (current) | 18.2% (16.7–19.6) | 2.68% (2.18–3.18) | 9.44% (8.46–10.4) | 2.38% (1.96–2.79) |
| Hebei province | ||||
| Yongnian county | 7.36% | 0.90% | 1.98% | 0.68% |
| Longrao county (current) | 7.94% (7.10–8.77) | 1.48% (1.09–1.88) | 3.46% (2.88–4.05) | 1.05 (0.76–1.34) |
| Yunnan province | ||||
| Kunming | 12.1% | 3.67% (4.5% in rural segment) | — | — |
| Luxi county (current) | 15.8% (14.6–17.1) | 5.40% (4.20–6.60) | 9.51% (8.66–10.4) | 4.95% (3.80–6.09) |
Data are given as prevalence percentage (95% confidence interval).
For the Beijing municipality, the prevalence of presenting visual impairment in the 1996 Shunyi county survey was statistically higher than the prevalence in the current Shunyi survey (defined as falling outside the 95% CI of the current survey). These 2 surveys were conducted within the same geographical area in Shunyi; thus, the current findings are evidence of a reduction in visual impairment over the past decade. This reduction may have been a consequence of previous study activities in the area, as well as the Shunyi population becoming more urbanized, which is reflected in its administrative status changing from a county to a district in the Beijing municipality. In contrast, the prevalence of best-corrected visual impairment for the rural segment of the 2001 Beijing Eye Study was lower than that in the current Shunyi survey. (Presenting vision was not reported for the Beijing Eye Study.) In the absence of age and gender adjustments, however, it is possible that the difference in prevalence between these 2 surveys is primarily a reflection of differences in demographic makeup and survey methods.
In Guangdong, the prevalence of presenting visual impairment in the 1997 Doumen county survey was also higher than that in the current Yangxi county survey. Again, because this is a comparison across 2 different populations, caution must be exercised in attributing the reduction in visual impairment to improvement in access to eye care over the past decade.
In Hebei province, the prevalence of presenting blindness and of both best-corrected visual impairment and best-corrected blindness were lower in Yongnian county than in Longrao county. Similarly in Yunnan province, prevalences of presenting visual impairment and presenting blindness in the Kunming survey were lower than that in Luxi county. (The prevalence of presenting blindness reported for the rural segment of Kunming [4.5%], however, was not significantly different from that in Luxi county.) As with the previous comparisons, differences in prevalence between the 2 surveys in Hebei and the 2 in Yunnan are likely to be a combination of differences in both demographics and eye care delivery.
The prevalence of visual impairment/blindness compares favorably with the 1999 to 2000 studies in the ≥50 age group from Sivaganga, Tirunelveli, and Rajasthan in rural India, where a similar study protocol was used.12-14 There the prevalence of presenting visual impairment (<20/63–≥20/400) was 30.5%, 26.6%, and 27.4% and blindness (<20/400) 4.0%, 4.1%, and 8.9%, respectively. This compares with the 6.89% to 18.2% range for visual impairment and the 1.27% to 5.40% range for blindness in the 9 provinces. With best correction, visual impairment was 3.9%, 10.1%, and 11.2% and blindness 2.0%, 3.0% and 5.1%— compared with 3.13% to 9.51% for visual impairment and 0.74% to 4.95% for blindness in China.
The Nine-Province Survey provides broad and conclusive evidence that visual impairment/blindness is associated not only with older age, as expected, but also with female gender and lack of formal education. These findings are consistent with that of a higher age-adjusted risk of blindness in females in the 1996 Shunyi survey,3 and among the illiterate in the 1997 Doumen and 2001 Beijing surveys.4,5 In the absence of information on family income (for which reliable data are not easily obtained), education can be considered as a surrogate indicator of socioeconomic status.
Although sociodemographic factors such as age, gender, and education are important, they are insufficient in explaining the substantial regional variations in visual impairment and blindness across mainland China. As is the case with rural–urban comparisons, numerous behavioral and structural components pertaining to eye care delivery, including attitudes, availability, access, and affordability, affect visual impairment/blindness within the community. Priority should be given to research aimed at bettering the understanding of the pivotal issues underlying eye care delivery.
It is imperative that informed consideration be given to the local/regional eye care delivery environment in designing cost-effective strategies and operational programs for addressing the visual impairment/blindness problem. As noted, special emphasis should be targeted on the relatively high prevalence of visual impairment/blindness among females and illiterates, and greater attention should be given to correction of refractive error.
Acknowledgments
Supported by the Chinese Ministry of Health, Beijing, China; the World Health Organization, Geneva, Switzerland (under National Institutes of Health [Bethesda, Maryland] contract no. N01-EY-2103); and the Lions Clubs International Foundation, Oak Brook, Illinois. The sponsor or funding organizations participated in the design of the study.
Appendix: 1. The China Nine-Province Study Teams
Beijing
Jialiang Zhao, MD (Study Director); Hu Liu, MD (Field Director); Fengrong Li, MD (Team Leader), Yang Zhang, MD; Yuanquan Yang, MD; Wenbao Zhang, MD; Jin Mao, MD; Lijuan Jiang, MD; Xuan Wang; Haili Cai; Yuteng Jin; Jing Tian.
Chongqing
Zheng Qin Yin, MD (Study Director); Pinghua Li, MD (Field Director); Shengfang Song, MD (Team Leader); Fuliang Li, MD; Tinggang Wang, MD; ChunhuaLi, MD; Song Chen, MD Shujia Huo; Yiming Ren; Xiaoxi Liu; Yan Hu; Qiongwu Yu; Yamei Nie; Xiao Zheng; Haixing Wu; Xiaoqiong Li; Yongshuai Li; Qin Zhang.
Guangdong
Jian Ge, MD, PhD (Study Director); Min Fang, MD (Field Director); Mingguang He, MD PhD (Team Leader); Shengsong Huang, MD; Yangfa Zeng, MD; Dandan Wang, MD; Bin Liu, MD; Shiyi Li, MD; Tian Liu, MD; Mao Li, MD
Hebei
Jianhua Lv, MD (Study Director); Chongshan Wang (Field Director); Dongsheng Fan, MD (Team Leader); Chengming Zhung, MD; Shanyu Li, MD; Keqing Meng, MD; Yinghong Qiu, MD; Zhongyang Yan, MD; Ke Wang, MD; Hongbin Zhang, MD
Heilongjiang
Hao Cui, MD (Study Director); Liqiong Zhang, MD (Field Director); Zhijian Li, MD (Team Leader); Mingsheng Li, MD; Nannan Yu, MD; Lijuan·Luan, MD; Xueqin Liu, MD; Haitao Du, MD; Wei Zhang, MD; Dan Zhou, MD; Qinsheng Zhang, MD; Zhijie·Chen, MD; Shuang·Li, MD; Wei Wei, MD; Xuechi Liu, MD; Bin Li, MD
Jiangsu
Huaijin Guan, MD (Study Director); Hong Lu, MD (Field Director); Jianyan Hu, MD (Team Leader); Jian Shi, MD; Shuqin Wu, MD; Dongbing Yuan, MD; Chunwei Zhou; Bin Lou, MD; Zhui Dai, MD; Mi Li, MD; Jin Chen; Jinhua Cai, MD; Taoyang Chen, MD
Jiangxi
Jinglin Yin, MD (Study Director); Rong Luo, MD (Field Director); Hui Xie, M.D, (Team Leader); Yongquan Bai, MD; Pinghong Lai, MD; Lan Li, MD; Haijun Yang, MD; Hongyan Du, MD; Tian Fu, MD; Liming Jia.
Xinjiang
Xianzhi Ma, MD (Study Director); Junhui Bao, MD (Field Director); Jing Chen, MD (Team Leader); Bin Wei, MD; Ying Ye; Mei Erguli, MD; Peng Su, MD; Weiping Jin; Yongmei Chu; Xiaodong Tang, MD; Yalin An, MD
Yunnan
Yuansheng Yuan, MD (Study Director); Ning Cai (Field Director); Yanhao Luo (Team Leader); Jun Kang; Ping Duan; Hogn Duan; Peng Sun; Juan Zhan; Ping Liu; Aihua Dan; Yunshan L; Xiuzhen Li; Tiande Tang; Linjing Li.
Footnotes
A list of study team members for each of the 9 sites appears in Appendix 1 (available online at http://aaojournal.org).
The co-authors from the provinces contributed equally to this work.
Financial Disclosure(s):
The authors have no proprietary or commercial interest in any of the materials discussed in this article.
References
- 1.Sight first China action helps 2.6 million cataract patients. China Daily. October 15, 2003. Lifestyle News. Available at: http://www.chinadaily.com.cn/en/doc/2003-10/15/content_272325.htm. Accessed February 26, 2009.
- 2.Zhang SY, Zou LH, Gao YQ, et al. National epidemiological survey of blindness and low vision in China. Chin Med J (Engl) 1992;105:603–8. [PubMed] [Google Scholar]
- 3.Zhao J, Jia L, Sui R, Ellwein LB. Prevalence of blindness and cataract surgery in Shunyi County, China. Am J Ophthalmol. 1998;126:506–14. doi: 10.1016/s0002-9394(98)00275-x. [DOI] [PubMed] [Google Scholar]
- 4.Li S, Xu J, He M, et al. A survey of blindness and cataract surgery in Doumen County, China. Ophthalmology. 1999;106:1602–8. doi: 10.1016/S0161-6420(99)90459-1. [DOI] [PubMed] [Google Scholar]
- 5.Xu L, Wang Y, Li Y, et al. Causes of blindness and visual impairment in urban and rural areas in Beijing: the Beijing Eye Study. Ophthalmology. 2006;113:1134–41. doi: 10.1016/j.ophtha.2006.01.035. [DOI] [PubMed] [Google Scholar]
- 6.Wu M, Yip JLY, Kuper H. Rapid assessment of avoidable blindness in Kunming, China. Ophthalmology. 2008;115:969–74. doi: 10.1016/j.ophtha.2007.08.002. [DOI] [PubMed] [Google Scholar]
- 7.Liang YB, Friedman DS, Wong TY, et al. Handan Eye Study Group Prevalence and causes of low vision and blindness in a rural Chinese adult population: the Handan Eye Study. Opthalmology. 2008;115:1965–72. doi: 10.1016/j.ophtha.2008.05.030. [DOI] [PubMed] [Google Scholar]
- 8.National Bureau of Statistics of China. China Statistical Yearbook 2003. Table 4-1. Population and its composition. Beijing: China Statistics Press; 2003. p. 97. Available at: http://www.stats.gov.cn/english/statisticaldata/yearlydata/yarbook2003_e.pdf. Accessed September 24, 2009. [Google Scholar]
- 9.National Bureau of Statistics of China. China Statistical Yearbook 2003. Table 3-16. Household consumption. Beijing: China Statistics Press; 2003. p. 72. Available at: http://www.stats.gov.cn/english/statisticaldata/yearlydata/yarbook2003_e.pdf. Accessed September 24, 2009. [Google Scholar]
- 10.Li Z, Cui H, Liu P, et al. Prevalence and causes of blindness and visual impairment among the elderly in rural southern Harbin, China. Ophthalmic Epidemiol. 2008;15:334–8. doi: 10.1080/09286580802227386. [DOI] [PubMed] [Google Scholar]
- 11.Resnikoff S, Pascoline D, Etya’ale D, et al. Global data on visual impairment in the year 2002. Bull World Health Organ. 2004;82:844–51. [PMC free article] [PubMed] [Google Scholar]
- 12.Thulasiraj RD, Rahamathulla R, Saraswati A, et al. The Sivaganga Eye Survey: I. Blindness and cataract surgery. Ophthalmic Epidemiol. 2002;9:299–312. doi: 10.1076/opep.9.5.299.10334. [DOI] [PubMed] [Google Scholar]
- 13.Nirmalan PK, Thulasiraj RD, Maneksha V, et al. A population based eye survey of older adults in Tirunelveli district of south India: blindness, cataract surgery, and visual outcomes. Br J Ophthalmol. 2002;86:505–12. doi: 10.1136/bjo.86.5.505. [DOI] [PMC free article] [PubMed] [Google Scholar]
- 14.Murthy GV, Gupta S, Ellwein LB, et al. A population-based eye survey of older adults in a rural district of Rajasthan: I. Central vision impairment, blindness, and cataract surgery. Ophthalmology. 2001;108:679–85. doi: 10.1016/s0161-6420(00)00579-0. [DOI] [PubMed] [Google Scholar]