

Abstract
Purpose
To estimate the age-, gender-, and ethnicity-specific prevalence of amblyopia in children aged 5 to 15 years using data from the multi-country Refractive Error Study in Children (RESC).
Design
Population-based, cross-sectional study.
Participants
Among 46 260 children aged 5 to 15 years who were enumerated from 8 sites in the RESC study, 39 551 had a detailed ocular examination and a reliable visual acuity (VA) measurement in 1 or both eyes. Information on ethnicity was available for 39 321 of these participants. This study focused on findings from the 39 321 children.
Methods
The examination included VA measurements, evaluation of ocular alignment and refractive error under cycloplegia, and examination of the external eye, anterior segment, media, and fundus.
Main Outcome Measures
The proportion of children aged 5 to 15 years with amblyopia in different ethnic cohorts. Amblyopia was defined as best-corrected visual acuity (BCVA) of ≤20/40 in either eye, with tropia, anisometropia (≥2 spherical equivalent diopters =D]), or hyperopia (≥+6 spherical equivalent D), after excluding children with fundus or anterior segment abnormalities.
Results
The overall prevalence of amblyopia was 0.74% (95% confidence interval, 0.64–0.83) with significant (P < 0.001) variation across ethnic groups: 1.43% in Hispanic, 0.93% in Chinese, 0.62% in Indian, 0.52% in Malay, 0.35% in Nepali, and 0.28% in African children. Amblyopia was not associated with age or gender. The most common cause of amblyopia was anisometropia.
Conclusions
In this study, the prevalence of amblyopia varied with ethnicity and was highest in Hispanic children and lowest in African children. Most cases were unilateral and developed before the age of 5 years. The impact of changes of definitions on prevalence estimates is discussed.
Amblyopia is the most common cause of uncorrectable visual impairment in children and in adults up to 60 years of age.1–3 Amblyopia generally develops in the childhood years up to the age of 7 to 8 years4 and can be effectively remediated if detected and treated before the age of 9 to 10 years.2,5 If not treated, amblyopia can produce lifelong uncorrectable visual impairment.6
Estimation of the prevalence of amblyopia is important for both clinicians and health policy decision-makers for an understanding of the need for screening, detection, and intervention in the community. The prevalence of amblyopia has been reported in several studies,7–18 ranging from 0.2% in a school-based study of children aged 7 to 19 years in Tanzania,18 1.8% in a school-based study of Australian children aged 6 years,13 to 3.6% in British children aged 7 years in the Avon Longitudinal Study of Parents and Children (ALSPAC).16 Higher rates have been reported in clinical samples,19 but they clearly do not provide valid estimates of population prevalence. Many of the previous studies lack power and are difficult to compare with each other because of the generally low prevalence of amblyopia, different definitions of disease, and differences in the recruitment of the study samples.
The Multi-Ethnic Pediatric Eye Disease Study; the Baltimore Pediatric Eye Disease Study; the Strabismus, Amblyopia, and Refractive Error in Singapore study; and the Sydney Pediatric Eye Disease Study recently have used standardized methods and definitions to report the prevalence of amblyopia in preschool children aged 30 to 72 months.8,10,11,20–22 However, visual acuity (VA) testing in younger children of preschool age is problematic because cognitive function is still developing and it is difficult to distinguish poor acuity due to amblyopia from poor performance on this cognitive task.
Setting VA cutoffs for the definition of amblyopia is somewhat easier in older children. The multi-country Refractive Error Study in Children (RESC) is a large-scale population-based, cross-sectional survey of refractive error and visual impairment in school-aged children, which used standard methodology and common definitions, including a standard definition of amblyopia.23–31 By using RESC data, we report on the age- and gender-specific prevalence of amblyopia in children 5 to 15 years of age in 6 ethnic groups from 8 sites in 6 countries.
Methods
Population
The RESC surveys were conducted in populations with different ethnic origins and environments using a standardized protocol for sampling of the targeted study population and examination of participants. The RESC data used were obtained from 2 sites in China (urban Liwan District in Guangzhou28 and semi-rural Shunyi District near Beijing23), 2 sites in India (urban Trilokupi segment in New Delhi24 and rural Mahabubnagar District near Hyderabad in Southern India27), 1 site in Chile (the urban La Florida area of Santiago30), 1 site in Malaysia (urban Gombak District near Kuala Lumpur26), 1 site in Nepal (rural Jhapa District in Eastern Nepal25), and 1 site in South Africa (a semi-urban area within the South and West Regions of Durban29). Children aged 5 and 6 years were not included in the surveys in Kuala Lumpur and Hyderabad.
The survey ethnic groups were Hispanic, Chinese, Indian, Malay, Nepali, and African. The study populations in Kuala Lumpur and Durban were of more than 1 ethnicity, with ethnic identification based on self-reporting. The Chinese (East Asian), Indian (South Asian), Malay (South Asian), and African ethnic groups correspond to relatively well-defined population genetic clusters, but the population of Nepal is ethnically heterogeneous, consisting of people with South Asian or East Asian ancestries. Detailed questions about ethnicity were not included in the Nepal study; thus, ethnicity is described only as Nepali. Likewise, the population classified as Hispanic in Chile, as with other populations in the Americas, has mixed and variable ancestry from European, African, and Native American progenitors. This does not correspond to a well-defined population genetic cluster.
Details of the survey enumeration methods and examination procedures have been described.31 The study adhered to the tenets of the Declaration of Helsinki, and approval for the study protocol was obtained from the World Health Organization Secretariat Committee on Research Involving Human Subjects. Approval to conduct the study at each site was obtained from local health authorities. A guardian of the child was informed of the study details and asked to provide signed, informed consent.
Examinations
Visual Acuity
Uncorrected distance VA was measured with a retro-illuminated logarithm of the minimum angle of resolution chart (Precision Vision, La Salle, IL) with 5 tumbling “E” optotypes on each line in a monocular fashion with the right eye followed by the left eye. If uncorrected VA in either eye was ≤20/40, best-corrected visual acuity (BCVA) was measured using a trial frame under dilation in a monocular fashion.
Ocular Motility
Ocular alignment was assessed using the cover and uncover test. Cover testing was performed using fixation targets at near (0.5 m) and distance (4.0 m). Manifest strabismus was categorized as esotropia, exotropia, or vertical at 0.5 m and 4.0 m fixation. The degree of tropia was measured using the Hirsch-berg corneal light reflex.
Cycloplegic Refraction
Refraction measurements were attempted on all children after adequate cycloplegia, achieved using 2 drops of 1% cyclopentolate administered 5 minutes apart to each eye. A third drop was administered if a pupillary light reflex was still present after 20 minutes. At least 15 minutes after the last cyclo-plegic eye drops, cycloplegic refraction was performed with a streak retinoscope followed by measurement with a handheld auto-refractor. The cycloplegic retinoscopy data were used as the outcome for refractive status of the participants.
Definitions
The definition of amblyopia was determined by a panel of experts in an expert consultation meeting sponsored by the World Health Organization and US National Eye Institute. Amblyopia was defined as BCVA ≤20/40 in at least 1 eye associated with ≥1 of the following potential causes: (1) esotropia, exotropia, or vertical tropia at 4 m fixation, or esotropia or vertical tropia at 0.5 m (strabismic amblyopia); (2) anisometropia of ≥2 spherical equivalent diopters (D) (anisometropic amblyopia); or (3) hyperopia of ≥6 spherical equivalent D. Children with fundus or anterior segment abnormalities precluding normal vision were not counted as amblyopic.31
If only 1 eye met the criteria, the child was diagnosed with unilateral amblyopia. If both eyes met the criteria separately, the child was diagnosed with bilateral amblyopia.
Although an inter-ocular difference (IOD) of ≥2 lines has become a new standard in the definition of amblyopia, this was not available when we developed the RESC protocol in the year 2000. The possible impact on the prevalence estimation due to the changes of definition is clarified in the “Discussion” section.
Statistical Analysis
Stata Version 11.0 (StataCorp LP, College Station, TX) was used for all statistical analyses. Confidence intervals (CIs) and P values (significant at the <0.05 level) for prevalence estimates and regression models were calculated with adjustment for cluster effects associated with the sampling design. Prevalence was calculated as the ratio of the number of individuals with amblyopia to the total number examined with stratification by age, gender, and ethnicity. Multivariate logistic regression was used to investigate the association of age, gender, and ethnicity with amblyopia. Nonparametric analysis (Kruskal–Wallis rank test) was used to investigate differences in the distribution of BCVA in the unilateral amblyopic eyes by the underlying causes.
Results
Study Cohort
Among the 46 260 children enumerated, 39 551 (85.5%) had a detailed ocular examination (external eye, anterior segment, media, and fundus) with a reliable VA measurement in 1 or both eyes. Information on ethnicity was not available for 230 children in Durban and Kuala Lumpur, leaving a total of 39 321 children in the present analysis.
Table 1 shows the demographic characteristics of the study sample by ethnicity. The Chinese children were from Shunyi District (53.5%), Guangzhou (39.6%), and Kuala Lumpur (6.92%). The Indian children were from New Delhi (55.2%), rural Hyderabad (37.1%), Durban (3.85%), and Kuala Lumpur (3.82%). The African, Nepali, Malay, and Hispanic children were from only 1 study site: Durban (South Africa), Eastern Nepal, Kuala Lumpur (Malaysia), and Santiago (Chile), respectively.
Table 1.
Demographic Characteristics of the Study Sample by Ethnicity
| African (n = 4234) |
Nepali (n = 4802) |
Malay (n = 3250) |
Indian (n = 10 770) |
Chinese (n = 11 002) |
Hispanic (n = 5263) |
All (n = 39 321) |
|
|---|---|---|---|---|---|---|---|
| Age (yrs) | |||||||
| 5–7 | 996 (23.5%) | 1166 (24.3%) | 416 (12.8%) | 1897 (17.6%) | 1640 (14.9%) | 1616 (30.7%) | 7731 (19.7%) |
| 8–10 | 1343 (31.7%) | 1386 (28.9%) | 1268 (39.0%) | 3740 (34.7%) | 3767 (34.2%) | 1572 (29.9%) | 13 076 (33.3%) |
| 11–13 | 1231 (29.1%) | 1420 (29.6%) | 1047 (32.2%) | 3424 (31.8%) | 3685 (33.5%) | 1366 (26.0%) | 12 173 (31.0%) |
| 14–15 | 664 (15.7%) | 830 (17.3%) | 519 (16.0%) | 1709 (15.9%) | 1910 (17.4%) | 709 (13.5%) | 6341 (16.1%) |
| Gender | |||||||
| Male | 2066 (48.8%) | 2501 (52.1%) | 1680 (51.7%) | 5584 (51.8%) | 5633 (51.2%) | 2667 (50.7%) | 20 131 (51.2%) |
| Female | 2168 (51.2%) | 2301 (47.9%) | 1570 (48.3%) | 5186 (48.2%) | 5369 (48.8%) | 2596 (49.3%) | 19 190 (48.8%) |
Prevalence of Amblyopia
Of the 39 321 children in the analysis, 290 (0.74%; 95% CI, 0.64–0.83) were identified as amblyopic. Table 2 shows the prevalence of amblyopia stratified by age, gender, and ethnicity. In multivariate logistic regression modeling, with the largest ethnic group, Chinese, as the reference ethnicity, the prevalence of amblyopia in all ethnic groups was significantly lower than in children of Chinese ethnicity except Hispanic, in whom it was significantly higher. Amblyopia was not associated with age or gender. There were no significant differences in the prevalence of amblyopia between the Chinese populations in Shunyi and Guangzhou (adjusted odds ratio, 1.00; 95% CI, 0.91–1.89) or the India populations in Hyderbad and New Delhi (adjusted odds ratio, 0.72; 95% CI, 0.44–1.17).
Table 2.
Prevalence of Amblyopia by Age, Gender, and Ethnicity
| N (Prevalence, 95% CI) | Adjusted Odds Ratio (95% CI)* | |
|---|---|---|
| Age (yrs) | ||
| 5–7 (n = 7731) | 60 (0.78%, 0.56–0.99) | Reference |
| 8–10 (n = 13 076) | 95 (0.73%, 0.58–0.88) | 0.98 (0.70–1.36) |
| 11–13 (n = 12 173) | 92 (0.76%, 0.59–0.92) | 1.02 (0.72–1.44) |
| 14–15 (n = 6341) | 43 (0.68%, 0.50–0.86) | 0.92 (0.63–1.35) |
| Gender | ||
| Male (n = 20 131) | 146 (0.73%, 0.59–0.86) | Reference |
| Female (n = 19 190) | 144 (0.75%, 0.62–0.88) | 1.04 (0.80–1.34) |
| Ethnicity | ||
| Chinese (n = 11 002) | 102 (0.93%, 0.71–1.14) | Reference |
| African (n = 4234) | 12 (0.28%, 0.12–0.44) | 0.30 (0.16–0.56) |
| Nepali (n = 4802) | 17 (0.35%, 0.19–0.52) | 0.38 (0.23–0.63) |
| Malay (n = 3250) | 17 (0.52%, 0.35–0.70) | 0.56 (0.37–0.85) |
| Indian (n = 10 770) | 67 (0.62%, 0.47–0.77) | 0.67 (0.48–0.94) |
| Hispanic (n = 5263) | 75 (1.43%, 1.08–1.77) | 1.54 (1.10–2.17) |
| All (n = 39 321) | 290 (0.74%, 0.64–0.83) | —— |
CI = confidence interval.
Adjusted OR values were derived from multivariate logistic regression model that included age, sex, and ethnicity as covariates.
Table 3 summarizes the prevalence of unilateral and bilateral amblyopia by potential causes across the 6 ethnic groups. Unilateral amblyopia was diagnosed in 246 children (0.63%; 95% CI, 0.54–0.71), and bilateral amblyopia was diagnosed in 44 children (0.11%; 95% CI, 0.08–0.14). The greatest ethnic variation was seen in the prevalence of anisometropic amblyopia, ranging from 0.70% in Hispanics to 0.07% in African children (P < 0.001). Overall, anisometropia was the potential cause in 148 of the 246 children (60.2%) with unilateral amblyopia.
Table 3.
Prevalence of Unilateral and Bilateral Amblyopia by Potential Causes
| Amblyopia Type | African (n = 4234) |
Nepali (n = 4802) |
Malay (n = 3250) |
Indian (n = 10 770) |
Chinese (n = 11 002) |
Hispanic (n = 5263) |
All (n = 39 321) |
|---|---|---|---|---|---|---|---|
| Unilateral | 10 (0.24%) | 16 (0.33%) | 13 (0.40%) | 56 (0.52%) | 85 (0.77%) | 66 (1.25%) | 246 (0.63%) |
| Anisometropic* | 3 (0.07%) | 12 (0.25%) | 7 (0.22%) | 29 (0.27%) | 60 (0.55%) | 37 (0.70%) | 148 (0.38%) |
| Strabismic* | 4 (0.09%) | 4 (0.08%) | 4 (0.12%) | 18 (0.17%) | 10 (0.09%) | 16 (0.30%) | 56 (0.14%) |
| Mixed strabismic-anisometropic* | 1 (0.02%) | 0 (0.00%) | 2 (0.06%) | 7 (0.07%) | 7 (0.06%) | 10 (0.19%) | 27 (0.07%) |
| Hyperopia only | 2 (0.05%) | 0 (0.00%) | 0 (0.00%) | 2 (0.02%) | 8 (0.07%) | 3 (0.06%) | 15 (0.04%) |
| Bilateral | 2 (0.05%) | 1 (0.02%) | 4 (0.12%) | 11 (0.10%) | 17 (0.15%) | 9 (0.17%) | 44 (0.11%) |
| Total | 12 (0.28%) | 17 (0.35%) | 17 (0.52%) | 67 (0.62%) | 102 (0.93%) | 75 (1.43%) | 290 (0.74%) |
Data are presented as number (%) of children with amblyopia.
Cases with coexisting hyperopia were included in these categories.
Table 4 shows the distribution of BCVA in the unilateral amblyopic eyes by the underlying cause of amblyopia. Children with amblyopia with mixed mechanism of anisometropia and strabismus had significantly worse BCVA than those in the other 3 groups (all P < 0.05). The distributions of BCVA among the anisometropic, strabismic, and hyperopic groups were not significantly different (P > 0.05).
Table 4.
Distribution of Best-Corrected Visual Acuity by Potential Causes in Unilateral Amblyopic Eyes
| Visual Acuity Category | Anisometropia* (n = 148) | Strabismus* (n = 56) | Mixed* (n = 27) | Hyperopia only (n = 15) | All (n = 246) |
|---|---|---|---|---|---|
| ≤20/200 | 17 (11.5%) | 14 (25.0%) | 10 (37.1%) | 1 (6.70%) | 42 (17.1%) |
| 20/160–20/80 | 54 (36.5%) | 8 (14.3%) | 8 (29.6%) | 2 (13.3%) | 72 (29.3%) |
| 20/63–20/40 | 77 (52.0%) | 34 (60.7%) | 9 (33.3%) | 12 (80.0%) | 132 (53.7%) |
Cases with coexisting hyperopia were included in these categories.
We found the prevalence of amblyopia in the consolidated RESC data was lower than in many other studies. Across all sites, there were 857 children with BCVA ≤20/40 in 1 or both eyes (excluding children with fundus or anterior segment abnormalities), but only 290 children (33.8%) met the explicit criteria that require “amblyopia risk factors” (ARFs) in the RESC definitions, leaving 567 children as “unexplained or undetermined cases” of low VA. Because there is no international agreement on the definition of amblyopia and on associated risk factors, we tried different criteria for ARFs: lowering the threshold for anisome-tropia from 2.00 D to 1.00 D and adding myopia ≥−6.00 D and astigmatism ≥1.50 D as ARFs. We also adopted a definition when BCVA and IOD were used as the only criteria (BCVA ≤20/40 in the worse eye and IOD ≥2 lines, or BCVA ≤20/40 in both eyes and IOD <2 lines), whereas ignoring all other ARFs, such as anisometropia and tropia, this could inflate the prevalence by almost double (Fig 1). Given the fact that we did not measure BCVA as >20/40, the prevalence could have been increased further if the people with BCVA >20/40 and IOD ≥2 lines were included. On the other hand, as illustrated in Figure 1, after changing the definitions of ARFs, the prevalence of amblyopia increased in each ethnic group, especially when adding astigmatism as an ARF. However, the pattern of ethnic differences did not change: The prevalence of amblyopia in children of African and Nepali ethnic groups remained low, and the prevalence in Hispanic and Chinese ethnic groups remained high.
Figure 1.
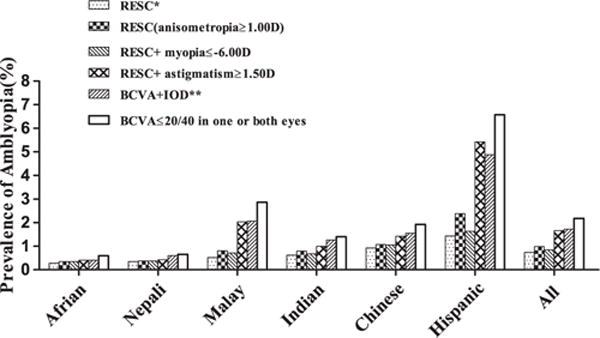
Prevalence of amblyopia in different ethnic groups based on different criteria. *Best-corrected visual acuity (BCVA) ≤20/40 with ≥1 potential causes: (1) esotropia, exotropia, or vertical tropia at 4 m fixation, or esotropia or vertical tropia at 0.5 m; (2) anisometropia ≥2.00 diopters (D) spherical equivalent (SE); (3) ametropia ≥6.00 D SE. **BCVA ≤20/ 40 in the worse eye and interocular difference (IOD) <2 lines, or BCVA ≤20/40 in both eyes and IOD <2 lines. RESC = Refractive Error Study in Children.
Figure 2 shows the association of the prevalence of amblyopia with the age of participants based on varied definition criteria. Although the prevalence of amblyopia did not change with age when using the RESC criteria, the prevalence was markedly higher among the younger age group (5–7 years) when BCVA ≤20/40 in either eye was used as the only criterion. Although the majority of this low BCVA impairment may be explained by insufficient attention, cognitive ability, or underdeveloped visual function in children of this age, IOD and astigmatism also seem to be associated with the impairment. A change on the level of anisometropia (from 2 D to 1 D difference) and including high myopia as an ARF did not change the prevalence much, but when astigmatism ≥1.50 D and IOD of at least 2 lines were included, the prevalence of amblyopia increased considerably.
Figure 2.
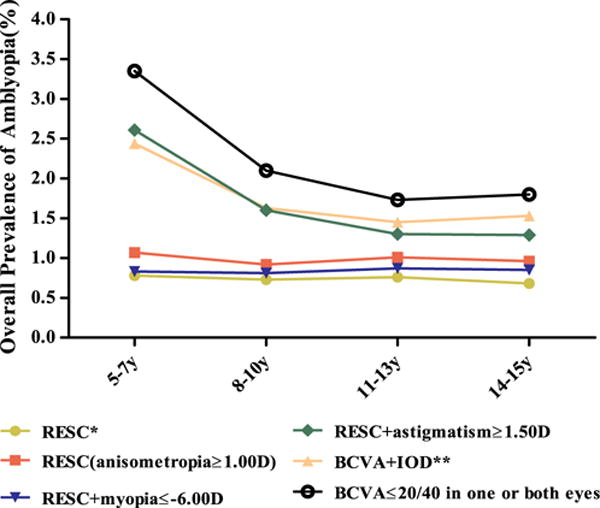
The distribution of amblyopia by age based on different criteria. *Best-corrected visual acuity (BCVA) ≤20/40 with ≥1 causes: (1) esotropia, exotropia, or vertical potential tropia at 4 m fixation, or esotropia or vertical tropia at 0.5 m; (2) anisometropia ≥2.00 D spherical equivalent (SE); (3) ametropia ≥6.00 D SE. **BCVA ≤20/40 in the worse eye and interocular difference (IOD) ≥2 lines, or BCVA ≤20/40 in both eyes and IOD <2 lines. D = diopters; RESC = Refractive Error Study in Children.
Discussion
This study is a multi-country population-based study to systematically estimate the prevalence of amblyopia in school-aged children. The study used standardized methods for sampling and examination, as well as a uniform definition for amblyopia. We found that amblyopia affected approximately 7 to 8 of 1000 school-aged children. The prevalence was lowest in children of African ethnicity and 3 to 5 times higher in children of Chinese and Hispanic ethnicity. The prevalence of amblyopia did not increase with age, suggesting that most amblyopia develops by the age of 5 years.
Comparison with Previous Studies
In a review on amblyopia published in 2005, Simons2 concluded that the prevalence of amblyopia was in the range of 1.6% to 3.6%, and that there were no significant ethnic/ racial differences in prevalence. This picture was endorsed in a more recent review of anisometropia and amblyopia.32 The results from the RESC surveys give a different picture. First, in most of the ethnic groups studied, and even when less stringent definitions are used, the prevalence rates are well below this range. We found significant differences among ethnic groups, with low prevalence rates reported for African and South Asian (Indian) ethnic groups, including the Nepali sample, which is likely to be predominantly of South Asian origin, and higher prevalence rates in Hispanic and East Asian (Chinese) ethnic groups. The RESC studies did not include populations of predominantly European ancestry, but 2 population-based studies with valid methodology and defi-nitions (ALSPAC16 and the Sydney Myopia Study13,15) have reported prevalence rates for amblyopia of 3.6% and 1.9% in children of predominantly European ancestry.
With common methodology and definitions across the 8 study sites, internal comparisons within this study have considerable strength. Likewise, with the use of population-based recruitment strategies, the bias on selective participation, which is inevitable in a hospital-based study, or in school-based data can be avoided. When comparing with other studies, however, several factors that may affect estimates of the prevalence of amblyopia need to be considered. Differences in the definition of amblyopia are particularly important. The current study used a VA cutoff of ≤20/40 in at least 1 eye, in combination with predefined ARFs. This may have underestimated the prevalence, particularly given that an IOD criterion was not adopted. The VA cutoff also is important, particularly in studies that involve preschool children, in whom VA may be limited by visual and cognitive development. This may explain, at least in part, why considerably higher prevalence rates of amblyopia have been reported in pediatric studies.8,11
A comparative summary of the main findings from various published studies is given in Table 5. The RESC studies, in combination with other studies, including those on populations of European origin, suggest that there may be a gradient of amblyopia prevalence, from very low in populations of sub-Saharan African origin to high in populations of European ancestry. Figure 3 illustrates the increase in the prevalence of amblyopia among different ethnic groups. In all of these studies, there is potential confounding of ethnicity and site, because most of the children from each of the ethnic groups were predominantly drawn from 1 site. However, several other studies on nonclinical samples of African children have also given low prevalence rates for amblyopia, consistent with those reported in the current study.18,33–37 They all seem to have a reasonable population base and methodology and definitions that would be likely to lead to overestimation of amblyopia. The low prevalences found in children of sub-Saharan African origin were not significantly changed by changes in the definitions of ARFs. Some support for the reality of these ethnic differences comes from pediatric eye disease studies, which have reported higher prevalences of amblyopia in children of Hispanic ethnicity and lower prevalences in children of African-American origin.8,11 The prevalence in African-American children is not as low as reported in this study, but a substantial proportion of people classified as African American in the United States show considerable admixture with populations of European origin.38 Further studies will be required to confirm whether these differences between ethnic groups are consistent with and robust to changes in the definition of amblyopia, and to establish whether they are associated with differences in the prevalence of ARFs or other factors. However, the general picture is consistent with what is known about the spread of human populations out of Africa, with all out-of-Africa populations showing a higher prevalence of amblyopia than that seen in populations in sub-Saharan Africa. It is not clear what factors have contributed to this pattern, but we speculate that the general loss of pigmentation in the European and East Asian branches of the human family may be important, because it is known from both human and animal studies that low pigmentation is often associated with strabismus and disordered visual pathways.39–41
Table 5.
Prevalence of Amblyopia in Other Studies and Populations
| Study | Country (Publication Year) | Age (N) | Ethnicity | Diagnostic Criteria* | Prevalence |
|---|---|---|---|---|---|
| SPEDS19 | Australia (2012) | 30–72 mos (1422) | Multiethnic (predominantly white) | Criterion A | 1.9% |
| STARS18 | Singapore (2010) | 30–72 mos (1682) | Chinese | Criterion A | 1.19% |
| BPEDS9 | United States (2009) | 30–71 mos (1546) | White (673) African American (873) |
Criterion A | 1.8% 0.8% |
| MEPEDS6 | United States (2008) | 30–72 mos (3350) | African American (1663) Hispanic/Latino (1687) |
Criterion A | 1.5% 2.6% |
| MEPEDS20 | United States (2013) | 30–72 mos (1883) | Asian American (938) Non-Hispanic White (945) |
Criterion A | 1.81% 1.81% |
| Chang et al17 | Taiwan (2007) | 3–6 yrs (5232) | Hans and aboriginal Taiwanese | Criterion B | 2.2% |
| ALSPAC14 | United Kingdom (2008) | 7 yrs (7825) | Predominantly white | Criterion C | 3.6% |
| SMS11 | Australia (2006) | 6 yrs (1739) | Multiethnic (predominantly white) | Criterion D | 1.8% |
| SMS13 | Australia (2008) | 12 yrs (2353) | Multiethnic (predominantly white) | Criterion D | 1.9% |
| RESC | Multi-country | 5–15 yrs (39 321) | Multiethnic | Criterion E | 0.74% |
ALSPAC = Avon Longitudinal Study of Parents and Children; BPEDS = Baltimore Pediatric Eye Disease Study; MEPEDS = Multiethnic Pediatric Eye Disease Study; RESC = Refractive Error Study in Children; SMS = Sydney Myopia Study; SPEDS = Sydney Pediatric Eye= Disease Study; STARS = Strabismus, Amblyopia and Refractive Error in Young Singaporean Children.
Criterion A: The definition used in the pediatric studies. Unilateral: BCVA ≤20/32 in the worse eye, IOD ≥2-line, with ≥1 amblyogenic factors: (1) or constant intermittent strabismus; (2) previous strabismus surgery; (3) anisometropia consistent with the worse eye (≥1.00 D SE anisohyperopia, ≥3.00 D SE anisomyopia, or ≥1.50 D anisoastigmatism); (4) past or present obstruction of visual axis. Bilateral: bilateral BCVA <20/50 (age 30–47 mos) or <20/40 (age 48–72 mos), with bilateral ametropia (≥4.00 D SE hyperopia, ≥6.00 D SE myopia, or ≥2.50 D astigmatism) or with past or present bilateral obstruction of visual axis.
Criterion B: BCVA <1.0 and risk factors evaluated by an ophthalmologist.
Criterion C: BCVA <20/40 for the worse eye, IOD ≥2-line, or history of amblyopia treatment.
Criterion D: Unilateral: BCVA <20/40 in the worse eye, IOD ≥2-line and with ≥1 amblyogenic factors: (1) anisometropic amblyopia: ≥1.00 D, SE between the 2 eyes, without strabismus; (2) strabismic amblyopia: any heterotropia or history of strabismus surgery without anisometropia or high refractive error; (3) mixed strabismic-anisometropic amblyopia: (1) and (2) were present in combination; (4) stimulus deprivation amblyopia: past or present obstruction of visual axis. Bilateral: bilateral BCVA <20/40, with bilateral ametropia (≥4.00 D SE hyperopia, ≥6.00 D SE myopia, or ≥2.50 D astigmatism); or with past or present bilateral obstruction of visual axis. History of amblyopia or treatment.
Criterion E: BCVA ≤20/40 with ≥1 potential causes: (1) esotropia, exotropia, or vertical tropia at 4 m fixation, or esotropia or vertical tropia at 0.5 m; (2) anisometropia ≥2.00 D SE; (3) hyperopia ≥6.00 D SE.
Figure 3.
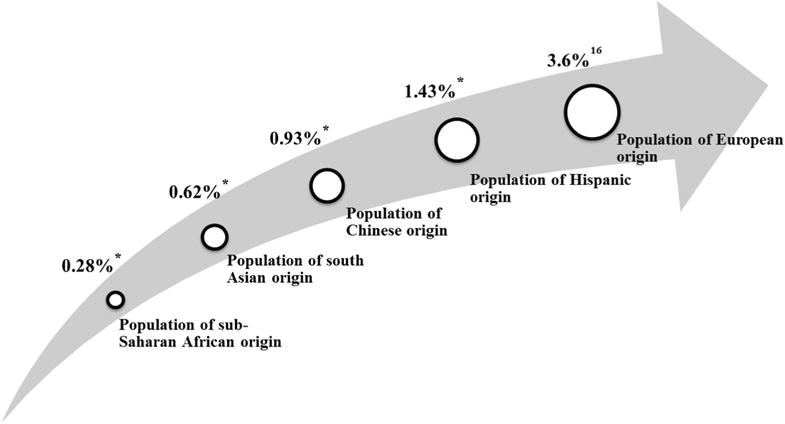
A possible gradient of the prevalence of amblyopia across different ethnic groups. *Data were from the current study.
Potential Underestimation of Prevalence
This current analysis required the presence of ARFs for a diagnosis of amblyopia. Accordingly, failure to detect an ARF, such as anisometropia, strabismus, or high hyperopia, could lead to underestimation of the amblyopia prevalence. However, because the RESC studies included a full ophthalmic assessment, an underestimation of the prevalence of amblyopia due to failure to detect ARFs is unlikely.
However, we did not include IOD ≥2 lines as a criterion in the RESC study protocol and definition. This would lead to underestimation of the prevalence by approximately half, as illustrated in Figure 1. However, when we included more ARFs in the definition, particularly when adding the astigmatism of >1.50 D, the prevalence did increase considerably, especially in the Hispanic and Malay populations. This indicates that the choice of ARFs for diagnostic purposes is critical, and more work is required to develop internationally agreed-upon definitions, particularly in dealing with cases with bilateral low VA.
Visual deprivation amblyopia, such as that caused by congenital cataract, corneal opacities, or ptosis, was not included in our definition of amblyopia, which may have led to a slight underestimation of the amblyopia prevalence; however, deprivation amblyopia is rare.42 Therefore, we believe that the impact of this exclusion is very limited.
Another important consideration is whether the prevalence of amblyopia includes children with amblyopia that has been detected and successfully treated. This assessment was not part of the multi-country RESC study protocol, but was included in some of the surveys with the highest prevalence rates, such as the ALSPAC study16 and the Sydney Myopia Study.13,15 Although this could account for some of the reported differences in prevalence, provision of vision screening and remediation is limited in most of the RESC study sites, as the generally low percentage of corrected refractive error indicates; thus, it is unlikely that many of the children would have been previously diagnosed with or treated for amblyopia.
Finally, children without VA measurements were excluded from the analysis. To the extent that some may have been unable to cooperate because they were amblyopic, prevalence would have been underestimated if amblyopia was more prevalent among those excluded compared with the prevalence in the examined cohort, but this is a general problem for all studies of this kind.
None of these potential sources of prevalence underestimation can account for the differences between our results and the prevalence range reported in previous reviews.2 We believe that the expected range for prevalence of amblyopia needs to be revised to include lower prevalence rates in populations who are not of European origin.
Clinical Implications
We found bilateral amblyopia to be uncommon (0.11%) in these school-aged children. This is important because bilateral amblyopia can have a greater impact on daily visual function than unilateral cases. Most of the bilateral cases were associated with high levels of refractive error, and there were no statistically significant differences in the prevalence of bilateral amblyopia among the 6 ethnicities.
We are the first to report that the age-specific prevalence of amblyopia remained essentially unchanged across the 5-to 15-year age interval. This finding suggests that most amblyopia develops before the age of 5 years. It was worth noting that when adding astigmatism to the ARF criteria, the prevalence was higher in the 5- to 7-year-olds. For those older than 5 to 7 years of age, the prevalence was lower and did not change with age. This pattern indicates that some children in the 5- to 7-year-old group diagnosed as amblyopic when astigmatism was included as an ARF may not be genuinely amblyopic, because their vision seems to improve with age, even among those with BCVA impairment and astigmatism, possibly due to further development of the eye and cognitive capacities, leading to increased VA. Our finding of no gender-specific difference in the prevalence of amblyopia is in agreement with a number of previous reports.8,9,13,21
In conclusion, the current analysis of amblyopia is a population-based study with by far the largest sample size. The results provide reliable and comparable data of amblyopia among 6 ethnic groups of school-aged children, based on standard methodology and definitions. The prevalence of amblyopia varied with ethnicity and was highest among Hispanic children and lowest in African children. Prevalence did not change with age, suggesting that the majority of amblyopia cases develop by 5 years of age. At least half of the cases were secondary to anisometropia. Bilateral amblyopia was uncommon, but there was a considerable amount of bilateral low VA not associated with an identified risk factor in the younger children. The potential for underestimation of the prevalence, when different definitions are used, has been discussed, in particular when IOD could have been used as a criterion.
Supplementary Material
Acknowledgments
Funded by the World Health Organization under National Institute of Health contract N01-EY-2103, Fundamental Research Funds of the State Key Laboratory in Ophthalmology, and National Natural Science Foundation of China (81125007).
Abbreviations and Acronyms
- ALSPAC
Avon Longitudinal Study of Parents and Children
- ARF
amblyopia risk factor
- BCVA
best-corrected visual acuity
- CI
confidence interval
- D
diopters
- IOD
inter-ocular difference
- RESC
Refractive Error Study in Children
- VA
visual acuity
Footnotes
Supplemental material is available at www.aaojournal.org.
Financial Disclosure(s):
The author(s) have no proprietary or commercial interest in any materials discussed in this article.
Author Contributions:
Conception and design: He
Data collection: Xiao, He
Analysis and interpretation: Xiao, Morgan, Ellwein, He
Obtained funding: Not applicable
Overall responsibility: Xiao, Morgan, Ellwein, He
References
- 1.Holmes JM, Clarke MP. Amblyopia. Lancet. 2006;367:1343–51. doi: 10.1016/S0140-6736(06)68581-4. [DOI] [PubMed] [Google Scholar]
- 2.Simons K. Amblyopia characterization, treatment, and prophylaxis. Surv Ophthalmol. 2005;50:123–66. doi: 10.1016/j.survophthal.2004.12.005. [DOI] [PubMed] [Google Scholar]
- 3.Wang JJ, Foran S, Mitchell P. Age-specific prevalence and causes of bilateral and unilateral visual impairment in older Australians: the Blue Mountains Eye Study. Clin Experiment Ophthalmol. 2000;28:268–73. doi: 10.1046/j.1442-9071.2000.00315.x. [DOI] [PubMed] [Google Scholar]
- 4.Levi DM. Visual processing in amblyopia: human studies. Strabismus. 2006;14:11–9. doi: 10.1080/09273970500536243. [DOI] [PubMed] [Google Scholar]
- 5.Park KH, Hwang JM, Ahn JK. Efficacy of amblyopia therapy initiated after 9 years of age. Eye (Lond) 2004;18:571–4. doi: 10.1038/sj.eye.6700671. [DOI] [PubMed] [Google Scholar]
- 6.Bhola R, Keech RV, Kutschke P, et al. Recurrence of amblyopia after occlusion therapy. Ophthalmology. 2006;113:2097–100. doi: 10.1016/j.ophtha.2006.04.034. [DOI] [PubMed] [Google Scholar]
- 7.Fotouhi A, Hashemi H, Mohammad K, Jalali KH. The prevalence and causes of visual impairment in Tehran: the Tehran Eye Study. Br J Ophthalmol. 2004;88:740–5. doi: 10.1136/bjo.2003.031153. [DOI] [PMC free article] [PubMed] [Google Scholar]
- 8.MEPEDS Group. Prevalence of amblyopia and strabismus in African American and Hispanic children ages 6 to 72 months the multi-ethnic pediatric eye disease study. Ophthalmology. 2008;115:1229–36.e1. doi: 10.1016/j.ophtha.2007.08.001. [DOI] [PMC free article] [PubMed] [Google Scholar]
- 9.Attebo K, Mitchell P, Cumming R, et al. Prevalence and causes of amblyopia in an adult population. Ophthalmology. 1998;105:154–9. doi: 10.1016/s0161-6420(98)91862-0. [DOI] [PubMed] [Google Scholar]
- 10.Chia A, Dirani M, Chan YH, et al. Prevalence of amblyopia and strabismus in young Singaporean Chinese children. Invest Ophthalmol Vis Sci. 2010;51:3411–7. doi: 10.1167/iovs.09-4461. [DOI] [PMC free article] [PubMed] [Google Scholar]
- 11.Friedman DS, Repka MX, Katz J, et al. Prevalence of amblyopia and strabismus in white and African American children aged 6 through 71 months. The Baltimore Pediatric Eye Disease Study. Ophthalmology. 2009;116:2128–34. doi: 10.1016/j.ophtha.2009.04.034. [DOI] [PMC free article] [PubMed] [Google Scholar]
- 12.Matsuo T, Matsuo C. The prevalence of strabismus and amblyopia in Japanese elementary school children. Ophthalmic Epidemiol. 2005;12:31–6. doi: 10.1080/09286580490907805. [DOI] [PubMed] [Google Scholar]
- 13.Robaei D, Rose KA, Ojaimi E, et al. Causes and associations of amblyopia in a population-based sample of 6-year-old Australian children. Arch Ophthalmol. 2006;124:878–84. doi: 10.1001/archopht.124.6.878. [DOI] [PubMed] [Google Scholar]
- 14.Wang Y, Liang YB, Sun LP, et al. Prevalence and causes of amblyopia in a rural adult population of Chinese the Handan Eye Study. Ophthalmology. 2011;118:279–83. doi: 10.1016/j.ophtha.2010.05.026. [DOI] [PubMed] [Google Scholar]
- 15.Robaei D, Kifley A, Rose KA, Mitchell P. Impact of amblyopia on vision at age 12 years: findings from a population-based study. Eye. 2008;22:496–502. doi: 10.1038/sj.eye.6702668. [DOI] [PubMed] [Google Scholar]
- 16.Williams C, Northstone K, Howard M, et al. Prevalence and risk factors for common vision problems in children: data from the ALSPAC study. Br J Ophthalmol. 2008;92:959–64. doi: 10.1136/bjo.2007.134700. [DOI] [PubMed] [Google Scholar]
- 17.Chang CH, Tsai RK, Sheu MM. Screening amblyopia of preschool children with uncorrected vision and stereopsis tests in Eastern Taiwan. Eye (Lond) 2007;21:1482–8. doi: 10.1038/sj.eye.6702568. [DOI] [PubMed] [Google Scholar]
- 18.Wedner SH, Ross DA, Balira R, et al. Prevalence of eye diseases in primary school children in a rural area of Tanzania. Br J Ophthalmol. 2000;84:1291–7. doi: 10.1136/bjo.84.11.1291. [DOI] [PMC free article] [PubMed] [Google Scholar]
- 19.Noche CD, Kagmeni G, Bella AL, Epee E. Prevalence and etiology of amblyopia of children in Yaounde (Cameroon), aged 5-15 years. Sante. 2011;21:159–64. doi: 10.1684/san.2011.0254. [DOI] [PubMed] [Google Scholar]
- 20.Dirani M, Chan YH, Gazzard G, et al. Prevalence of refractive error in Singaporean Chinese children: the strabismus, amblyopia, and refractive error in young Singaporean Children (STARS) study. Invest Ophthalmol Vis Sci. 2010;51:1348–55. doi: 10.1167/iovs.09-3587. [DOI] [PMC free article] [PubMed] [Google Scholar]
- 21.Pai AS, Rose KA, Leone JF, et al. Amblyopia prevalence and risk factors in Australian preschool children. Ophthalmology. 2012;119:138–44. doi: 10.1016/j.ophtha.2011.06.024. [DOI] [PubMed] [Google Scholar]
- 22.McKean-Cowdin R, Cotter SA, Tarczy-Hornoch K, et al. Prevalence of amblyopia or strabismus in Asian and non-Hispanic white preschool children: multi-ethnic pediatric eye disease study. Ophthalmology. 2013;120:2117–24. doi: 10.1016/j.ophtha.2013.03.001. [DOI] [PMC free article] [PubMed] [Google Scholar]
- 23.Zhao J, Pan X, Sui R, et al. Refractive Error Study in Children: results from Shunyi District, China. Am J Ophthalmol. 2000;129:427–35. doi: 10.1016/s0002-9394(99)00452-3. [DOI] [PubMed] [Google Scholar]
- 24.Murthy GV, Gupta SK, Ellwein LB, et al. Refractive error in children in an urban population in New Delhi. Invest Ophthalmol Vis Sci. 2002;43:623–31. [PubMed] [Google Scholar]
- 25.Pokharel GP, Negrel AD, Munoz SR, Ellwein LB. Refractive Error Study in Children: results from Mechi Zone, Nepal. Am J Ophthalmol. 2000;129:436–44. doi: 10.1016/s0002-9394(99)00453-5. [DOI] [PubMed] [Google Scholar]
- 26.Goh PP, Abqariyah Y, Pokharel GP, Ellwein LB. Refractive error and visual impairment in school-age children in Gombak District, Malaysia. Ophthalmology. 2005;112:678–85. doi: 10.1016/j.ophtha.2004.10.048. [DOI] [PubMed] [Google Scholar]
- 27.Dandona R, Dandona L, Srinivas M, et al. Refractive error in children in a rural population in India. Invest Ophthalmol Vis Sci. 2002;43:615–22. [PubMed] [Google Scholar]
- 28.He M, Zeng J, Liu Y, et al. Refractive error and visual impairment in urban children in southern China. Invest Ophthalmol Vis Sci. 2004;45:793–9. doi: 10.1167/iovs.03-1051. [DOI] [PubMed] [Google Scholar]
- 29.Naidoo KS, Raghunandan A, Mashige KP, et al. Refractive error and visual impairment in African children in South Africa. Invest Ophthalmol Vis Sci. 2003;44:3764–70. doi: 10.1167/iovs.03-0283. [DOI] [PubMed] [Google Scholar]
- 30.Maul E, Barroso S, Munoz SR, et al. Refractive Error Study in Children: results from La Florida, Chile. Am J Ophthalmol. 2000;129:445–54. doi: 10.1016/s0002-9394(99)00454-7. [DOI] [PubMed] [Google Scholar]
- 31.Negrel AD, Maul E, Pokharel GP, et al. Refractive Error Study in Children: sampling and measurement methods for a multi-country survey. Am J Ophthalmol. 2000;129:421–6. doi: 10.1016/s0002-9394(99)00455-9. [DOI] [PubMed] [Google Scholar]
- 32.Barrett BT, Bradley A, Candy TR. The relationship between anisometropia and amblyopia. Prog Retin Eye Res. 2013;36:120–58. doi: 10.1016/j.preteyeres.2013.05.001. [DOI] [PMC free article] [PubMed] [Google Scholar]
- 33.Mehari ZA, Yimer AW. Prevalence of refractive errors among schoolchildren in rural central Ethiopia. Clin Exp Optom. 2013;96:65–9. doi: 10.1111/j.1444-0938.2012.00762.x. [DOI] [PubMed] [Google Scholar]
- 34.Megbelayin EO. Prevalence of amblyopia among secondary school students in Calabar, south-south Nigeria. Niger J Med. 2012;21:407–11. [PubMed] [Google Scholar]
- 35.Ajaiyeoba AI, Isawumi MA, Adeoye AO, Oluleye TS. Pattern of eye diseases and visual impairment among students in southwestern Nigeria. Int Ophthalmol. 2007;27:287–92. doi: 10.1007/s10792-007-9056-7. [DOI] [PubMed] [Google Scholar]
- 36.Wedner SH, Ross DA, Todd J, et al. Myopia in secondary school students in Mwanza City, Tanzania: the need for a national screening programme. Br J Ophthalmol. 2002;86:1200–6. doi: 10.1136/bjo.86.11.1200. [DOI] [PMC free article] [PubMed] [Google Scholar]
- 37.Yassur Y, Yassur S, Zaifrani S, et al. Amblyopia among African pupils in Rwanda. Br J Ophthalmol. 1972;56:368–70. doi: 10.1136/bjo.56.4.368. [DOI] [PMC free article] [PubMed] [Google Scholar]
- 38.Kittles RA, Santos ER, Oji-Njideka NS, Bonilla C. Race, skin color and genetic ancestry: implications for biomedical research on health disparities. Calif J Health Promot. 2007;5:9–23. [Google Scholar]
- 39.Guillery RW, Kaas JH. Genetic abnormality of the visual pathways in a “white” tiger. Science. 1973;180:1287–9. doi: 10.1126/science.180.4092.1287. [DOI] [PubMed] [Google Scholar]
- 40.Wolf AB, Rubin SE, Kodsi SR. Comparison of clinical findings in pediatric patients with albinism and different amplitudes of nystagmus. J AAPOS. 2005;9:363–8. doi: 10.1016/j.jaapos.2005.03.003. [DOI] [PubMed] [Google Scholar]
- 41.Creel D, O’Donnell FE, Jr, Witkop CJ., Jr Visual system anomalies in human ocular albinos. Science. 1978;201:931–3. doi: 10.1126/science.684419. [DOI] [PubMed] [Google Scholar]
- 42.American Academy of Ophthalmology Pediatric Ophthalmology/Strabismus panel. Preferred Practice Pattern Guidelines. San Francisco: American Academy of Ophthalmology; 2012. [Google Scholar]
Associated Data
This section collects any data citations, data availability statements, or supplementary materials included in this article.